Running head: Core/shell-like Intumescent Flame Retardant
Preparation and characterization of core/shell-like Intumescent
flame retardant and its flame retardance in Polypropylene
Kun Wu 1, Lei Song1, Zhengzhou Wang 1,2*, Yuan Hu 1*, Everson Kandare 3, Baljinder K. Kandola 3
1
State Key Laboratory of Fire Science, University of Science and Technology of China, Anhui 230026, PR China
2
School of Materials Science and Engineering, Tongji University, Shanghai 200092, PR China
3
Centre for Materials Research and Innovation, University of Bolton, Deane Road, Bolton, BL3 5AB, UK
Abstract:
With a shell of starch-melamine-formaldehyde (SMF) resin, core/shell-like ammonium polyphosphate (SMFAPP) is prepared by in situ polymerization, and is characterized by SEM, FTIR and XPS. The shell leads SMFAPP a high water resistance and flame retardance compared with APP in polypropylene (PP). The flame retardant action of SMFAPP and APP in PP are studied using LOI, UL 94 test and cone calorimeter, and their thermal stability is evaluated by TG. The LOI value of the PP/SMFAPP composite at the same loading is higher than that of the PP/APP composite. UL 94 ratings of PP/SMFAPP can reach V-0 at 30 wt% loading. The flame retardant mechanism of SMFAPP was studied by dynamic FTIR, TG and cone calorimeter, etc.
Keywords: Ammonium polyphosphate; Intumescent flame retardation; Microencapsulation; PP; Thermal degradation
*Corresponding author. Tel (Fax): +86-551-3601664 E-mail address: [email protected]
Introduction
Polyolefins, such as polyethylene, polypropylene and so on, are very important but flammable polymers. In order to reduce their flammability, flame retardants are added. Intumescent flame retardant (IFR) system has aroused a great attention in recent years because they are more environmentally friendly than the traditional halogen-containing flame retardant. IFR system is usually composed of three components: an acid source (e.g. ammonium polyphosphate, etc.), a carbonisation agent (e.g. pentaerythritol, starch, etc.) and a blowing agent (e.g. melamine, etc.). The classical association of ammonium polyphosphate (APP), pentaerythritol (PER) and melamine (MEL) is an efficient flame retardant (FR) system in polymeric matrices [1]. Bourbigot and his co-workers have done extensive studies on the APP intumescent flame retardant system in polyolefins [2-4], and reviewed the recent developments of the IFR systems in great detail [5].
UL 94 test because the scarcity of carbonization agents. In order to resolve this problem, PER or DPER is used. Though the adding of PER or DPER can increase the flame retardation of PP/MCAPP composites, the existences of PER or DPER may debase the water resistance of PP composites.
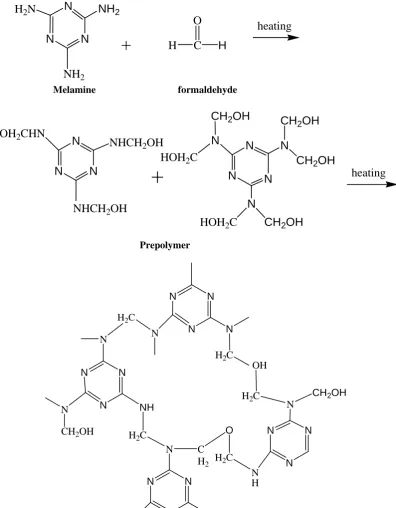
Melamine–formaldehyde (MF) resin is commonly used in the microencapsulation, for example red phosphorus [11], n-octadecane [12] and Phase-change materials [13], etc. Fig. 1 shows the reaction scheme of the formation of MF prepolymer and MF resin [14, 15]. Starch is an inexpensive and low toxic polysaccharide with many O-H groups and it can be used as carbonisation agent in IFR system. As a result, we synthesis prepolymer containing starch modified MF and then use the prepolymer to microencapsulate APP. Our aim is to obtain core/shell-like intumescent flame retardant which containing three components of typical IFR system: APP (be as acid source), starch (be as carbonisation agent) and melamine (be as blowing agent). The advantage is to synthesize a flame retardant which may have better water resistance and flame retardance in polymer than APP IFR system.
SMFAPP was studied by dynamic FTIR. Moreover, the water resistance of the PP composites containing SMFAPP (or APP) is studied by decrease of LOI value and water leaching rate.
Experimental
Materials
APP with average degree of polymerization n>1000 was kindly supplied by Hangzhou JLS Flame Retardants Chemical Corporation. Starch, Melamine and formaldehyde were purchased from Shanghai Chemical Reagent Corporation. PP (F401) with a melt flow index (MFI) of 2.3 g/10 min-1 (230 ◦C/2.16 kg) was provided by Yangzi Petroleum Chemical Company.
Preparation of core/shell-like APP
Synthesis of prepolymer: Starch (6, 9, 12, 15 or 18 g), 4 g melamine and 100 ml distilled water were put into a three-neck bottle with a stir. The mixture was adjusted to pH 4-5 with acetum, heated to about 90 ◦C and kept at that temperature for 1.5 h. After that the PH was adjusted by 10% Na2CO3 solution to 8-9, 4 g melamine and 10 ml 37% formaldehyde solution were added into the system. The temperate was kept at 90 oC for 1 h. The prepolymer solution was prepared and ready for next step.
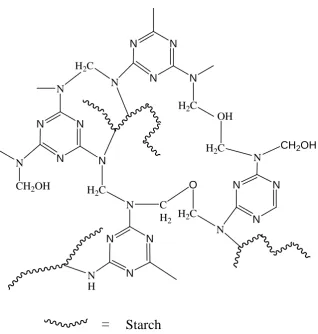
sulfuric acid. The resulting mixture was heated at 80 oC for 2 h. After that, the mixture was cooled to room temperature, filtered, washed with distilled water, and dried at 105 oC, and the SMFAPP powder was finally obtained. The supposed principal polymer repeat unit for shell of SMFAPP microcapsules is shown in Fig. 2.
Preparation of flame retarded PP composites
All flame retarded PP composites were prepared in a Brabender-like apparatus at a temperature about 180 oC for 15 min. After mixing, the samples were hot-pressed at about 180 oC under 10 MPa for 10 minutes into sheets of suitable thickness for analysis.
Measurements
Fourier Transform Infrared Spectra
Powders were mixed with KBr powders, and the mixture was pressed into a tablet. The Fourier transform infrared (FTIR) spectra of samples were recorded using a Nicolet MAGNA-IR 750 spectrophotometer.
Real time FTIR spectra were recorded using above spectrophotometer equipped with a ventilated oven having a heating device. The temperature of the oven was raised at a heating rate of about 10 oC/ min. Dynamic FTIR spectra were obtained in situ during the thermal degradation of the samples.
The X-ray photoelectron spectroscopy (XPS) spectra were recorded with a VG ESCALAB MK II spectrometer using Al kα excitation radiation (hν = 1253.6 eV).
Granulometry
The particle size distribution was determined by a laser diffraction particle analyzer (RISE2006, Jinan Rise science Co. Ltd, China). Before the measurement, the samples were dispersed in ethanol, and sonicated for 5 minutes.
Solubility in water
Sample (about 10 g) was put into 100 ml distilled water at different temperature and stirred at that temperature for 60 minutes. The suspension was then filtered. 50 ml of the filtrate was taken out and dried to constant weight at 105 ◦C. Solubility of samples in water can be calculated.
Scanning Electron Microscopy
The SEM micrographs of the particles and PP composites were obtained with a scanning electron microscope AMRAY1000B. The particles were sprinkled onto a double-sided tape, sputter coated with gold layer. The composites were cryogenically fractured in liquid nitrogen, and then sputter coated with the conductive layer.
Content of the SMF resin measurement
inductively coupled plasma atomic emission spectrometry (Atomscan Advantage, Thermo Jarrell Ash Corporation, USA) was used to measure the phosphorus content of APP or SMFAPP. The symbols PSMFAPP% and PAPP% represent the percentage of phosphorus in SMFAPP and APP, respectively.
Assuming the content of phosphorus remains constant in the process of the microencapsulation of APP, there exists following equation:
MAPP × PAPP% = MSMFAPP × PSMFAPP%
Where MAPP is the content of APP used, and MSMFAPP is the content of SMFAPP obtained. Therefore the percentage of the SMF resin (Wresin wt%) in SMFAPP can be expressed as follows:
Wresin wt% = 1-MAPP / MSMFAPP =(1-PSMFAPP%/ PAPP%) ×100%
If PSMFAPP % and PAPP% are measured, Wresin wt% can be calculated.
Limiting oxygen index
UL- 94 testing
The vertical test was carried out on a CFZ-2-type instrument (Jiangning Analysis Instrument Company, China) according to the UL 94 test standard. The specimens used were of dimensions 130×13×3 mm.
Water Leaching Rate
The specimens (marked Wa) used for measurement were put in distilled water at 50 oC and was kept at this temperature for 24 h. The treated specimens were subsequently taken out, and dried to constant at 105 oC (marked Wc). The water leaching rate of the specimens can be expressed as (Wa - Wc)/Wa×100%.
Thermogravimetry (TG)
Each sample was examined under air flow on a DTG-60H apparatus (Shimadzu Company) at a heating rate of 10 oC /min.
Cone calorimeter
The combustion tests were performed on the cone calorimeter (Stanton Redcroft,
UK) tests according to ISO 5660 standard procedures, with 100×100×3 specimens. Each specimen was wrapped in an aluminium foil and exposed horizontally to 35 kW/m2 external heat flux.
FTIR and XPS
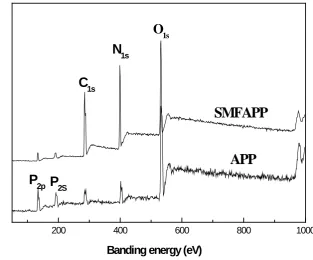
The FTIR spectra of melamine, SMFAPP, APP and SMF resin are shown in Fig. 3. For melamine, the NH2 group gives rise to absorption at 3550-3330 cm−1 (asymmetric stretch) and at 3450-3250 cm−1 (symmetric stretch) [16]. Above peaks disappear in SMF resin; it may be caused by the reactions between melamine and starch/formaldehyde.Bands in the region from 3250 to 3500 may be due to the OH of starch or NH of MF resin stretching vibrations [16]. The band at 1109 cm−1 can be assigned the C–O stretching of the ring of the starch [17]. The absorptions of 1562, 1502 and 1339 cm−1 are due to the ring vibration of melamine group from the SMF resin [11]. It is clear that for SMFAPP, the main absorption peaks appear at 3200, 1562, 1502, 1256, 1075, 1020, 880 and 800 cm−1. The typical absorption peaks of APP include 3200 (N-H), 1256 (P=O), 1075 (P-O symmetric stretching vibration), 880 (P-O asymmetric stretching vibration), 1020 (symmetric vibration of PO2 and PO3), and 800 (P-O-P) cm−1 [18]. The spectrum of SMFAPP reveals not only well-defined absorption peaks of SMF resin but also the characteristic bands of APP, indicating that the resin exist in the SMFAPP.
the resin.
Size distribution and Morphology
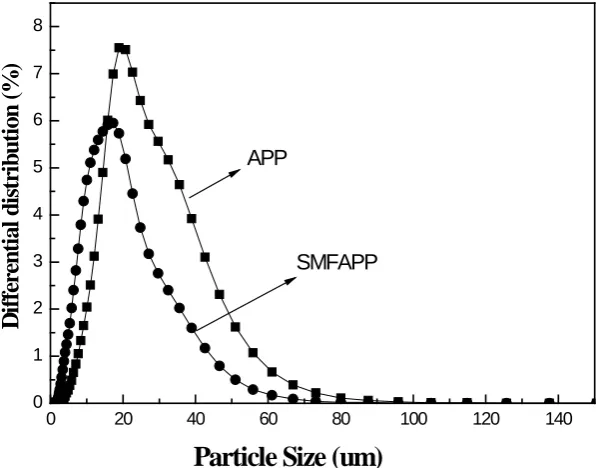
The particle size distributions of APP and SMFAPP are shown in Fig. 5. It can be found that the size distribution of APP is wider than that of SMFAPP. Due to the microencapsulation, the D50 value of MUFAPP is 13.577 μm, smaller than APP’s 20.296 μm. From the difference of size distribution, it is expected that SMFAPP
would have better dispersion in polyolefins than APP when SMFAPP is blended with the polymers.
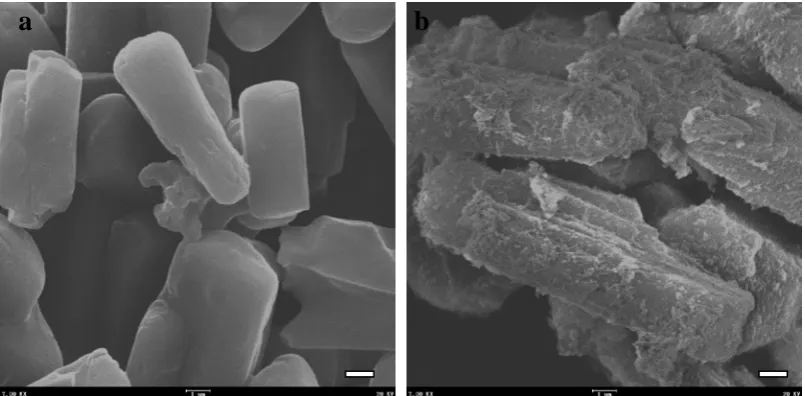
Fig. 6 shows the surface morphologies of APP and SMFAPP. It is clear that the surface of APP particle is very smooth, as Fig. 6a shows. After microencapsulation, SMFAPP presents a comparably rough surface. And it is interesting to found that some smaller particles with a diameter less than 0.1 μm are scattered on the surface of SMFAPP, and they appear to be SMF resin microparticles.
Above results also suggest the coating of APP with the SMF resin.
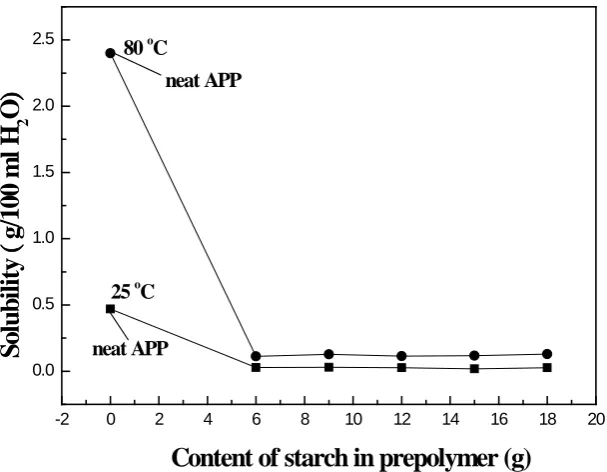
Water solubility of SMFAPP
SMFAPP decreases above 90% at 25 ºC. As the content of the starch increases further, the solubility of SMFAPP changes little. The change trend of solubility of SMFAPP at 80 ºC is similar to that of SMFAPP at 25 ºC. It is interesting to find that there is a great difference of solubility of APP at 25 ºC and 80 ºC. However, the difference of solubility of SMFAPP at 20 ºC (0.02 g/100 ml H2O) and 80 ºC (0.12 g/100 ml H2O) is small. This is because the SMF resin outside APP is hydrophobic, leading to the decrease of the solubility of APP. Above results also indicate that APP was well microencapsulated by the resin.
Flame retardation of PP composites
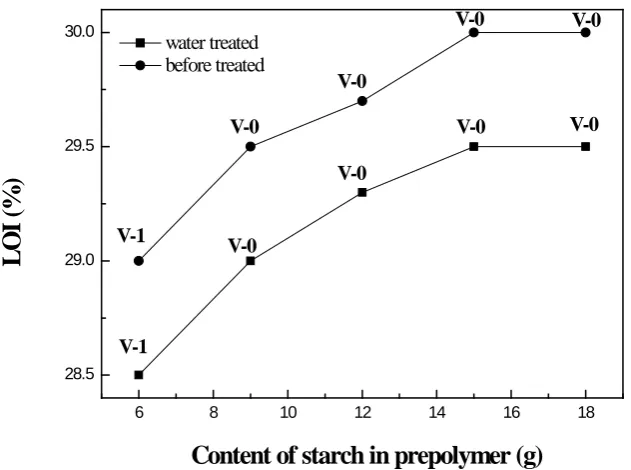
The influence of content of starch in prepolymer on the LOI values of PP/SMFAPP composites is shown in Fig. 8. SMFAPP is blend with PP at the mass percentage of 30%. From the figure, it can be seen that with the increase of starch content, LOI value increase. It is suggested that a suitable phosphorus/nitrogen/carbon ratio in the IFR system is very important for the flame retardation of FR composites. Also, it should be noticed that the UL 94 results of most of PP/SMFAPP composites can reach V-0. From above results, the SMFAPP sample prepared with prepolymer containing 15 g starch was selected for the flame retardation of PP composites. And from the equation of 2.5.5, it can be calculated that this SMFAPP sample is coated with 24.8% resin.
and PER is 1:1) composite at the same additive level is only 20.0% and 28.0% [9]. It is clear that APP used alone in PP do not have good flame retardancy (no ratings in the UL-94 test), the reason for this is due to the scarcity of carbonization and blowing agent. When PER is incorporated into the PP/APP composites, a remarkable improvement of flame retardation is observed. But it should be noticed that due to the presence of SMF resin outside APP, the LOI value of PP/SMFAPP is higher than that of PP/APP/PER composites. The explanation for the increase may be due to the fact that when the PP composites containing SMFAPP are heated, the resin in the coating layer of APP releases water vapor and NH3 gases which would reduce the concentration of air and make the material swell to form intumescent char.
Water resistance of FR PP composites
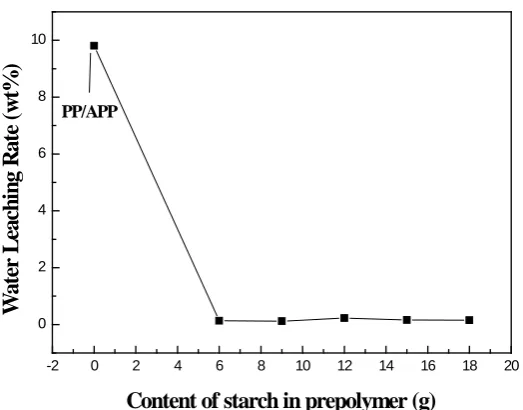
Water leaching Rates of PP/APP and PP/SMFAPP versus content of starch in prepolymer are shown in Fig. 9, it can be seen that through microencapsulation, leaching rate of FR PP composites reduce much, from 9.81% to 0.23% as the percentage of SMFAPP in PP composites is 30%. It also can be found that due to the hydrophobicity of SMF resin, with the increase of content of starch in prepolymer, leaching rates of PP/SMFAPP change little. So when exposure in water medium, the comparatively better dispersion and less solubility of SMFAPP in PP matrix would prevent IFRs from being exuded, and a certain flame retardancy of composite can still be maintained.
SMFAPP after the hot water treatment (50 oC, 24 h) are shown in Fig.8. For the PP/APP binary composite at 30.0% additive level, their LOI values are about 20.0% before the treatment, and the values decrease by 2.5% after the hot water treatment. The LOI value of some of PP/SMFAPP composite at a loading 30% are 30.0%, whereas the value is still as high as 29.5% after the treatment. In spite of the decrease in the LOI values of the PP/SMFAPP composites after treated, a good maintaining of the UL-94 ratings is observed (most are still V-0 rating). Moreover, though PP/APP/PER or PP/APP/DPER composites can reach V-1 in UL 94 testing, there were no ratings for above ternary composites after water treatment (50 oC, 24 h) [9, 10]. Therefore, conclusion can be drawn that the water resistance of SMFAPP is much better than APP intumescent flame retardant system in PP composites.
Thermal analysis
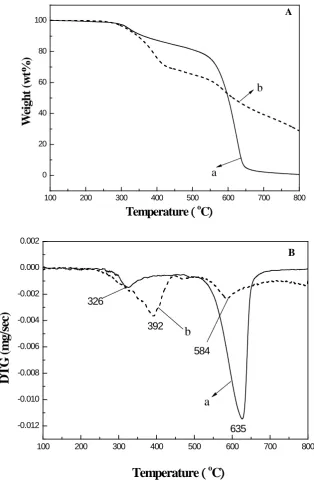
The TG and DTG curves of APP and SMFAPP are shown in Fig.11. APP has two main decomposition processes. It begins to decompose at about 270 oC. The evolution products in the first process are mainly ammonia and water (about 20% mass loss), and crosslinked polyphosphoric acids (PPA) are formed simultaneously [19]. The second process occurs in the range 500-700 oC, which is the main decomposition process of APP, and weight loss is about 78%. The temperatures of maximum mass loss rate (Tmax) for the two steps are 326 oC and 625 oC, respectively, as shown in Fig. 7B. The residual weight of APP is 0.6% at 800 oC.
It can be seen that initial decomposition temperature of SMFAPP is similar with that of APP. But at the lower temperature, SMFAPP decomposes faster than APP owing to the less thermal stability of SMF resin in SMFAPP and the esterification between APP and starch. The resin out side APP on heating produces nonflammable gases, such as NH3 and CO2, which are helpful in forming a “honeycomb” char structure. So beyond the temperature of 599 oC, SMFAPP is more stable than APP. The Tmax values for main three steps of SMFAPP decomposition are 392 and 584 oC, respectively. Moreover, SMFAPP after decomposition at 800 oC left about 28.4% residue, which is much higher than that of APP.
decomposition is 299 oC, as shown in Fig. 12 A.
The thermal decomposition of the PP/APP composite includes three steps. Its initial decomposition temperature is a bit higher than that of PP. The composite PP/APP decomposes initially at about 250 oC, which is caused by the decomposition of APP. The second step of mass loss is the main decomposition process of PP in the composite, and its Tmax in this step is 366 oC. The third step occurs at above 500 oC due to the further decomposition of the char.
It can be seen in Fig. 8A that the decomposition of PP/SMFAPP is similar with PP/APP at lower temperature. However, at the temperature higher than 360 oC, the composite containing with SMFAPP is more thermally stable than the composite containing APP. The Tmax values of the main decomposition steps of PP/SMFAPP are 276, 349 and 632 oC, respectively. And the residue left at 800 oC of PP/SMFAPP is 1.7% which is high than that of PP/APP. The increase of amount of residue of the composite may be due to the formation of more thermally stable char. From above results, conclusion can be drawn that SMFAPP is better than APP in improving the thermal stability of the PP composite at high temperature.
Thermal degradation of SMFAPP
To study the flame retardant mechanism of SMFAPP in polymers, we used dynamic FTIR to evaluate the thermal degradation of SMFAPP.
correspond to -NH4 (1434 cm-1) of APP [16] disappear; this may be related with the the elimination of NH3. These results demonstrate that the evolution products in the first process are mainly ammonia and water, and crosslinked polyphosphoric acids (PPA) are formed simultaneously. As the pyrolysis temperature increases, the 1256 cm-1 peak (P=O) move to a higher waver number [18]. It may be caused by the scission of P-O-N of APP and dehydration of PPA and starch. Moreover, we should notice the absence of the absorptions of 1560 cm−1 which are due to the ring vibration of melamine groups [11] at about 350 oC; it can be explained by the fact that melamine is disassociated and evaporates at higher temperatures. It is interesting to find that between the range of 400 and 600 oC, the shape of spectra show few change. It may be related with the formation of stable structures containing P-O-P and P=O (1075, 1020, 880 cm-1) complexes [11].
These dynamic thermal degradation data give positive evidences of the flame retardant mechanism: SMFAPP can release the acid and form a stable charred layer in the condensed phase during burning of polymer materials, and the shell outside SMFAPP releases water vapor and NH3 gases which would reduce the concentration of air and make the material swell to form intumescent char. These char slow down heat and mass transfer between the gas and condensed phases and prevent the underlying polymeric from further combust. These results are in agreement with the data of TG, LOI and UL 94.
Cone calorimetry is an effective approach to evaluate the combustion behavior of flame retardant polymers. Heat Release Rate (HRR) results of PP and FR PP composites containing 30 wt% flame retardant are shown in Fig. 14. The presence of IFR systems in PP decreases the HRR values strongly compared with pure PP (the HRR peak of pure PP is 1177 kW/m2). In case of the PP/APP composite, its HRR peak is behind of that of pure PP, and its value is a little lower (1064 kW/m2) than that of PP. However, it is noted that the ignition time (IT) of the PP/APP composite (24 s) is smaller than that of PP (44 s). The reason may be due to the fact that APP decomposes earlier than pure PP after the cone heater irradiated the surface of the composite, and some small volatile molecules are produced from the decomposition of APP.
The appearance of FR PP composites residues at the end of cone calorimeter tests were shown in Fig. 15. It is clear that there is almost no residue left at the end of the cone calorimeter test for PP/APP composite. On the other hand, the surface of PP/SMFAPP residue is covered with an expanded char network. The residue left by PP/SMFAPP is mainly formed of thick black char which is better than that of PPAPP when protect the underlying materials. It can be concluded that a good and coherent char can prevent the heat transfer and flame spread, and thus protect the underlying materials from further burning.
Conclusion:
In this work, APP was microencapsulated with starch-melamine-formaldehyde resin by in situ polymerization method to obtain core/shell-like IFR. Core/shell-like APP (SMFAPP) decreases its water solution, increases its water resistance and flame retardance in PP. The LOI values of the PP/SMFAPP composites increases compared with that of the PP/APP or PP/APP/PER composites at the same loading. It has been found that APP used alone in PP does not reach UL- 94 V-0 rating and SMFAPP used alone in PP can reach V-0 at the additive level 30%. It also can be found that after water treatment at 50 oC for 24 h, the PP/SMFAPP could still maintain good flame retardant properties (V-0).
release water vapor and NH3 gases which would reduce the concentration of air and make the material swell to form intumescent char. The intumescent and stable char may prevent the underlying materials from further burning.
Acknowledgements
The financial support from the National Natural Science Foundation of China (No. 20776136) and the program for New Century Excellent Talentsin University and National 11th Five-year Program (2006BAK01B03 、 2006BAK06B06 、 2006BAK06B07) is acknowledged.
Reference
[1] Liu, M. F., Liu, Y., Wang, Q. (2007) Macromol. Mater. Eng., 292: 206-213.
[2] Le Bras, M., Bourbigot, S., Delporate, C., Siat, C., Le Tallec, Y. (1996) Fire Mater., 20: 191-203.
[3] Almeras, X., Le Bras, M., Hornsby, P., Bourbigot, S., Marosi, G., Keszei, S., Poutch, F. (2003) Polym. Degrad. Stab., 82: 325-331.
[4] Almeras, X., Le Bras, M., Poutch, F., Bourbigot, S., Marosi, G., Anna, P. (2003) Macromol. Symp., 198: 435-447.
[5] Bourbigot, S., Le Bras, M., Duquesne, S., Rochery, M. (2004) Macromol. Mater. Eng., 289: 499-511.
[7] Saihi, D., Vroman, I., Giraud, S., Bourbigot, S. (2005) React. Funct. Polym., 64: 127–138.
[8] Saihi, D., Vroman, I., Giraud, S., Bourbigot, S. (2006) React. Funct. Polym., 66: 1118–1125.
[9] Wu, K., Wang, Z.Z., Liang, H.J. (2008) Polym. Compos., 29: 854–860. [10] Wu, K., Wang, Z.Z., Hu, Y. (2008) Polym. Adv. Technol., 19: 1118–1125. [11] Wu, Q., Lv, J.P,. Qu, B.J. (2003) Polym. Int., 52:1326–1331.
[12] Zhang, X.X., Fan, Y.F., Tao, X.M., Yick, K.L. (2004) Mater. Chem. Phys., 88:300-307.
[13] Shin, Y., Yoo, D., Son, K. (2005) J. Appl. Polym. Sci., 96:2005-2010.
[14] Yuan, L., Liang, G.Z., Xie, J.Q., Li, L., Guo, J. (2006) Polymer, 47:5338–5349. [15] Lee, Y.H., Kim, C.A., Jang, W.H., Choi, H.J., Jhon, M.S. (2001) Polymer,
42:8277-8283.
[16] Colthup, N.B., Daly, L.H., Wiberley, S.E. Introduction To Infrared and Raman Spectroscopy, 2nd ED, Academic Press: Boston, 1990.
[17] Rubens, P., Snauwaert, J., Heremans, K., Stute, R. (1999) Carbohydr. Polym., 39:231–235.
[18] Bugajny, M., Bourbigot, S., Le Bras, M. (1999) Polym. Int., 48:264-270.
Figure Captions
Fig. 1 The reaction scheme of the formation of MF prepolymer and MF resin Fig. 2 Supposed principal polymer repeat unit for shell of microcapsules Fig.3 FTIR spectra of (a) melamine; (b) SMFAPP; (c) APP; (d) SMF resin Fig. 4 XPS spectra of APP and SMFAPP
Fig. 5 Particle size distributions of APP and SMFAPP
Fig. 6 SEM micrographs of surface morphology (× 7000): (a) APP and (b) SMFAPP; Scale-bars represent 1 µm
Fig. 7 Solubility of APP and SMFAPP versus content of starch in prepolymer
Fig. 8 LOI values of PP/SMFAPP before and after water treatment versus content of starch in prepolymer
Fig. 9 Water leaching Rate of PP/APP and PP/SMFAPP versus content of starch in prepolymer
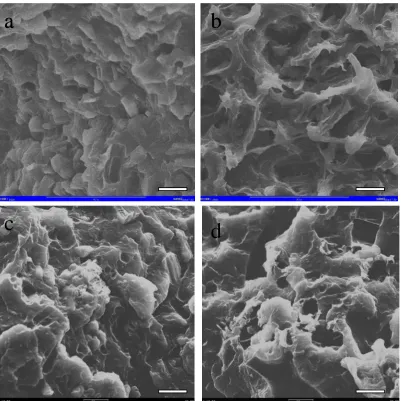
Fig. 10 SEM micrographs of fracture surfaces of the composites (× 1500): (a) PP/APP; (b) PP/APP (50 oC, 24h); (c) PP/SMFAPP; (d) PP/SMFAPP (50 oC, 24h). Scale-bars represent 10 µm
Fig. 11 TG (A) and DTG (B) curves of (a) APP and (b) SMAFPP
Fig. 12 TG (A) and DTG (B) curves of (a) PP; (b) PP/APP; (c) PP/SMFAPP Fig. 13 Dynamic FTIR spectra of SMFAPP with different pyrolysis temperatures Fig. 14 Heat Release Rate curves of PP, PP/APP and PP/SMFAPP
N N N NH
2
H2N
NH2 C O H H heating
+
N NN NHCH2OH
HOH2CHN
+
N NN N
CH2OH
N CH2OH
HOH2C
N
CH2OH
HOH2C
CH2OH
NHCH2OH
Melamine formaldehyde Prepolymer heating N N N N
H2C
OH
H2C
N
N
N N
CH2OH
N H H2C
O C H2 N N N N
H2C
N
N N
NH
N H2C
N
N
CH2OH
Fig. 1 The reaction scheme of the formation of MF prepolymer and MF resin
N
N N
N
H2C
OH
H2C
N
N
N N
CH2OH
N
H2C
O C H2 N N N N
H2C
N
N N
N
N
H2C
N
N
CH2OH
N H
=
Starch
3500 3000 2500 2000 1500 1000 500 1562
1502
T
ra
n
sm
it
ta
n
ce(
%
)
Wave number
(
cm
-1)
3468 3338 a
b
c
d
1562 1502
3200
1339 1256
1075 1020880
800
1109
200 400 600 800 1000
SMFAPP
APP
O
1sN
1sC
1sP
2SP
2pBanding energy (eV)
R
el
at
ive I
n
ten
si
ty (
au
)
0 20 40 60 80 100 120 140 0
1 2 3 4 5 6 7 8
D
iffe
re
n
ti
a
l d
is
tr
ib
u
ti
o
n
(%
)
Particle Size (um)
APP
SMFAPP
Fig. 6 SEM micrographs of surface morphology (× 7000): (a) APP and (b) SMFAPP; Scale-bars represent 1 µm
-2 0 2 4 6 8 10 12 14 16 18 20 0.0
0.5 1.0 1.5 2.0 2.5
25 oC
80 oC
neat APP
neat APP
Content of starch in prepolymer (g)
S
olu
b
ilit
y
(
g/
100 m
l H
2
O
)
6 8 10 12 14 16 18 28.5
29.0 29.5 30.0
V-1 V-1
V-0
V-0
V-0
V-0
V-0
V-0 V-0
V-0
Content of starch in prepolymer (g)
L
O
I (
%)
water treated before treated
-2 0 2 4 6 8 10 12 14 16 18 20 0
2 4 6 8 10
PP/APP
Content of starch in prepolymer (g)
W
at
er L
ea
ch
in
g R
at
e (
w
t%
)
Fig. 10 SEM micrographs of fracture surfaces of the composites (× 1500): (a) PP/APP; (b) PP/APP (50 oC, 24h); (c) PP/SMFAPP; (d) PP/SMFAPP (50 oC, 24h). Scale-bars represent 10 µm
a
b
a
b
100 200 300 400 500 600 700 800 0 20 40 60 80 100 b W ei g h t (w t% )
Temperature (oC)
a
A
100 200 300 400 500 600 700 800 -0.012 -0.010 -0.008 -0.006 -0.004 -0.002 0.000 0.002 b
Temperature
(
oC
)
D T G ( m g /s ec) a 326 635 392 584 B
100 200 300 400 500 600 700 800 0 20 40 60 80 100 c b
Temperature
(
oC
)
W
ei
gh
t (w
t%
)
a A100 200 300 400 500 600 700 800
-0.014 -0.012 -0.010 -0.008 -0.006 -0.004 -0.002 0.000 0.002 c b
Temperature
(
oC
)
D
T
G
(
m
g
/s
ec)
a 276 366 605 276 632 349 B3500 3000 1500 1000
Wave number
(
cm
-1)
600 oC 550 oC
500 oC 450 oC 400 oC 350 oC 300 oC 250 oC 200 oC 150 oC
100 oC
25 oC 3200
1504
1434 1256
10751020 880 1667
0 100 200 300 400 500 0
200 400 600 800 1000 1200
Time (s)
H
ea
t R
el
ea
se R
at
e
(
Kw
/m
2 )
PP PP/APP PP/SMFAPP
Fig.15 Residues at the end of cone calorimeter test: (a) PP/APP; (b) PP/SMFAPP