Ann. Geophys., 27, 617–622, 2009 www.ann-geophys.net/27/617/2009/
© Author(s) 2009. This work is distributed under the Creative Commons Attribution 3.0 License.
Annales
Geophysicae
Communica
tes
Method for assessing the amplitude modulation of the stationary
planetary waves
P. Mukhtarov, D. Pancheva, and B. Andonov
Geophysical Institute, Bulgarian Academy of Sciences, Sofia, Bulgaria
Received: 16 December 2008 – Revised: 25 January 2009 – Accepted: 27 January 2009 – Published: 9 February 2009
Abstract. This short-communication presents a new method for assessing the amplitude modulation of the stationary planetary waves (SPWs). The suggested procedure al-lows estimating the contribution of the amplitude modulated SPWs to the field of the zonally travelling planetary waves. The root of the method consists in calculating of a quantity that is analogous to 2-D Lomb-Scargle amplitude spectrum and also the relative error of the approximation. The ampli-tude “spectra” of the SPWs give information about the pe-riod(s) of modulation, while the relative errors - define the coefficient(s) of modulation. The suggested method is ap-plied to the UKMO temperature data for the Arctic winter of 2004–2005.
Keywords. Meteorology and atmospheric dynamics (Gen-eral circulation; Middle atmosphere dynamics; Waves and tides)
1 Introduction
The dynamics of the middle atmosphere in winter are known to be dominated by planetary waves of large amplitudes. The most important are quasi-stationary Rossby waves and travelling planetary wave normal modes, also known as free modes with periods around 2, 5, 10 and 16 days. The interac-tion of the planetary waves and the zonal mean flow is known to be the major driver of the variability of the winter strato-spheric dynamics (Andrews et al., 1987). It is known also that the zonal mean flow affects the planetary wave propaga-tion by changing the refractive index (Charney and Drazin, 1961). The stationary planetary waves (SPWs) are particu-larly sensitive to the variations in the zonal mean flow and their vertical penetration to the mesosphere could be fully
Correspondence to: D. Pancheva ([email protected])
prohibited when the zonal mean flow changes its direction from eastward to westward. Therefore, the transient behav-ior of the planetary waves in general, and the vacillation of the SPWs in particular, are defined mainly by the coupling processes and the dependence of their vertical propagation from the variability of the zonal mean flow.
The problem of planetary wave coupling between the stratosphere and mesosphere has attracted significant atten-tion recently. It is supposed that much of the variability in the mesosphere and lower thermosphere (MLT) is a re-sult of upward propagation of disturbances from the strato-sphere, particularly during the winter. Analysis of the global stratosphere data like UK Met Office (UKMO) assimilated fields (Swinbank and Ortland, 2003) or the National Centre for Environmental Prediction (NCEP) reanalysis data (Ran-del, 1992) provided observational evidence for interactions between the zonally propagating planetary waves, quasi-stationary planetary waves and the zonal mean flow (Kr¨uger et al., 2005; Pancheva et al., 2007, 2008a). The satellite mea-surements as those of the HRDI and WINDII instruments onboard the UARS satellite and particularly recent measure-ments of the SABER and TIDI instrumeasure-ments onboard the TIMED satellite were employed to explore not only the tem-poral behavior and spatial structures of the planetary waves from lower stratosphere to the lower thermosphere (Wang et al., 2000; Forbes et al., 2002) but the coupling processes as well (Palo et al., 2005; Merzlyakov and Pancheva, 2007).
618 P. Mukhtarov et al.: Assessing the amplitude modulation of stationary planetary waves
10 11 12 13 14 15 16 17 18 19 20 0.0
0.1 0.2 0.3 0.4 0.5 0.6 0.7 0.8 0.9 1.0
Coefficient of modulation
0.66 0.73 0.80 0.87 0.94 1.00 1.07
Amplitude 'spectra' of SPW1
10 11 12 13 14 15 16 17 18 19 20
Period (days)
0.0 0.1 0.2 0.3 0.4 0.5 0.6 0.7 0.8 0.9 1.0
Coefficie
n
t of modulation
0.0 0.8 1.5 2.3 3.0 3.8 4.5
[image:2.604.60.294.72.318.2]Relative error
Figure 1
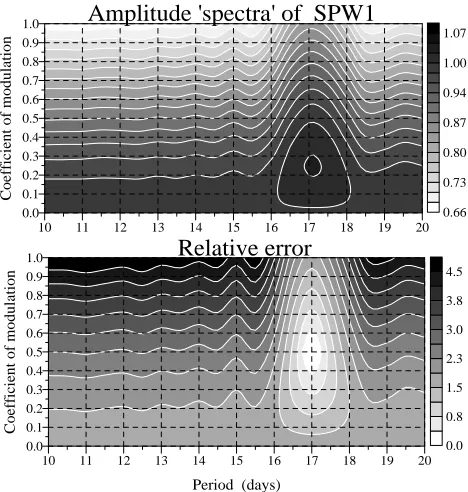
Fig. 1. Upper plot: Amplitude “spectra” of the simulated by Eq. (1)
SPW1 (for details see the text) derived from the data of the entire time series; the procedure for least squares best fitting is performed for periods of the modulating oscillation from 10 to 20 days with a step of 0.5 day, phases from−180◦to 180◦with a step of 1◦and for coefficients of modulation changing from 0 to 1 with a step of 0.1; bottom plot: Relative errors of the “spectra” expressed by the standard deviation of the approximation normalized by the effective wave amplitude (the amplitude divided by√2).
least-squares fitting procedure performed on running time windows with a given length. Later this approach has been successfully applied to the SABER satellite data (Pancheva et al., 2009a, b). In the latter case besides the planetary waves the migrating and nonmigrating 24-h and 12-h tides with zonal wavenumbers up to 4 have been added in the decompo-sition procedure as well. The main advantage of the simul-taneous extraction of the tides and planetary waves from the satellite data consists in avoiding a possible distortion of the weaker waves by the stronger ones, as well as some aliasing effects between the tides and SPWs. This analysis method provides also a possibility for a detailed documentation of all planetary waves and migrating and nonmigrating tides.
In Pancheva et al. (2009b) has been noted that the use of a linear fitting procedure has some peculiarities connected with the contribution of the amplitude modulated SPWs to the determined zonally travelling waves. The basic aim of this short-communication is to present a new method for over-coming this limitation, i.e. a method for assessing the ef-fect of the amplitude modulated SPWs (so called SPW vac-illations) on the determined by the decomposition procedure zonally travelling planetary waves.
2 Method for assessing the amplitude modulation of the SPWs derived by the simulated time series
It is known that usually the SPWs can be composed of sta-tionary and quasi-stasta-tionary components. The latter compo-nent is stationary in phase but it tends to fluctuate in ampli-tude (if there is a phase modulation of the SPW this means that it becomes a travelling wave). If we assume that the amplitude of the quasi-stationary component of the SPW is periodically modulated then it can be represented as:
2 (t, λ)=A (1+kcos(t−ϕ))cos(sλ−ψ ) (1) where λ is longitude; k=const as well as 0≤k≤1 and it is known as a coefficient of modulation (or as a depth of the modulation);A,s andψ are respectively the amplitude, wavenumber and phase of the SPW, whileandφare the frequency and phase of the modulation. The expression (1) can be rewritten as:
Acos(sλ−ψ )+Ak
2 cos(t−sλ−(ϕ−ψ )) +Ak
2 cos(t+sλ−(ϕ+ψ )) (2)
Therefore, in order to consider a SPW together with two trav-elling waves as an amplitude modulated SPW it is necessary not only the travelling in the opposite directions waves to have equal amplitudes (Ak/2) and wavenumbers (s), but also their phase difference has to be exactly the double phase of the SPW.
The presence of the amplitude modulated SPW in the data could be searched directly through finding a function de-scribed by Eq. (1) where the amplitude A, frequency , phasesφandψ, and the coefficient of modulationkare un-known parameters and have to be determined by the least squares best fitting procedure. Such problem however is a nonlinear one and it requires the variation of some of the un-known parameters under the condition for the best fit.
P. Mukhtarov et al.: Assessing the amplitude modulation of stationary planetary waves 619
0 30 60 90 120 150 180
Day Number (start 1 October 2004) 0
60 120 180 240 300 360
L
o
ng
itu
de
(de
g
re
e)
UKMO Temperature at 50N; h=40 km
210 220 230 240 250 260 270 280 290
[image:3.604.311.545.71.319.2]Figure 2
Fig. 2. Longitude-time cross section of the daily UKMO
tempera-tures for 50◦N latitude and at 40 km altitude for the period of time from 1 October 2004 to 31 March 2005.
The data from the entire simulated time series are used for deriving the likewise amplitude spectra of the SPW1. The results are shown in the upper plot of Fig. 1. A clear peak at 17 days can be distinguished from the “spectra”, however because the problem is nonlinear the spectral amplitudes for
k<0.5 are slightly larger that the simulated amplitude which is equal to 1. However, for modulating period of 17 days andk=0.5 the spectral amplitude is equal to 1, i.e. the best fit result completely coincides with the simulated data. It is worth noting also that the derived phases of the SPW1 and modulating oscillation coincide with the simulated ones (not shown result).
The bottom plot of Fig. 1 presents the relative errors of the “spectra” expressed by the standard deviation of the ap-proximation normalized by the effective wave amplitude (the amplitude divided by√2). In this case the minimum of the error (which is zero for the simulated time series) coincides exactly with the given modulating period of 17 days and co-efficient of modulationk=0.5.Therefore, the calculated am-plitude “spectra” of the SPW1, shown in the upper plot of Fig. 1, indicate the period of the modulation while the de-rived minimum of the relative errors (bottom plot of Fig. 1) defines the coefficient of modulation. It is worth noting that the above suggested method actually gives full information about that part of the SPW which is the amplitude modulated one, i.e. described by Eq. (1): its amplitude, phase and co-efficient of modulation as well as the period (frequency) and phase of the modulating oscillation.
3 Application of the suggested method on the UKMO temperature data for the Arctic winter of 2004–2005
In order to demonstrate how the suggested method works we investigate the UK Mett Office (UKMO) temperature data for the Arctic wintertime from 1 October 2004 to 31 March 2005. Figure 2 shows the longitude-time cross-section of the daily UKMO temperatures for latitude of 50◦N and at alti-tude of 40 km (where usually the SPWs have the largest am-plitudes in the stratosphere). A careful inspection of the raw
6 8 10 12 14 16 18 20 22 24 26 28 30 0.0
0.1 0.2 0.3 0.4 0.5 0.6 0.7 0.8 0.9 1.0
Coefficient of modulation
4.6 4.9 5.2 5.5 5.8 6.1 6.4 6.7 7.0
Amplitude 'spectra' of SPW1
6 8 10 12 14 16 18 20 22 24 26 28 30
Period (days)
0.0 0.1 0.2 0.3 0.4 0.5 0.6 0.7 0.8 0.9 1.0
Coefficie
n
t of modula
tion
10.5 11.4 12.4 13.3 14.3 15.2 16.1 17.1
Relative Error
Figure 3
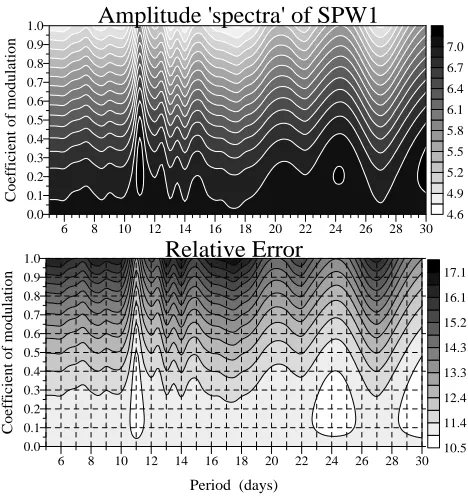
Fig. 3. The same as Fig. 1 but the calculations are done for the
UKMO temperature data shown in Fig. 2 and the procedure for least squares best fitting is performed for periods of the modulating os-cillation from 5 to 30 days with a step of 0.5 day.
data indicates that the first part of the winter is dominated by eastward propagating waves, while from December to March the SPW1 situated near longitude of 100◦is clearly outlined. The figure shows also that while the phase of the SPW1 is almost stable its amplitude is variable with the time, hence this is an amplitude modulated SPW1. In order to define the parameters of the modulation we apply the above suggested method to the daily UKMO temperature data.
[image:3.604.52.286.73.186.2]620 P. Mukhtarov et al.: Assessing the amplitude modulation of stationary planetary waves
4 6 8 10 12 14 16 18 20 22 24 26 28 30
Period (days) 0
0.5 1 1.5 2 2.5
Sp
e
c
tr
al
Am
p
li
tu
d
e (
K
) W1
E1
Amp SPW1=7 K
Figure 4
Fig. 4. A 2-D Lomb-Scargle amplitude spectra for zonal
wavenum-ber 1 calculated for periods between 5 and 30 days; the spectrum of the E1 waves is in red color, while that of the W1 ones – in blue; the mean amplitude of the SPW1 is noted in the upper right side of the plot.
The application of the suggested new method for assessing the amplitude modulation of the SPW1 seen in the UKMO temperature data for 50◦N latitude and 40 km altitude re-vealed that the SPW1 with average amplitude of ∼7 K (see upper plot of Fig. 3) is amplitude modulated with periods of 11 and 24 days and coefficients of modulations respec-tively ∼0.275 and ∼0.225. Then according to Eq. (2) the modulated SPW1 can be expressed as a sum of a SPW1 with constant amplitude of ∼7 K and two couples of prop-agating in the opposite directions planetary waves with zonal wavenumber 1 and periods of 11 and 24 days with ampli-tudes of∼1 K and 0.8 K respectively. Therefore, if the plan-etary waves from the UKMO data are extracted by a linear two-dimensional (time-longitude) least-squares fitting proce-dure (Pancheva et al., 2008b), then we have to have in mind that the results for the zonally travelling waves with zonal wavenumber 1 (i.e. eastward E1 and westward W1) and pe-riods of 11 and 24 days would be affected by the amplitude modulated SPW1.
Figure 4 shows the 2-D Lomb-Scargle amplitude spectra for zonal wavenumber 1 calculated from the UKMO tem-perature data for the Arctic winter of 2004–2005, where the spectrum for E1 waves is in red color, while that for W1 – in blue. In general, the E1 waves with periods near 11, 20 and 24 days (there is a peak at the end of the period range but its exact period cannot be defined) prevail in the Northern Hemi-sphere (NH) stratoHemi-sphere during the winter of 2004–2005, which is quite unusual situation. We remind that the pres-ence of eastward propagating planetary waves is clearly evi-dent even in the raw data (see Fig. 2). The above mentioned periods have also W1 components, but they are weaker than the E1 ones. The 15-d W1 planetary wave however is a dom-inant westward propagating wave during the considered win-ter. The average amplitude of the SPW1 for the entire period of time (October 2004–March 2005) is 7 K and it is noted in the upper right side of Fig. 4. Therefore, the average
ampli-tude of the SPW1 is equal to the found average ampliampli-tude of the modulated component of the sum SPW1 shown in the up-per plot of Fig. 3. This result indicates that in the Arctic win-ter of 2004–2005 the SPW1 seen in the UKMO temperature data consists mainly of an amplitude modulated component. Additionally, the Lomb-Scargle results for the zonally prop-agating waves with periods of 11 and 24 days are affected by the amplitude modulated SPW1 and the genuine zonally propagating E1 and W1 waves are weaker than those shown in Fig. 4.
4 Discussion
The main focus of this short-communication is to present a new method for assessing the amplitude modulation of the SPWs. The suggested procedure allows estimating the con-tribution of the amplitude modulated SPWs to the field of the zonally travelling planetary waves described by the expres-sion (2). The root of the method consists in calculating the likewise amplitude “spectra” of the SPW (see upper plots of Figs. 1 and 3) taking into consideration that it is described by Eq. (1). These “spectra” indicate the period(s) of modula-tion, while the relative errors of the approximation (see bot-tom plots of Figs. 1 and 3) define the coefficient(s) of modu-lation of the found period(s). We remind that the suggested new method define also the phase of the amplitude modu-lated SPW as well as the phase of the modulating oscillation. The suggested method has been applied to the UKMO temperature data for the Arctic winter of 2004–2005. In or-der to demonstrate how the procedure works the data at al-titude of 40 km and laal-titude of 50◦N have been analyzed in detail and the SPW1 have been considered particularly. The same analysis could be done for the SPW2 but in this case the modulation will affect the zonally travelling waves with zonal wavenumber 2. The derived results shown in Fig. 3 indicated that: (i) the SPW1 seen in the UKMO temperature data in the Arctic winter of 2004–2005 consists mainly of an amplitude modulated component, (ii) the amplitude of SPW1 during the considered winter is modulated with periods of 11 and 24 days, and (iii) the average (for the entire winter pe-riod) amplitude of the E1 and W1 propagating waves gen-erated by the 11-day modulation is∼1 K, while that for the 24-d modulation –∼0.8 K. The investigation of the Arctic winter of 2004–2005 revealed also that the eastward propa-gating planetary waves dominate the thermodynamic regime in the NH stratosphere particularly in the first half of the win-ter, which is quite unusual situation.
[image:4.604.58.295.71.200.2]P. Mukhtarov et al.: Assessing the amplitude modulation of stationary planetary waves 621 used for investigating the amplitude modulation of the SPW
the following output will be obtained:
A0cos(sλ−ϕ0)+Awcos(t+sλ−ϕw)+Ae(t−sλ−ϕe)(3)
WhereA0 andφ0 are the amplitude and phase of the sum (stationary and amplitude modulated components) SPW with zonal wavenumbers; Aw,φw,Ae andφe are the amplitude
and phase of the westward and eastward zonally propagating waves with frequencyand zonal wavenumbers. We re-mind that the found by the decomposition (3) zonally travel-ling waves with frequencyare composed by genuine zon-ally travelling waves and the waves generated by the ampli-tude modulated part of the SPW. Then, the stationary part of the SPW as well as the genuine zonally propagating waves with frequencycan be obtained by geometrically subtrac-tion of Eq. (2) from Eq. (3).
In this short-communication we demonstrated only how to calculate the average contribution of the amplitude mod-ulated SPWs to the field of the zonally travelling planetary waves for the entire considered winter period. This approach however could be applied to the running time windows used for extracting the planetary waves. In this way the time evolving contribution of the amplitude modulated SPWs to the field of the zonally travelling planetary waves could be estimated as well.
In conclusion, we note that the presented method for assessing the amplitude modulation of the SPWs could be used also in studying the planetary waves seen in the SABER/TIMED temperatures. Pancheva et al. (2009a) re-ported a detailed comparison between the altitude and lati-tude structures of the SABER and UKMO planetary waves in the temperature field of the NH (0–50◦N) stratosphere (30– 60 km). The SABER results were obtained by using a least squares fitting method where all planetary waves (station-ary, zonally symmetric and zonally travelling) and migrating and nonmigrating tides are simultaneously extracted from the data. The comparison indicated not only high degree of qual-itatively resemblance, but quantqual-itatively as well. Therefore, the UKMO temperature data can be used for assessing the amplitude modulation of the SPWs in the stratosphere and the results could be applied to the SABER planetary waves. Something else, in Pancheva et al. (2009b) it was noted that the altitude structure of the SABER temperature planetary waves in the stratosphere and mesosphere, and particularly that of the SPWs, is characterized by a double peak struc-ture. This feature of the temperature planetary waves is now well known and described by Sassi et al. (2002). Therefore, it is enough to study in detail only the amplitude modulation of the SPWs in the stratosphere because it should be the same, or very similar of that in the mesosphere.
Acknowledgements. We are grateful to the UKMO and the BADC for the access to the data on http://badc.nerc.ac.uk/browse/badc/ ukmo-assim. We thank the anonymous reviewer for his/her insight-ful comments on the original manuscript.
Topical Editor C. Jacobi thanks A. Pogoreltsev for his help in evaluating this paper.
References
Andrews, D. G., Holton, J. R., and Leovy, C. B.: Middle Atmo-sphere Dynamics, p. 489, Academic Press, San Diego, 1987. Azeem, S. M., Talaat, E. R., Sivijee, G. G., Liu, H.-L., and
Roble, R. G.: Observational study of the 4-day wave in the mesosphere preceding the sudden stratospheric warming events during 1995 and 2002, Geophys. Res. Lett., 32, L15804, doi:10.1029/2005GL023393, 2005.
Charney, J. G. and Drazin, P. G.: Propagation of planetary-scale dis-turbances from the lower into the upper atmosphere, J. Geophys. Res., 66, 83–109, 1961.
Forbes, J. M., Zhang, X., Ward, W., and Talaat, E. R.: Clima-tological features of mesosphere and lower thermosphere sta-tionary planetary waves within±40◦latitude, J. Geophys. Res., 107(D17), 4322, doi:10.1029/2001JD0011232, 2002.
Kr¨uger, K., Naujokat, B., and Labitzke, K.: The unusual midwinter warming in the Southern Hemisphere 2002: A comparison to Northern Hemisphere phenomena, J. Atmos. Sci., 62, 603–613, 2005.
Lomb, N. R.: Least-squares frequency analysis of unequally spaced data, Astrophys. Space Sci., 39, 447–462, 1975.
Merzlyakov, E. G. and Pancheva, D. V.: The 1.5–5-day eastward waves in the upper stratosphere-mesosphere as observed by the Esrange meteor radar and the SABER instrument, J. Atmos. Sol.-Terr. Phys., 69, 2102–2117, 2007.
Palo, S. E., Forbes, J. M., Zhang, X., Russell, J. M., Mertens, C. J., Mlynczak, M. G., Burns, G. B., Espy, P. J., and Kawahara, T. D.: Planetary wave coupling from the strato-sphere to the thermostrato-sphere during the 2002 Southern Hemi-sphere pre-stratwarm period, Geophys. Res. Lett., 32, L23809, doi:10.1029/2005GL0242298, 2005.
Pancheva, D. V., Mukhtarov, P. J., and Andonov, B. A.: Zon-ally symmetric oscillations in the Northern hemisphere strato-sphere during the winter of 2003/2004, Geophys. Res. Lett., 34, L04807, doi:10.1029/2006GL028666, 2007.
Pancheva, D., Mukhtarov, P., Mitchell, N. J., Andonov, B., Mer-zlyakov, E., Singer, W., Murayama, Y., Kawamura, S., Xiong, J., Wan, W., Hocking, W., Fritts, D., Riggin, D., Meek, C., and Man-son, A.: Latitudinal wave coupling of the stratosphere and meso-sphere during the major stratospheric warming in 2003/2004, Ann. Geophys., 26, 467–483, 2008a,
http://www.ann-geophys.net/26/467/2008/.
Pancheva, D., Mukhtarov, P., Mitchell, N. J., Merzlyakov, E., Smith, A. K., Andonov, B., Singer, W., Hocking, W., Meek, C., Manson A., and Murayama, Y.: Planetary waves in cou-pling the stratosphere and mesosphere during the major strato-spheric warming in 2003/2004, J. Geophys. Res., 113, D12105, doi:10.1029/2007JD009011, 2008b.
622 P. Mukhtarov et al.: Assessing the amplitude modulation of stationary planetary waves
coupling the stratosphere-mesosphere-lower thermosphere dur-ing the winter of 2003/2004: Part 2, Altitude and latitude plane-tary wave structure, J. Atmos. Sol.-Terr. Phys., 71, 75–87, 2009b. Randel, W. J.: Global atmospheric circulation statistics, 1000– 1 mb, NCAR/TN-366+STR, National Center for Atmospheric Research, Boulder, Colorado, USA, 1992.
Sassi, F., Garcia, R. R., Boville, B. A., and Liu, H.: On tempera-ture inversions and the mesospheric surf zone, J. Geophys. Res., 107(D19), 4380, doi:10.1029/2001JD001525, 2002.
Scargle, J. D.: Studies in astronomical time series analysis. II. Sta-tistical aspects of spectral analysis of unevenly spaced data, As-trophys. J., 263, 835–853, 1982.
Swinbank, R. and Ortland, D. A.: Compilation of the wind data for the Upper Atmosphere Research Satellite (UARS) Refer-ence Atmosphere Project, J. Geophys. Res., 108(D19), 4615, doi:10.1029/2002JD003135, 2003.
Talaat, E. R., Yee, J.-H., and Zhu, X.: The 6.5-day wave in the trop-ical stratosphere and mesosphere, J. Geophys. Res., 107(D12), 4133, doi:10.1029/2001JD000822, 2002.
Wang, D. Y., Ward, W. E., Shepherd, G. G., and Wu, D. L.: Sta-tionary planetary waves inferred from WINDII wind data taken within altitudes 90–120 km during 1991–1996, J. Atmos. Sci., 57, 1906–1918, 2000.