O R I G I N A L R E S E A R C H
Open Access
Impact of a Bayesian penalized likelihood
reconstruction algorithm on image quality
in novel digital PET/CT: clinical implications
for the assessment of lung tumors
Michael Messerli
1*, Paul Stolzmann
1, Michèle Egger-Sigg
2, Josephine Trinckauf
1, Stefano D
’
Aguanno
3,
Irene A. Burger
1, Gustav K. von Schulthess
1, Philipp A. Kaufmann
1and Martin W. Huellner
1* Correspondence: [email protected] 1Department of Nuclear Medicine,
University Hospital Zurich/University of Zurich, Ramistrasse 100, 8091 Zurich, Switzerland
Full list of author information is available at the end of the article
Abstract
Background:The aim of this study was to evaluate and compare PET image
reconstruction algorithms on novel digital silicon photomultiplier PET/CT in patients with newly diagnosed and histopathologically confirmed lung cancer. A total of 45 patients undergoing 18F-FDG PET/CT for initial lung cancer staging were included. PET images were reconstructed using ordered subset expectation maximization (OSEM) with time-of-flight and point spread function modelling as well as Bayesian penalized likelihood reconstruction algorithm (BSREM) with differentβ-values yielding a total of 7 datasets per patient. Subjective and objective image assessment with all image datasets was carried out, including subgroup analyses for patients with high dose (> 2.0 MBq/kg) and low dose (≤2.0 MBq/kg) of 18F-FDG injection regimen.
Results:Subjective image quality ratings were significantly different among all
different reconstruction algorithms as well as among BSREM using different β -values only (both p < 0.001). BSREM with a β-value of 600 was assigned the highest score for general image quality, image sharpness, and lesion conspicuity. BSREM reconstructions resulted in higher SUVmax of lung tumors compared to OSEM of up to + 28.0% (p< 0.001). BSREM reconstruction resulted in higher signal-/ and contrast-to-background ratios of lung tumor and higher signal-/ and contrast-to-noise ratio compared to OSEM up to a β-value of 800. Lower β -values (BSREM450) resulted in the best image quality for high dose 18F-FDG injections, whereas higher β-values (BSREM600) lead to the best image quality in low dose 18F-FDG PET/CT (p < 0.05).
Conclusions: BSREM reconstruction algorithm used in digital detector PET leads
to significant increases of lung tumor SUVmax, signal-to-background ratio, and signal-to-noise ratio, which translates into a higher image quality, tumor conspicuity, and image sharpness.
Keywords: Positron-emission tomography, Lung cancer, Image reconstruction,
PET/CT, Image quality enhancement
Background
Lung cancer is today the most common cause for cancer mortality, with an estimated 234,030 new cases occurring in the USA alone in 2018 [1]. Positron-emission tomog-raphy (PET) allows for imaging and quantitation of radiotracer uptake in vivo and may thereby visualize physiologic and pathophysiologic processes in patients [2]. For stance, 18F-fluorodeoxyglucose (18F-FDG) PET may be used to detect and quantify in-creased glucose metabolism in neoplastic lesions, such as primary tumors, lymph node metastases, or distant metastases [3]. Computed tomography (CT) enables a detailed assessment of local lung tumor extent, owing to its comparably higher spatial reso-lution [4, 5]. Therefore, hybrid imaging with 18F-FDG PET/CT has evolved as an im-portant tool for comprehensive staging of lung cancer patients and is reimbursed by health insurances in many countries worldwide [6].
However, there are two main limitations of PET: first, the relatively low spatial reso-lution which may affect images both visually and quantitatively [7] and second, the gener-ally relatively low signal-to-noise ratio [8]. There have been several technical advances within the last decade, including new hardware features, such as time-of-flight (TOF) ac-quisition [9] and silicon-based photodetectors (SIPM) as well as advanced image recon-struction methods, leading to an overall improvement of PET images. Iterative reconstruction methods have been widely adopted, replacing the initially used filtered back projection technique due to decreased artifacts and image noise [10]. Additionally, new reconstruction techniques, such as ordered subset expectation maximization (OSEM) and block sequential regularized expectation maximization (BSREM), came into clinical use and lead to a further improvement of image quality [11].
Solid-state digital PET detectors use a novel combination of lutetium-based scintillator crystal arrays with a silicon photomultiplier, which improves intrinsic sensitivity and tem-poral resolution [12]. These novel detector elements were made available clinically with the introduction of integrated digital PET/MR in 2013 [13]. Several technical and clinical studies showed a superior performance of digital compared to analog detector systems [14]. While PET/MR today is mainly limited to academic environments, silicon-based digital detector technology became available to PET/CT in the beginning of 2017, paving the way for a dissemination of this technique into the clinical field worldwide. A first study carried out in a mixed population of cancer patients showed an improved perform-ance of digital PET/CT with regard to pathologic and physiologic structures [12].
The purpose of our study was to evaluate different reconstruction algorithms on the latest-generation digital PET/CT scanner and to identify the optimal reconstruction method for the quantitation of histopathologically confirmed lung cancer.
Methods
Patients
18F-FDG PET/CT imaging protocol
All patients underwent a PET/CT on a certified novel digital detector scanner (GE Discovery Molecular Insights - DMI PET/CT, GE Healthcare, Waukesha, WI). A body mass index (BMI)-adapted 18F-FDG dosage regimen was used, based on recommenda-tions made by a previous study utilizing the same digital PET detector system [14]: A dose of 1.5 MBq/kg body weight was injected for patients with a BMI of < 20 kg/m2, 2 MBq/kg body weight for patients with a BMI of 20–24.5 kg/m2, and 3.1 MBq/kg body weight for patients with a BMI > 24.5 kg/m2, however, without exceeding a max-imum injected 18F-FDG dose of 320 MBq. Participants fasted for at least 4 h prior to the scan, and blood glucose levels were below 160 mg/dl at the time of 18F-FDG injec-tion. A CT scan was obtained from the vertex of the skull to the mid-thighs and used for attenuation correction purposes as well as for anatomic localization of 18F-FDG up-take. The CT scan was acquired using automated dose modulation (range 15–100 mA, 120 kV). Immediately after the CT, a PET scan was acquired covering the identical ana-tomical region. The FDG uptake time was set to 60 min. The PET acquisition time was 2.5 min per bed position, with 6–8 bed positions per patient (depending on patient size), with an overlap of 23% (17 slices). The PET was acquired in 3D mode and the slice thickness was 2.79 mm.
PET reconstructions
After the PET acquisition, raw data were reconstructed with seven different reconstruc-tion settings per patient; two reconstrucreconstruc-tions were using OSEM with two iterareconstruc-tions, 24 subsets, and 6.4-mm Gaussian filter (1) with TOF (OSEMTOF; VUE Point FX, GE
Health-care) and (2) with TOF and point spread function modelling (OSEMPSF; Vue Point FX
with SharpIR, GE Healthcare). Five reconstructions used BSREM (Q.Clear, GE Health-care) with incrementalβ-values of (3) 350, (4) 450, (5) 600, (6) 800, and (7) 1200, respect-ively. All datasets were reconstructed with a 256 × 256 pixel matrix. The rationale for choosing the abovementioned reconstructions was twofold: first, to explore the broad range of reconstruction capabilities of the system and second, to cover different clinical scenarios: While OSEMPSF represents the latest reconstruction technique used on many
analog PET/CT systems, OSEMTOFis used in clinical multicenter studies for the purpose
of inter-scanner harmonization. BSREM on the other hand represents a full convergence algorithm, which has the potential to become a clinical standard in the future, at least for digital scanners [15,16]. BSREM incorporates a penalty function which specifically sup-presses noise fraught image solutions during the iteration process. As these are eliminated as options for the subsequent iterations, the number of iterations can be increased with-out detriment of increasing noise [17]. This penalization factor (i.e.,β-value) represents the only user-input variable. The relative difference penalties for BSREM used in our study were chosen based upon preliminary testing.
Subjective imaging analysis
Workstation, Version 4.6; GE Healthcare) and in random order. Readers were blinded to any clinical information, except the presence of a primary lung tumor. In case of dis-crepancy of image rating, a final decision was made by consensus including a third reader.
The readers first rated the general image quality; for this purpose, datasets were viewed using maximum intensity projection (MIP) of PET and axial views with re-formatted sections. The two readers evaluated the general image quality of each recon-structed image dataset using a 5-point Likert scale: 1, poor; 2, reasonable; 3, good; 4, very good; and 5, excellent quality. After that, the readers evaluated the images with re-gard to image sharpness and lesion conspicuity using another 5-point Likert scale, as suggested previously [18,19]. For image sharpness, the readers rated as follows: 1, inad-equate image with severe blurring; 2, diagnostically relevant image blurring; 3, diagnos-tically irrelevant image blurring; and 4, good images with minimal blurring; and 5, clear, excellent images. For lesion conspicuity, the readers rated as follows: 1, very poor conspicuity of lesion circumference; 2, poor conspicuity, < 25% of the lesion circumfer-ence clearly definable; 3, fair conspicuity, 25–50% of the lesion circumference definable; 4, good conspicuity, 50–75% of the lesion circumference definable; and 5, excellent conspicuity, > 75% of the lesion circumference definable, as previously described [14]. Finally, the readers were asked to choose the preferred reconstruction on a per-patient level, therefore reviewing all seven MIP PET images of a given patient side-by-side.
Quantitative imaging analysis
Quantitative analyses were performed by a third reader (M.M.) in a separate reading session. The maximum standardized uptake value (SUVmax) of each primary lung
tumor was recorded using a standard volume of interest (VOI) tool. Herewith, the VOI was automatically propagated to cover exactly the same volume in all seven different reconstruction datasets. Moreover, background SUVs were assessed in the right lobe of the liver (parenchymal organ background) and within the descending aorta (bloodpool background) at the level of the carina, with 4.0-cm- and 1.0-cm-diameter spherical VOIs, respectively. Only liver parenchyma with normal appearance on both PET and CT was used as a reference. The mean standardized uptake value (SUVmean) and the
standard deviation of the standardized uptake value (SUVSD) within the VOIs were
re-corded in both backgrounds for all reconstructions. Based on these measurements, a signal-to-background ratio (SBR) was calculated for each lung tumor, defined as the lung lesions’SUVmaxdivided by the SUVmeanin the descending aorta. The liver SUVSD
was used as a measure of noise. Tumor signal-to-noise ratio (SNR) was defined as the lesions’ SUVmax divided by the liver SUVSD. Further, a contrast-to-background ratio
(CBR) was calculated, defined as the (lung lesions’ SUVmean−the SUVmean in the
de-scending aorta) divided by the SUVmean in the descending aorta. And finally,
contrast-to-noise ratio (CNR) was measured, defined as the (lung lesions’ SUVmean−
the SUVmeanin the descending aorta) divided by the liver SUVSD.
Statistical analyses
of values. Qualitative image ratings (i.e., general image quality, image sharpness, and le-sion conspicuity) were analyzed with the Friedman test separately, comprising all re-construction algorithms and BSREM only. Further, qualitative image ratings (i.e., general image quality, image sharpness, lesion conspicuity, and preferred reconstruc-tion per patient) were compared between patients with a low (i.e., ≤2.0 MBq/kg body weight; n= 25) and a high (i.e., > 2.0 MBq/kg body weight; n= 20) 18F-FDG dosage exam using Mann-Whitney U test. Since all quantitative SUVmax values were
distrib-uted normally, statistical differences were assessed using repeated measures analysis of variances (ANOVA) with post hoc Bonferroni corrections to adjust for multiple com-parisons. Analyses were carried out using SPSS release 23.0 (IBM Corporation, Armonk, NY, USA) and MedCalc version 15.8 (MedCalc Software, Ostend, Belgium). A two-tailedpvalue of < 0.05 was considered to indicate statistical significance.
Results
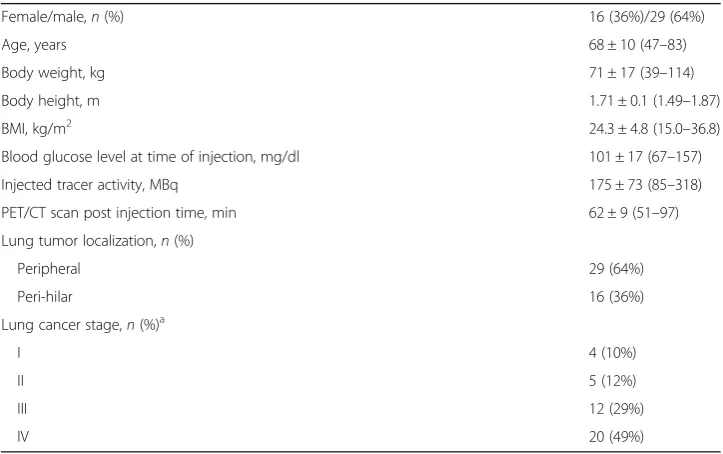
A total of 45 patients (16 female, 29 male, mean age 68 ± 10 years) referred for the ini-tial staging of lung cancer with 18F-FDG PET/CT participated in our study. Patients had non-small cell lung cancer (NSCLC; n= 41), small cell lung cancer (SCLC; n= 3), and mixed NSCLC/SCLC (n= 1). Further demographic information including lung can-cer stages according to the 8th Edition Lung Cancan-cer Stage Classification [20] is given in Table1.
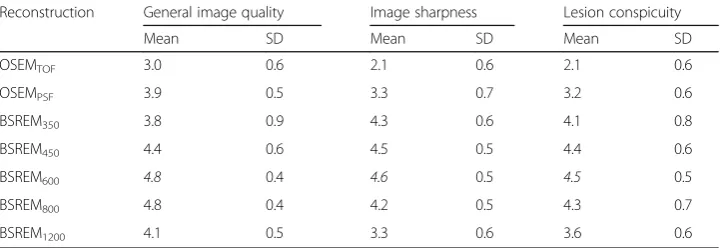
Subjective image quality
The results of the subjective image assessment including all study subjects are given in Table 2. General image quality was rated significantly different among all different re-construction algorithms as well as among BSREM using different β-values only
Table 1Demographic data of study subjects (n= 45)
Female/male,n(%) 16 (36%)/29 (64%)
Age, years 68 ± 10 (47–83)
Body weight, kg 71 ± 17 (39–114)
Body height, m 1.71 ± 0.1 (1.49–1.87)
BMI, kg/m2 24.3 ± 4.8 (15.0–36.8)
Blood glucose level at time of injection, mg/dl 101 ± 17 (67–157)
Injected tracer activity, MBq 175 ± 73 (85–318)
PET/CT scan post injection time, min 62 ± 9 (51–97)
Lung tumor localization,n(%)
Peripheral 29 (64%)
Peri-hilar 16 (36%)
Lung cancer stage,n(%)a
I 4 (10%)
II 5 (12%)
III 12 (29%)
IV 20 (49%)
Values are given as absolute numbers and percentages in parenthesis or mean ± standard deviation (range) BMIbody mass index,MBqmega-Becquerel,PETpositron-emission tomography
a
(both p< 0.001). Similar differences were observed for image sharpness and lesion conspicuity (all p< 0.001). BSREM600 was assigned the highest score for general
image quality, image sharpness, and lesion conspicuity. Accordingly, BSREM600 was
chosen most frequently as the preferred reconstruction algorithm by the readers, i.e., in 18/45 (40%) cases, followed by BSREM450in 14/45 (31%), BSREM800in 9/45 (20%),
and BSREM350in 4/45 (9%) cases (Fig.1).
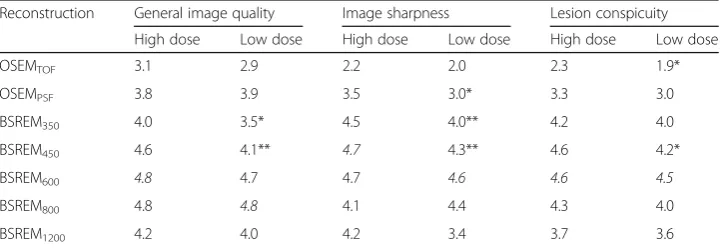
Effect of administered 18F-FDG dose on image quality
Table 3 demonstrates image quality ratings according to the administered dose of 18F-FDG. Significant differences between patients with high-dose regimen (i.e., > 2.0 MBq/kg body weight;n= 20) and low-dose regimen (i.e.,≤2.0 MBq/kg body weight;
n= 25) are indicated (see Table3). A statistically significant shift of the preferred recon-struction algorithm towards higher β-values was observed in patients with low-dose regimen compared to patients with high-dose regimen (p< 0.05, Fig. 1). In patients with high-dose regimen, BSREM450was chosen most frequently as the preferred
recon-struction algorithm by the readers, i.e., in 10/20 (50%) cases, followed by BSREM600in
6/20 (30%), BSREM350in 3/20 (15%), and BSREM800in 1/20 (5%) cases. On the other
hand, in patients with low-dose regimen, BSREM600was chosen most frequently as the
preferred reconstruction algorithm by the readers, i.e., in 12/25 (48%) cases, followed by BSREM800 in 8/25 (32%), BSREM450 in 4/25 (16%), and BSREM350 in 1/25 (4%)
cases.
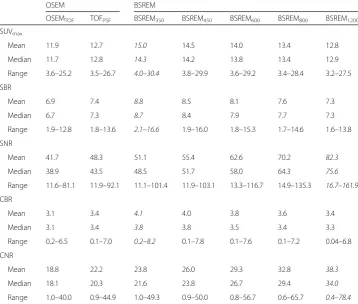
Quantitative image assessment
The results of the quantitative analysis including SUVmax, SBR, SNR, CBR, and CNR in
the differently reconstructed datasets are given in Table4. SUVmaxand SBR were
high-est in BSREM350 and decreased with incrementalβ-values, whereas there was a
con-tinuous increase of SNR with increasing β-values. In Table 5, the median relative differences of SUVmax comparing all reconstruction algorithms are given, including p
values for pairwise comparison.
Representative images of study subjects undergoing 18F-FDG PET/CT for staging of lung cancer are given in Figs.2and3.
Table 2Results of subjective PET image quality ratings for different reconstruction algorithms. Italicized numbers are the reconstructed datasets yielding the highest score for each assessed parameter
Reconstruction General image quality Image sharpness Lesion conspicuity
Mean SD Mean SD Mean SD
OSEMTOF 3.0 0.6 2.1 0.6 2.1 0.6
OSEMPSF 3.9 0.5 3.3 0.7 3.2 0.6
BSREM350 3.8 0.9 4.3 0.6 4.1 0.8
BSREM450 4.4 0.6 4.5 0.5 4.4 0.6
BSREM600 4.8 0.4 4.6 0.5 4.5 0.5
BSREM800 4.8 0.4 4.2 0.5 4.3 0.7
BSREM1200 4.1 0.5 3.3 0.6 3.6 0.6
BSREMblock sequential regularized expectation maximization,OSEMordered subset expectation maximization,PSFpoint
Discussion
This study sought to evaluate the impact of different PET reconstruction algorithms on image quality and quantitative parameters in patients with histopathologically con-firmed lung cancer using a latest-generation silicon-based digital detector PET/CT scanner. The major findings of our study are as follows: (1) BSREM reconstruction al-gorithms lead to an increased image quality, image sharpness, and tumor lesion conspi-cuity compared to OSEM; (2) adjusting β-values to the injected 18F-FDG activity allows for an individual dose-based optimization of image quality of PET images; and (3) BSREM reconstruction leads to a significant increase of SUVmax, which is most
prominent with lowerβ-values (e.g., 350).
PET/CT using 18F-FDG as radiotracer has evolved to be the most important cross-sectional imaging modality for whole-body staging of patients with lung cancer in recent years and is recommended by various international guidelines [6, 21]. There is, however, an inherent relatively low spatial resolution [7] as well as a generally low signal-to-noise ratio of PET [8]. This is why improving the image quality of PET is an
Fig. 1Absolute frequency distribution of preferred reconstruction algorithms for lung cancer assessment as rated by the readers, including the ratings for all study subjects (a): BSREM600was chosen most frequently as the preferred reconstruction algorithm by the readers, followed by BSREM450, BSREM800, and BSREM350. When comparing the relative frequency distribution of preferred reconstruction algorithms (b) for high-18F-FDG-dosage regimen (> 2.0 MBq/kg body weight;n= 20 patients) and low-dosage regimen (≤2.0 MBq/kg body weight;n= 25 patients), a significant shift of the preferred image reconstruction algorithm from BSREM450to BSREM600was observed (p< 0.05)
Table 3Results of subjective PET image quality ratings for different reconstruction algorithms in a
subanalysis for patients with high-dose (≥2.0 MBq/kg (n= 20 patients of study group)) and
low-dose (≤2.0 MBq/kg (n= 25 patients of study group)) injection regimen of 18F-FDG. Italicized
numbers are the reconstructed datasets yielding the highest score for each assessed parameter
Reconstruction General image quality Image sharpness Lesion conspicuity
High dose Low dose High dose Low dose High dose Low dose
OSEMTOF 3.1 2.9 2.2 2.0 2.3 1.9*
OSEMPSF 3.8 3.9 3.5 3.0* 3.3 3.0
BSREM350 4.0 3.5* 4.5 4.0** 4.2 4.0
BSREM450 4.6 4.1** 4.7 4.3** 4.6 4.2*
BSREM600 4.8 4.7 4.7 4.6 4.6 4.5
BSREM800 4.8 4.8 4.1 4.4 4.3 4.0
BSREM1200 4.2 4.0 4.2 3.4 3.7 3.6
Data are presented as mean
BSREMblock sequential regularized expectation maximization,OSEMordered subset expectation maximization,PSFpoint
ongoing subject of research and, besides new hardware features such as TOF acquisi-tion [9], advanced PET data reconstruction methods are being developed. For example, iterative reconstruction methods such as OSEM have been widely adopted instead of the initially used filtered back projection, leading to an overall image improvement [10, 22]. Based on raw data sinograms, OSEM repeatedly iterates different possibilities in order to find the most probable image. Thereby, with each iteration step, an image with a greater likelihood of describing the measured data is achieved. The main disadvantage of OSEM, however, is the impossibility to run iterations to full convergence, because the image noise increases with each iteration, leading to rather unacceptable image quality before full convergence is reached [23,24]. Therefore, OSEM is stopped after a predefined number of iterations, resulting in under-converged images. As a main con-sequence, this leads to an underestimation of the true SUV.
BSREM on the other hand, as a fast and globally convergent reconstruction algo-rithm, may increase the accuracy of lesion quantitation compared to OSEM, with a par-ticular improvement in cold background regions such as the lungs as indicated in previous studies using NEMA and anthropomorphic phantom data [16]. Moreover, in a clinical setting, Teoh et al. showed that BSREM may significantly increase the SUVmax
and increase signal-to-background/noise of lung lesions [25]. These observations are in
Table 4Results of quantitative PET image assessment for different reconstruction algorithms
including maximum standardized uptake value (SUVmax) of the primary lung tumor, tumor
signal-to-background ratio (SBR), tumor signal-to-noise ratio (SNR), contrast-signal-to-background ratio (CBR), and contrast-to-noise ratio (CNR). Italicized numbers are the reconstructed datasets yielding the highest values for given parameters
OSEM BSREM
OSEMTOF TOFPSF BSREM350 BSREM450 BSREM600 BSREM800 BSREM1200
SUVmax
Mean 11.9 12.7 15.0 14.5 14.0 13.4 12.8
Median 11.7 12.8 14.3 14.2 13.8 13.4 12.9
Range 3.6–25.2 3.5–26.7 4.0–30.4 3.8–29.9 3.6–29.2 3.4–28.4 3.2–27.5
SBR
Mean 6.9 7.4 8.8 8.5 8.1 7.6 7.3
Median 6.7 7.3 8.7 8.4 7.9 7.7 7.3
Range 1.9–12.8 1.8–13.6 2.1–16.6 1.9–16.0 1.8–15.3 1.7–14.6 1.6–13.8
SNR
Mean 41.7 48.3 51.1 55.4 62.6 70.2 82.3
Median 38.9 43.5 48.5 51.7 58.0 64.3 75.6
Range 11.6–81.1 11.9–92.1 11.1–101.4 11.9–103.1 13.3–116.7 14.9–135.3 16.7–161.9
CBR
Mean 3.1 3.4 4.1 4.0 3.8 3.6 3.4
Median 3.1 3.4 3.8 3.8 3.5 3.4 3.3
Range 0.2–6.5 0.1–7.0 0.2–8.2 0.1–7.8 0.1–7.6 0.1–7.2 0.04–6.8
CNR
Mean 18.8 22.2 23.8 26.0 29.3 32.8 38.3
Median 18.1 20.3 21.6 23.8 26.7 29.4 34.0
Range 1.0–40.0 0.9–44.9 1.0–49.3 0.9–50.0 0.8–56.7 0.6–65.7 0.4–78.4
BSREMblock sequential regularized expectation maximization,OSEMordered subset expectation maximization,PSFpoint
Fig. 3Representative images of a 53-year-old man with a body mass index of 19.1 kg/m2and 66 kg body weight who underwent 18F-FDG PET/CT for staging of lung cancer. The patient was injected with 99.8 MBq of 18F-FDG (i.e., 1.5 MBq/kg body weight). Coronal and axial co-registered PET/CT images (a,b) show a highly 18F-FDG-avid tumor invading the right main bronchus, which was confirmed as squamous cell carcinoma (arrow) after right-sided pneumonectomy (c). Coronal PET images show OSEMTOF(d), OSEMPSF (e), and BSREM600(f) reconstruction together with SUVmaxof the primary tumor
line with the results of our study, e.g., a median increase of lung tumor SUVmax by
9.3% or 17.7% with BSREM600or BSREM350, respectively, compared with OSEMPSF, or
by 18.5% or 28.0% with BSREM600 or BSREM350, respectively, compared with
OSEMTOF.
It is understood that increased quantitative accuracy in PET does not necessarily translate into an improvement of clinical readings. We therefore included in our study performance assessments of readers to complement the quantitative approach and en-able a meaningful clinical implication. We could show that several aspects of reading lung cancer PET exams are enhanced with BSREM, such as lesion conspicuity and image sharpness. Indeed, in all 45 patients, a BSREM reconstruction was selected as preferred reconstruction for image assessment by the readers. An “intermediate”
β-value (i.e., 450–600) seems to be ideal for lung cancer assessment and was selected in most cases. This is paralleled by the observation that by applying incrementally higher
β-values, a steady increase of signal-to-noise ratio comes at the expense of reduced tumor signal-to-background ratio as a quantitative term but also at the expense of image sharpness as qualitative/subjective term.
As expected based on the objectives of BSREM, we observed a significant shift of the selected “preferred image reconstruction” towards higher β-values (i.e., from 450 to 600) in patients who received lower 18F-FDG doses (< 2 MBq/kg) compared with pa-tients who received higher doses (> 2 MBq/kg). This observation reflects the apparent ability of BSREM to balance image quality and noise levels according to the injected dose and/or patient BMI by choosing differentβ-values, with higherβ-values appearing more appropriate for patients with lower 18F-FDG doses. Hence, the appropriate selec-tion of this relative difference penalty may become a valuable tool for adjusting PET image quality on a per-patient base, allowing both for a more patient-tailored PET im-aging and for maintaining adequate image quality while reducing the dose. Notably, it is yet not known at which threshold particularly small lesions are lost with increasing
β-values using BSREM reconstruction [25].
While limiting the 18F-FDG dose may not seem to be overly important in patients with lung cancer, dose reduction in PET in general is a worthwhile goal to achieve. This is particularly true in patients with diseases requiring repeat examinations such as lymphoma and especially for young patients who have a comparably high life expect-ancy. In this patient group, the imaging modality with the lowest achievable absorbed radiation dose per imaging study is desired. Future studies on, e.g., lymphoma patients may further refine protocols to let BMI-based dose adaption become reality also for this patient group, who are at particular stochastic risk for potential adverse radiation effects.
We acknowledge that our study has some limitations. First, a clinical reader assess-ment as the one we performed might carry an inherent bias since it is virtually impos-sible to totally blind readers to the image “appearance” of different reconstruction algorithms. Second, analyses of tumor SUV were restricted to measurement of SUVmax,
protocols used on analog detector scanners in conjunction with BSREM. Sixth, the number of patients in this single-center study is comparably small, and therefore, con-clusions drawn from the present analysis await further proof in larger (and ideally multi-centric) observations. Future studies are also warranted to assess the impact of BSREM on diagnosis, clinical management, and patient outcome.
Conclusions
In conclusion, BSREM reconstruction algorithm used in digital detector PET leads to significant increases of lung tumor SUVmax, signal-to-background ratio, and
signal-to-noise ratio, which translates into a higher image quality, tumor conspicuity, and image sharpness.
Abbreviations
18F-FDG:18F-Fluorodeoxyglucose; BMI: Body mass index; BSREM: Block sequential regularized expectation maximization; CT: Computed tomography; MIP: Maximum intensity projection; NSCLC: Non-small cell lung cancer; OSEM: Ordered subset expectation maximization; PET: Positron-emission tomography; SCLC: Small cell lung cancer; SUVmax: Maximum standardized uptake value; SUVmean: Mean standardized uptake value; SUVSD: Standard deviation of standardized uptake value; TOF: Time of flight; VOI: Volume of interest
Acknowledgements
We thank Freya Klein, Corina Weyermann, Kevin Frei, and Lasien Vojo for their excellent technical support. Further, we thank Fotis Kotasidis PhD for his invaluable comments and suggestions regarding this work.
Funding
The study group received support by an institutional grant from GE Healthcare (unrelated to current study).
Authors’contributions
MM, MWH designed the study and prepared the manuscript. MM, PS, MES, and JT collected the data. MM, PS and MWH did the statistical analysis. SDA, IAB, GKvS and PAK gave technical support and conceptual advice. All authors read and approved the final manuscript.
Ethics approval and consent to participate
All procedures performed in studies involving human participants were in accordance with the ethical standards of the institutional and/or national research committee and with the 1964 Helsinki declaration and its later amendments or comparable ethical standards. Informed consent was obtained from all individual participants included in the study.
Competing interests
(1) Michael Messerli received a research grant from the Iten-Kohaut Foundation, Switzerland. Stefano D’Aguanno is an employee of GE Healthcare. Gustav von Schulthess is a Consultant to GE Healthcare and a Co-Director of IDKD, an edu-cational organization which receives funds from multiple companies. Martin Huellner received speaker’s fees from GE Healthcare. Apart from that, the other authors of this manuscript declare no relationships with any companies, whose products or services may be related to the subject matter of the article.
(2) The University Hospital Zurich holds a research agreement with GE Healthcare. Only non-GE employees had control of inclusion of data and information that might present a conflict of interest for those authors who are employees of GE Healthcare. No further specific grants from funding agencies in the public, commercial, or not-for-profit sectors were received for this study.
Publisher’s Note
Springer Nature remains neutral with regard to jurisdictional claims in published maps and institutional affiliations.
Author details
1Department of Nuclear Medicine, University Hospital Zurich/University of Zurich, Ramistrasse 100, 8091 Zurich,
Switzerland.2Department of Pathology and Molecular Pathology, University Hospital Zurich/University of Zurich, Zurich, Switzerland.3GE Medical Systems (Schweiz) AG, Glattbrugg, Switzerland.
Received: 9 April 2018 Accepted: 29 July 2018
References
1. Siegel RL, Miller KD, Jemal A. Cancer statistics, 2018. CA Cancer J Clin. 2018;https://doi.org/10.3322/caac.21442. 2. Hess S, Blomberg BA, Zhu HJ, Hoilund-Carlsen PF, Alavi A. The pivotal role of FDG-PET/CT in modern medicine.
Acad Radiol. 2014;21:232–49.
4. Goeckenjan G, Sitter H, Thomas M, et al. Prevention, diagnosis, therapy, and follow-up of lung cancer. Pneumologie. 2010;64(Suppl 2):e1–164.
5. Naidich DP. High-resolution computed tomography of the pulmonary parenchyma: past, present, and future? J Thorac Imaging. 2010;25:32–3.
6. Lardinois D, Weder W, Hany TF, et al. Staging of non-small-cell lung cancer with integrated positron-emission tomography and computed tomography. N Engl J Med. 2003;348:2500–7.
7. Takamochi K, Yoshida J, Murakami K, et al. Pitfalls in lymph node staging with positron emission tomography in non-small cell lung cancer patients. Lung Cancer. 2005;47:235–42.
8. Cheng K, Matthews J, Boellaard R. Improving the signal-to-noise ratio in static PET reconstruction using HYPR-OSEM. Nuclear Science Symposium, Medical Imaging Conference. 2017;https://doi.org/10.1109/NSSMIC.2016.
8069454.
9. Lois C, Jakoby BW, Long MJ, et al. An assessment of the impact of incorporating time-of-flight information into clinical PET/CT imaging. J Nucl Med. 2010;51:237–45.
10. Boellaard R, van Lingen A, Lammertsma AA. Experimental and clinical evaluation of iterative reconstruction (OSEM) in dynamic PET: quantitative characteristics and effects on kinetic modeling. J Nucl Med. 2001;42:808–17. 11. Sah BR, Stolzmann P, Delso G, et al. Clinical evaluation of a block sequential regularized expectation maximization
reconstruction algorithm in 18F-FDG PET/CT studies. Nucl Med Commun. 2017;38:57–66.
12. Baratto L, Park SY, Hatami N, et al. 18F-FDG silicon photomultiplier PET/CT: a pilot study comparing semi-quantitative measurements with standard PET/CT. PLoS One. 2017;12:e0178936.
13. Levin CS, Maramraju SH, Khalighi MM, Deller TW, Delso G, Jansen F. Design features and mutual compatibility studies of the time-of-flight PET capable GE SIGNA PET/MR system. IEEE Trans Med Imaging. 2016;35:1907–14. 14. Sekine T, Delso G, Zeimpekis KG, et al. Reduction of 18F-FDG dose in clinical PET/MR imaging by using silicon
photomultiplier detectors. Radiology. 2017;https://doi.org/10.1148/radiol.2017162305:162305. 15. Kajisako M, Kawase S, Mitsumoto K, et al. Performance evaluation of the Bayesian Penalized Likelihood
Reconstruction Algorithm Q.Clear on BGO PET/CT system, according to NEMA NU2-2012 standard. J Nucl Med. 2016;57(Suppl 2):2627.
16. Ahn S, Ross SG, Asma E, et al. Quantitative comparison of OSEM and penalized likelihood image reconstruction using relative difference penalties for clinical PET. Phys Med Biol. 2015;60:5733–51.
17. Ross S (2013) Q.clear (GE healthcare white paper). http://www3gehealthcarecom/~/media/documents/us-global/ products/pet-ct/whitepaper/q%20clear/ge-healthcare-white-paper_qclearpdf. Accessed 16 Dec 2017.
18. Everaert H, Vanhove C, Lahoutte T, et al. Optimal dose of 18F-FDG required for whole-body PET using an LSO PET camera. Eur J Nucl Med Mol Imaging. 2003;30:1615–9.
19. Queiroz MA, Delso G, Wollenweber S, et al. Dose optimization in TOF-PET/MR compared to TOF-PET/CT. PLoS One. 2015;10:e0128842.
20. Detterbeck FC, Boffa DJ, Kim AW, Tanoue LT. The Eighth Edition Lung Cancer Stage Classification. Chest. 2017;151:193–203. 21. Silvestri GA, Gonzalez AV, Jantz MA, et al. Methods for staging non-small cell lung cancer: diagnosis and
management of lung cancer, 3rd ed: American College of Chest Physicians evidence-based clinical practice guidelines. Chest. 2013;143:e211S–50S.
22. Akamatsu G, Ishikawa K, Mitsumoto K, et al. Improvement in PET/CT image quality with a combination of point-spread function and time-of-flight in relation to reconstruction parameters. J Nucl Med. 2012;53:1716–22. 23. Adams MC, Turkington TG, Wilson JM, Wong TZ. A systematic review of the factors affecting accuracy of SUV
measurements. AJR Am J Roentgenol. 2010;195:310–20.
24. Tong S, Alessio AM, Kinahan PE. Image reconstruction for PET/CT scanners: past achievements and future challenges. Imaging Med. 2010;2:529–45.