Ezetimibe belongs to a group of selective and very effective 2-azetidione cholesterol absorption inhibitors that act on the level of cholesterol entry into enterocytes. A new, rapid, specific reversed-phase HPLC method has been developed for assaying ezetimibe in pharmaceutical dosage forms. The assay involved an isocratic elution of ezetimibe in a Betasil C (250 mm x 4.6 mm i.d., 5µ) column using a mobile phase composition of 18 Acetonitrile: 10 mM Na HPO pH 7.0 (55:45 v/v). The flow rate was 1ml/min and the analyte monitored at 233nm. The assay method was found to 2 4 be linear from 4-24µg/mL. All the validation parameters were within the acceptance range. The developed method was successfully applied to estimate the amount of ezetimibe in tablets.
Keywords: Ezetimibe, HPLC, validation.
ABSTRACT
Submitted: 16/03/2012 Revised: 21/09/2012 Accepted: 02/01/2013INTRODUCTION
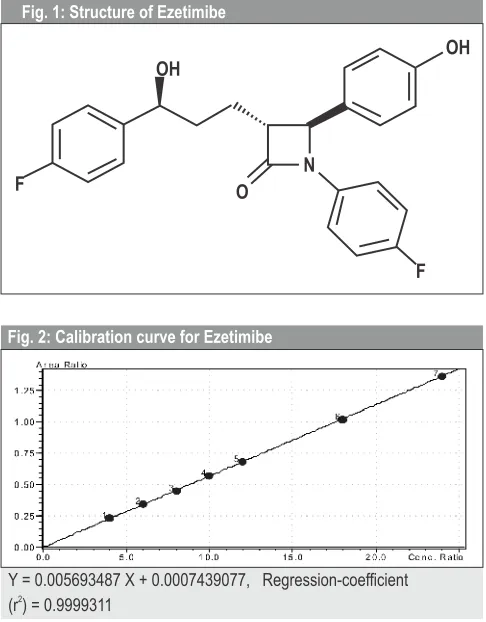
Ezetimibe belongs to a group of selective and very effective 2-azetidione cholesterol (figure 1) absorption inhibitors that act on the level of cholesterol entry into enterocytes. Its chemical name is [(3R, 4S) - 1 - (4-fluorophenyl) - 3 - [(3S) - 3 - (4-fluorophenyl) - 3- hydroxypropyl] - 4 - (4- hydroxyphenyl) - 2 - azetidinone]. It has an empirical formula of C H F NO and a molecular weight of 400.43. Ezetimibe is 24 21 2 rapidly absorbed and primarily metabolized in the small intestine and liver to its glucuronide, both of which undergo
1,2,
enterohepatic recycling in humans . Clinical studies have shown that co-administration of ezetimibe with statins could provide significant reductions in both the low-density lipoproteins (LDL) and the total cholesterol with slight
3,4,5,6,7 increase in the high-density lipoproteins (HDL) . It is available in the market as 10 mg tablets (Zetia, Merck/Schering-Plough Pharmaceuticals, USA; Ezzicad, Glenmark Pharmaceuticals, Mumbai, India; Ezta, Hetero Drugs Pvt. Ltd.,Hyderabad, India). Literature review reveled; some drawbacks in reported methods for estimation of Ezetimibe in formulations and in plasma are discussed below.
For determination of Ezetimibe, separation was achieved by reverse phase C columns with mobile phases consisting of 18
Development and Validation of a new Reversed-phase HPLC Method for the
Determination of Ezetimibe in Pharmaceutical Dosage forms
1,2 1 2 3
Ghanshyam Panjwani* , Ragvendra Shetty , Gautham Shenoy and Dinesh Dhamecha
1 th
Ecron Acunova Manipal Acunova Clinical Research Centre, 4 Floor, Shirdi Sai Baba Cancer Hospital, Manipal - 576104, Karnataka. 2
Department of Pharmaceutical Chemistry Manipal University, Manipal. edu, Madhav Nagar,Manipal - 576104, Karnataka. 3
Genba Sopanrao Moze College of Pharmacy, Wagholi, Pune - 412207.
Indian Journal of Pharmaceutical Education and Research
Association of Pharmaceutical Teachers of India
*Address for Correspondence:
Ghanshyam Panjwani, Analytical Department, Ranbaxy Laboratories Ltd., R and D, Sarhul, Sector-18, Gurgaon - 122015, Haryana
E-mail: [email protected],
1,9,10,11,12,13
acetonitrile-methanol-water/buffer . Snyder L. has reported that presence of methanol in the mobile phase creates considerably more background noise compared to
14 acetonitrile .
The mobile phase of acetonitrile–buffer was selected for the determination of Ezetimibe by C column with MS detection 18
1, 9, 10, 11, 13 1
and radiometric detector and it was found that the detection technique employed was not available commonly.
For estimation of the Ezetimibe, gradient elution with acetonitrile was utilized in LC-UV and LC–MS/MS methods
1, 12, 10, 15, 16
using conventional columns . Snyder L. reported that gradient runs take are longer, because of the need for column equilibration after each run; also baseline problems are more common with gradient elution and solvents required should
14 be of high purity .
For determination of Ezetimibe with acetonitrile and aqueous solutions containing (1-heptane sulfonic acid, triethylamine) were utilized in LC–UV methods using conventional C 18
15, 17, 18
columns . Ion pair reagents are corrosive and hard on column. The presence of ion pair reagent in the mobile phase results in complex method and moreover column regeneration becomes slow and reproducibility of separation can't be achieved. So the addition of ion pair reagent was
1 avoided .
1, 20, 21, 22
of the methods . Snyder L. reported that the high flow rate required by the methods is not suitable for analysis of large numbers of sample and affects the column eventually. Also, reported procedures have a very high on-column loading of the analytes at the ULOQ level, which may reduce 14 the efficiency of the column and may affect the column life . 1-chlorobutane was used for extraction of the Ezetimibe from
1
plasma . Literature revels that 1-chlorobutane is a toxic solvent. Also one of the available method was not selective, as
12 the estimation was done in rat bile .
In the present study, a new, rapid, specific, precise and validated HPLC method for the quantitative estimation of ezetimibe in pharmaceutical dosage forms is developed.
MATERIALS AND METHODS
Chemicals and reagents:
Ezetimibe (99.68% pure) was a gift sample from Glenmark Pharmaceuticals Ltd. Atazanavir sulphate (99.40% pure, Internal standard) was obtained from Matrix Laboratories. Acetonitrile (HPLC grade) and Methyl tertiary butyl ether was obtained from Labscan, Thailand. HPLC grade deionized water Milli Q (Millipore) was used throughout the analysis. All the other chemicals used were of analytical grade.
Instrumentation:
The HPLC system consisted of a Prominence (Shimadzu) was used for analysis. Analysis was carried out at 233 nm with a Betasil C (250 mm x 4.6 mm i.d., 5µ) column using a 18 mobile phase composition of Acetonitrile: 10 mM Na HPO2 4 pH 7.0 (60:40 v/v) that was set at a flow rate of 1mL/min.
Preparation of solutions:
Preparation of stock solution:
Ezetimibe (Analyte)
Main stock solution (1000 µg/mL): 10.00 mg of Ezetimibe was taken in 10 mL volumetric flask and 5.00 mL of acetonitrile was added and sonicated well to dissolve. The volume was made up to mark with acetonitrile.
Intermediate stock solution (160 µg/mL): Intermediate dilution was prepared by diluting 1.600 mL of main stock solution to 10 mL in volumetric flask. Then it was vortexed for 2 minutes to mix well.
Working standard solution (10 µg/mL): Working standard solution was prepared by diluting 0.625 mL of intermediate stock solution to 10 mL in volumetric flask. Then it was vortexed for 2 minutes to mix well.
Atazanavir sulphate (ISTD)
Main stock solution (1000 µg/mL): 12.93 mg of Atazanavir sulphate was taken in 10mL volumetric flask and 5mL of
acetonitrile was added and sonicated well to dissolve. The volume was made up to mark with acetonitrile.
Intermediate stock solution (100µg/mL): Intermediate dilution was prepared by diluting 1.00 mL of main stock solution to 10 mL in volumetric flask. Then it was vortexed for 2 minutes to mix well.
Working standard solution (25 µg/mL): Working stock dilution was prepared by diluting 2.50 mL of main stock solution to 10 mL in volumetric flask. Then it was vortexed for 2 minutes to mix well.
Method validation
System suitability: System suitability test was carried out to verify that the analytical system is working properly and can give accurate and precise results. The overall system suitability was evaluated for the system suitability of the proposed method. Data from six injections (10.0µg/mL) were utilized for calculating parameters like Capacity factor (k), Theoretical plates/meter, Resolution, Tailing factor and % CV of 6 injections.
Detection and quantitation limits (sensitivity): Limits of detection (LOD) and quantitation (LOQ) were estimated from the signal-to-noise ratio. The detection limit was defined as the lowest concentration level resulting in a peak area of three times the baseline noise. The quantitation limit was defined as the lowest concentration level that provided a peak area with a signal-to-noise ratio higher than 10, with precision (%CV) and accuracy (%bias) within ±10%. The detection limit and the quantitation limit can be calculated based on the Standard deviation of the response and the slope of calibration curve.
Linearity (calibration curve): Aqueous dilutions of Ezetimibe were prepared by taking respective volume of intermediate stock(160µg/mL) as mentioned in Table 1 and then diluted in serial dilution manner with diluent to get the desired concentration .Calibration solutions were prepared in duplicate by placing equal volume of Ezetimibe and ISTD. Peak area ratios of Ezetimibe to that of ISTD were calculated
2 and graph was prepared. The regression coefficient 'r ', y-intercept and slope of the regression were calculated .
Precision:
System Precision (Injection Reproducibility): System precision of method was carried out by analyzing six replicate injections of assay concentration of Ezetimibe (10.0 µg/mL). The retention time and area ratio of six determinations were measured and percent coefficient variation (%CV) calculated.
that with the Betasil C column. With Betasil C column the 18 18 peak shape and response observed were good. Therefore, Thermo Betasil C column was used for further studies.18
Mobile Phase: Acetonitrile has low viscosity, low vapour pressure (low back pressure, high efficiency separation) and is transparent in UV region therefore it was used as organic phase. Acetonitrile: water (50:50 %v/v) was tried first as the mobile phase; with this combination resolution could not be achieved between the solvent and drug peaks, plasma interferences and ISTD peaks. However good resolution was obtained using of acetonitrile: water (60:40 %v/v), but the peak were broad, showed tailing and low precision. These problems were solved when water in mobile phase was replaced with 10 mM potassium dihydrogen phosphate buffer, as buffer forms the ion pair with free silanol groups and thus reduces the tailing. The retention time of Ezetimibe was affected by the pH values of the systems; therefore the considering the pKA value (9.66), pH of phosphate buffer was adjusted to 7.0 in this work.
Method validation:
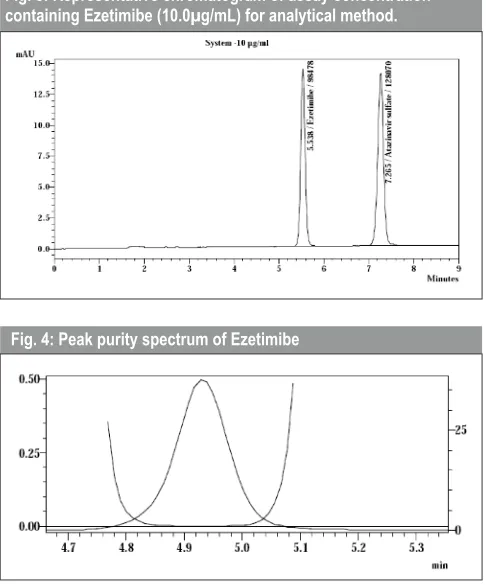
System suitability: Data from six injections of assay concentration of Ezetimibe (10.0µg/mL) were utilized for calculating parameters for system suitability. Tailing factor of Ezetimibe was close to 1.008 which indicated that the peak shape was symmetrical. Representative chromatogram of concentration (10.0 µg/mL) of standard and sample solutions.
Percentage assay of sample to that of label claim was calculated by comparing the sample solution response that of standard solution response. % CV of assay results were calculated.
Intermediate precision (Ruggedness): Intermediate precision was assessed by analyzing the same standard and sample solution on different days. % CV of assay results were calculated.
Accuracy: The known amount of standard was spiked (80, 100 and 120 %) in triplicate to the pre analyzed samples and recovery of drug was calculated.
Sample preparation (as such): Accurately weighed 10.00 mg of powdered Ezetimibe tablets was transferred into three 10 mL volumetric flasks. 5.0 mL of acetonitrile was added into each of the flasks, sonicated to dissolve the contents and then the volume was finally made up with acetonitrile. Further this solution was diluted appropriately using acetonitrile: water (60:40 %) to obtain a concentration of 10µg/mL.A solution of 10µg/mL. Ezetimibe along with the fixed concentration of 25µg/mL of Atazanavir sulphate (ISTD) was prepared and mixture was sonicated for 10 min and filtered Whatman filter paper and analysed in triplicates.
Sample preparation (80 %, 100 % and 120 % levels): To this preanalysed samples (10 µg/ mL Ezetimibe and 25 µg/mL ISTD), 8, 10 and 12 µg/ mL (Standard Ezetimibe API solutions) i.e. 80 %, 100 % and 120 % levels were added and the samples were analyzed in triplicates in the same chromatographic condition. The percentage recovery was calculated from standard plot of the same day by applying the peak area ratio method.
Specificity: The specificity of assay method was evaluated by the peak purity index, Single point threshold and minimum peak purity index of Ezetimibe using diode array detector (Shimadzu class LC solution software).
RESULTS AND DISCUSSION
Method development and optimization
Detection system: The presence of chromophores in the molecular structure, such as benzoid ring and carbonyl group makes UV-Visible method suitable for the determination of Ezetimibe.Selection of λmax was done based on spectrophotometric scan of compound. Ezetimibe showed λmax at 233.0 nm (figure 2) and therefore 233.0 nm was used as detection wavelength for HPLC analysis of Ezetimibe.
Choice of Column: The efficiency of different reverse phase columns was evaluated. With Genesis C column the results 18 obtained were not satisfactory as there was peak tailing observed as also the response was comparatively lesser than
F O
N OH
OH
F
Fig. 1: Structure of Ezetimibe
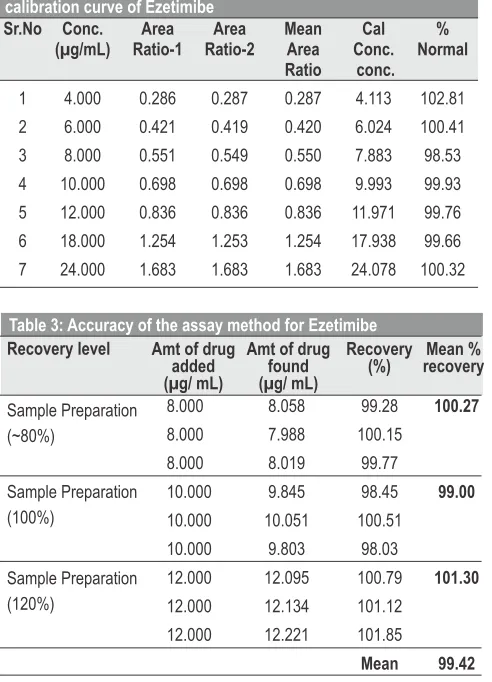
Fig. 2: Calibration curve for Ezetimibe
Y = 0.005693487 X + 0.0007439077, Regression-coefficient
2
covariance of percent assay of intraday precision were found to be 100.38 and 0.22 respectively. which confirms that suggested method was precise.
Intermediate precision (Ruggedness): Intermediate precision was assessed by analyzing the same standard (10.0 µg/mL) and sample solution (10.0 µg/mL) on different days. The mean and percent covariance of percent assay of intermediate precision were found to be 99.81 and 1.32 respectively. The acceptance criteria were 2.0 % and the outcomes of the experiments were within the acceptable limits for the intra day assay and the inter day assay .Hence, it can be concluded that the method was both precise and rugged.
Accuracy: The recoveries at three different concentrations were found to be 100.27 %, 99.00 % and 101.30 %.The results indicated that the mean recovery of Ezetimibe at three different concentrations was 99.42 %. The recovery experiments of the method are depicted in the table 3. The higher percentage mean recovery indicated that the proposed method was accurate and reliable.
Specificity: The developed method was used for the estimation of Ezetimibe in tablets. The excipients did not interfere in the estimation. It was evaluated for the spectral purity using the diode array detector and the purity of the peak constituting for Ezetimibe passed the test. Interferences from the tablet formulation were absent. Using shimadzu class LC Solution software it was found that threshold and minimum purity index were found as 0.999520 and 480 respectively. The peak purity of Ezetimibe spectra is given in the figure 4. The results indicated that the method was specific.
Robustness: The system suitability parameters obtained from normal experimental conditions and that obtained from small and deliberately changed conditions passes each of the system suitability parameters like Capacity factor (k), Tailing factor, Resolution and Theoretical plates/meters for all the conditions. The percent covariance of six estimations were found to be in the range of 0.10 to 0.20 which concluded that the method was robust.
Ezetimibe at assay concentration (10.0 µg/mL) is represented as figure 3. The high counts of theoretical plates revealed the column efficiency. The capacity factor was found to be 5.318 and 7.702 for Ezetimibe and Internal standard respectively Hence, it can be concluded that the system suitability parameter meets the requirement of method validation.
Linearity: The response was found to be linear over a concentration range of 4-24µg/mL for Ezetimibe. The
2
regression-coefficient (r ) was found to be 0.9999 which is within the acceptance criteria limit of ≥ 0.99.
Precision:
System Precision (Injection Reproducibility): System precision of method was carried out by analyzing six replicate injections of assay concentration of Ezetimibe (10.0 µg/mL). It is observed from the data in table 2, that the retention times of Ezetimibe and ISTD and peak area ratios are consistent. Hence, it can be concluded that the system precision parameter meets the requirement of method validation.
Intra day precision (Method precision): Percentage assay of sample to that of label claim was calculated by comparing the sample solution (10.0 µg/mL) response to that of standard solution (10.0 µg/mL) response. The mean and percent
Sr.No Conc. Area Area Mean Cal %
(µg/mL) Ratio-1 Ratio-2 Area Conc. Normal
Ratio conc.
1 4.000 0.286 0.287 0.287 4.113 102.81 2 6.000 0.421 0.419 0.420 6.024 100.41 3 8.000 0.551 0.549 0.550 7.883 98.53 4 10.000 0.698 0.698 0.698 9.993 99.93 5 12.000 0.836 0.836 0.836 11.971 99.76 6 18.000 1.254 1.253 1.254 17.938 99.66 7 24.000 1.683 1.683 1.683 24.078 100.32
Table 1: Back calculated concentration of standards from calibration curve of Ezetimibe
No. of Peak area Retention time Retention time
injection Ratio for Ezetimibe for ISTD
1 0.611 4.918 6.283
2 0.610 4.915 6.278
3 0.610 4.913 6.276
4 0.611 4.917 6.286
5 0.610 4.912 6.276
6 0.611 4.918 6.284
Mean 0.611 4.916 6.281
%CV 0.12 0.05 0.07
Table 2: Results of System Precision
8.000 8.058 99.28 100.27
8.000 7.988 100.15 8.000 8.019 99.77
10.000 9.845 98.45 99.00
10.000 10.051 100.51 10.000 9.803 98.03
12.000 12.095 100.79 101.30
12.000 12.134 101.12 12.000 12.221 101.85
Mean 99.42
Sample Preparation (~80%)
Sample Preparation (100%)
Sample Preparation (120%)
Recovery level Amt of drug
added (µg/ mL)
Amt of drug found (µg/ mL)
Recovery
5. Davidson MH, McGarry T, Bettis R, Melani LJ, et al. Ezetimibe coadministered with simvastatin in patients with primary hypercholesterolemia. J. Am. Coll. Cardiol. 2002; 40 :2125–34. 6. Kerzner BK., Corbelli JM, Sharp SS, et al, Efficacy and safety of
ezetimibe coadministered with lovastatin in primary hypercholesterolemia Am. J. Cardiol. 2003; 91: 418-424. 7. Farnier M. Volpe M. Massaad R. Davies MJ. Allen C. Effect of
co-administering ezetimibe with on-going simvastatin treatment on LDL-C goal attainment in hypercholesterolemic patients with coronary heart disease. International Journal of Cardiology. 102(2):327-32, 2005 Jul 10.
8. Oliveira PC., Brum JD, Fronza ME, et al. Development and validation of a liquid chromatography-tandem mass spectrometry method for the determination of Ezetimibe in human plasma and pharmaceutical formulations. Chromatographia 2006;63(7-8): 315-20.
9. Lia SC, Liua GH, Jiaa JJ, Lib XY, Yua CC, Liquid chromatography–negative ion electrospray tandem mass spectrometry method for the quantification of Ezetimibe in human plasma.J. Pharma. Biomed. Ana 2006; 40(4): 987-92. 10. Houle MG, Jobin IM , Marcoux ME, Couture JR, Vallee F.
Sensitive LC/MS/MS method for the analysis of unconjugated Ezetimibe in human EDTA K plasma. The AAPS J.; 7: S2 3 Abstract no. M 1061. 2005.
11. Basha SJ, Naveed SS, Tiwari NH, Shashikumar DD, et al. Concurrent determination of Ezetimibe and its phase-I and II metabolites by HPLC with UV detection: Quantitative application to various in vitro metabolic stability studies and for qualitative estimation in bile. J. Chromatogr. B. 2007;853: 88–96.
12. Oswald SR, Scheuch IE, Cascorbi IT and Siegmunda WY, A LC–MS/MS method to quantify the novel cholesterol lowering drug Ezetimibe in human serum, urine and feces in healthy subjects genotyped for SLCO1B1. J. Chromatogr. 2006;150: 830- 3.
13. Synder LC., Kirkland JJ and Glajch JL, Practical HPLC Method Development, second ed., John Wiley & sons, Inc; 1997; 210-556.
14. Singh SS, Singh BS, Bahuguna RD, Wadhwa LF and Saxena RR. Stress degradation studies on Ezetimibe and development of a validated stability-indicating HPLC assay. J. Pharma. Biomed. Anal. 2006;41: 1037–40.
15. Ozaltin NY. And Ucakturk ET. Simultaneous determination of Ezetimibe and Simvastatin in pharmaceutical formulations by dual-mode gradient LC. Chromatographia 2007;66: S87-S91. 16. Sistla RR, Tata VY, Kashyap YE, Chandrasekhar DE and
Diwan PR. Development and validation of a reversed-phase Detection Limit and Quantitation Limit: For the present
method LOD and LOQ were found to be 286.77 ng/mL and 869.01 ng/mL respectively.
CONCLUSION
An new, rapid, specific isocratic HPLC method has been developed for the determination of ezetimibe using a UV detector. The method was validated for accuracy, precision, linearity and stability. The method uses a simple mobile phase composition, easy to prepare with little or no variation. The rapid run time of 9 min and the relatively low flow rate (1 ml/min) allows the analysis of large number of samples with less mobile phase that proves to be cost-effective. Hence, this HPLC-UV method can be used for the routine drug analysis.
REFERENCES
1. Patrick JE, Kosoglou T. Stauber, KL et al. Disposition of the Selective cholesterol absorption inhibitor Ezetimibe in healthy male subjects. Drug Metab. Dispos. 2002;30(4): 430-7. 2. Van Heek M, Farley C, Compton D, et al. Proceedings of the
12th International Symposium on Atherosclerosis, Tu T3 W16 (Abstract).
3. Ballantyne CM. Eur. Heart J. (Suppl. J) 2002 : 4 J9.
4. Ballantyne, CM, Houri JK, Notarbartolo AF, et. Opposing Gatekeepers of Apical Sterol Transport: Niemann-Pick C1-Like 1 (NPC1L1) and ATP-Binding Cassette Transporters G5 and G8. (ABCG5/ABCG8). Circulation 2003; 107 : 2409-15.
Fig. 3: Representative chromatogram of assay concentration containing Ezetimibe (10.0µg/mL) for analytical method.
HPLC method for the determination of Ezetimibe in pharmaceutical dosage forms. J. Pharma. Biomed. Anal. 2005;39: 517–22.
17. Sonawane SR, Shirkhedkar AD, Fursule RF and Surana FW; Application of UV-spectrophotometry and RP-HPLC for simultaneous determination of Atorvastatin Calcium and Ezetimibe in pharmaceutical dosage form. Eurasian J. Anal. Chem. 2006;1 (1): 1306-3057.
18. Sethi P,. HPLC Quantitative Analysis of Pharmaceutical Formulations, 1 ed., CBS Publication and Distributor 2001; 14-15.
19. Akmar SR, Kothapalli LA, Thomas SE; Jangam DR and Deshpande AE; Reverse phase high performance liquid chromatography method for estimation of Ezetimibe in bulk and pharmaceutical formulations. Indian J. Pharma. Sci. 2007;69(5): 695-7.
20. Rajkondawar VM, Simultaneous estimation of Rosuvastatin and Ezetimibe by reverse phase high performance liquid chromatography. Asian J. Chem. 2006; 18(4) : 3123-3125. 21. Chaudhari BC, Patel NN and Shah PA; Stability-indicating
reversed-phase liquid chromatographic method for simultaneous determination of Simvastatin and Ezetimibe from their combination drug products. J.AOAC Int. 2007; 90(5):1242-49.