Open Access
Research
Variations in societal characteristics of spatial disease clusters:
examples of colon, lung and breast cancer in Japan
Yoshiharu Fukuda*, Masahiro Umezaki, Keiko Nakamura and
Takehito Takano
Address: Health Promotion/International Health, Division of Public Health, Graduate School of Tokyo Medical and Dental University, Yushima 1-5-45, Bunkyo, Tokyo, 113-8519, Japan
Email: Yoshiharu Fukuda* - [email protected]; Masahiro Umezaki - [email protected]; Keiko Nakamura - [email protected]; Takehito Takano - [email protected]
* Corresponding author
Abstract
Background: Spatial analyses and ecological studies are essential for epidemiology and public health. The present study combining these two methods was performed to identify spatial clusters of selected types of cancer in Japan and to determine their societal characteristics focusing on homogeneity among clusters.
Results: Spatial clusters of high mortality rates of male colon and lung cancer and of female breast cancer were identified by the spatial scan statistic using Japanese municipal data (N = 3360) from 1993 to 1998 and also municipalities were divided into four societal clusters based on socioeconomic indicators and population density (urban-rich, suburban, rural-poor, and clutter). Five, seven, and four mortality clusters were identified for lung, colon and breast cancer, respectively. For colon and breast cancer, most municipalities of all except one cluster were included in a single societal cluster (urban-rich). The municipalities associated with mortality clusters for lung cancer belonged to various societal clusters.
Conclusion: Increased mortality rates of colon and breast cancer can be explained by homogenous societal characteristics related to urbanisation, although there were exceptional areas with higher mortality rates. The regional variation in lung cancer mortality rate appeared to be due to heterogeneous factors. These findings and the analysis performed in the present study will contribute to both nationwide and region-specific cancer prevention strategies.
Background
Health levels vary substantially between different regions, and it is essential to characterise these regional variations and identify areas with an accumulation of health prob-lems for epidemiologic research and to allow appropriate public health policy decisions [1,2]. Recent advancements in technologies, such as geographic information systems
(GIS), have allowed the application of not only disease mapping but also spatial analyses, such as spatial cluster-ing and cluster detection, in epidemiological research [3-6]. In this context, clusters are defined as unusual concen-trations of health events in both space and time [1]. Published: 14 June 2005
International Journal of Health Geographics 2005, 4:16 doi:10.1186/1476-072X-4-16
Received: 28 April 2005 Accepted: 14 June 2005
This article is available from: http://www.ij-healthgeographics.com/content/4/1/16 © 2005 Fukuda et al; licensee BioMed Central Ltd.
Ecological studies examining the relationships between regional health levels and various characteristics represent another essential approach in epidemiology and public health. Although such studies have a number of limita-tions, especially confounding factors and ecological fal-lacy, factors that may contribute to regional health variations can be identified and hypotheses can be formu-lated for further research [7,8]. Several ecological studies have demonstrated relationships between mortality and regional characteristics related to the environment, health-related behaviour, and economic and demo-graphic factors in Japan [9-12]. Recent systematic studies using municipal data regarding all causes and cause-spe-cific mortality along with large numbers of societal indi-cators showed substantial relationships between a region's mortality rate and societal characteristics [13-15].
In general, the relations between health levels and regional characteristics are examined by correlation and regression analyses [8-14]. These methods can reveal fac-tors correlated with regional variations in a specific health issue across study areas. However, if various factors con-tribute separately to a health issue for different areas, or where there is an exceptional factor contributing to a health issue in a limited area, such analyses would not be effective in identifying the contributing factors and may overlook exceptional factors.
The present study was performed to determine whether areas with a specific health problem have homogeneous regional characteristics or different patterns of characteris-tics. We first identified spatial clusters of three common types of cancer (colon, lung and breast) using the spatial scan statistic. The societal characteristics of the clusters were then elucidated, focusing on heterogeneity in the characteristics among clusters, using municipal data across Japan.
Results
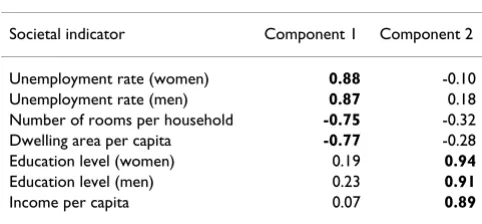
The result of principle component analysis for seven soci-oeconomic indicators, to reduce the number of variables and identify dimensional societal factors, was shown in
Table 1. Two principle components were identified and they accounted for 78.1% of the total variance inherent in the data. The meaning of these components was consid-ered higher unemployment and overcrowding for the first component and higher income and educational level for the second component. Component scores of the compo-nents were assigned to each municipality as societal indi-ces, designated Index 1 and Index 2, respectively, with a mean of 0.0 and standard deviation of 1.0.
The results of cluster analysis for the purpose of categori-zation of municipalities into societal cluster (SC) are shown in Table 2. SC1 was characterized with high Index 2 and high population density; SC2 with moderate Index 1, Index 2 and population density; SC3 with low Index 1, Index 2 and population density; and SC4 with high Index 1 and population density and low Index 2. The map of these societal clusters is shown in Figure 1. Most of munic-ipalities in the metropolitan areas such as Tokyo, Nagoya, and Osaka, and most of municipalities of seat of prefec-tural government belong to SC1. In generally, SC2 are located surrounding SC1, and SC3 are located in moun-tain areas. SC4 are separately distributed, including some municipalities in Okinawa prefecture and the central part of Osaka. The characteristics of societal clusters were inter-preted as urban-rich, suburban, rural-poor, and clutter, respectively.
Table 1: Result of principle component analysis.
Rotated component Matrix from the principle component analysis of seven societal indicators.
Societal indicator Component 1 Component 2
Unemployment rate (women) 0.88 -0.10
Unemployment rate (men) 0.87 0.18
Number of rooms per household -0.75 -0.32 Dwelling area per capita -0.77 -0.28
Education level (women) 0.19 0.94
Education level (men) 0.23 0.91
Income per capita 0.07 0.89
Table 2: Characteristics of societal clusters.
Comparison of societal indices and population density among societal clusters (SC).
Variable Societal cluster
SC1 (N = 507) SC2 (N = 1483) SC3 (N = 1246) SC4 (N = 124)
Index 1: high unemployment and overcrowding 0.89 ± 0.66 -0.08 ± 0.63 -0.54 ± 0.74 2.69 ± 1.23 Index 2: high income and educational level 1.56 ± 1.06 -0.06 ± 0.64 -0.45 ± 0.62 -1.13 ± 0.69
Municipal standardized mortality ratio (SMR) and the results of spatial scan statistic for male colon and lung cancer and female breast cancer are shown in Figures 2, 3 and 4. As shown in Figure 2 (b), the primary cluster for colon cancer (MC1) included 53 municipalities with a rel-ative risk (RR) of 1.14, and was located in the Tokyo metropolitan area. Four additional clusters were also identified: MC2 was located in the northern part of the main island (Honshu Island) and Hokkaido Island (Hokkaido prefecture), MC3 and MC4 were located in Osaka and Nagoya, which are the second and third largest
metropolitan areas after the Tokyo area, respectively, and MC5 that included only one city.
The mortality clusters of male lung cancer are illustrated in Figure 3 (b). The primary cluster (MC1) was located in an area including Osaka, with RR of 1.17. A total of six sec-ondary clusters were also identified. The municipalities of MC2 belonged mainly to Hokkaido prefecture, and those of MC3 belonged to Okinawa prefecture consisting of the southern islands. MC4, MC6, and MC7 included the
met-Distribution of societal clusters
Figure 1
Distribution of societal clusters. (a) Map of Japan. (b) Municipalities are classified into four societal clusters (SCs) according to two societal indices (high unemployment and overcorwing and high income and educational level: see Table 1) and popual-tion density. The characeritics of clusters are shown in Table 2.
Societal clusters
SC1: Urban-rich
SC2: Suburban
SC3: Rural-poor
SC4: Clutter
0 100200
Kilometers
Hokkaido
Tokyo
Nagoya city
Shikoku island Kyushu island
Osaka city
(a)
(b)
SMR and mortality clusters for colon cancer
Figure 2
SMR and mortality clusters for colon cancer. Municipal standardized mortality ratio (SMR) (a) and mapping of mortality clusters (MC) (b) with higher mortality rates from male colon cancer. The clusters were identified by the spatial scan statistic. N = number of municipalities belonging to each cluster. RR = relative risk.
MC2
N = 228 RR = 1.13 p < 0.001MC3
N = 61 RR = 1.10 p = 0.002
MC4
N = 27 RR = 1.18 p = 0.015MC1 (primary)
N = 53RR = 1.14 p < 0.001
MC5
N = 1 RR = 1.51 p = 0.020 100200
Kilometers
(a) SMR
0.68 - 0.82 0.83 - 0.89 0.90 - 0.96 0.97 - 1.05 1.06 - 1.24
SMR and mortality clusters for lung cancer
Figure 3
SMR and mortality clusters for lung cancer. Municipal standardized mortality ratio (SMR) (a) and mapping of mortality clusters (MC) (b) with higher mortality rates from male lung cancer. The clusters were identified by the spatial scan statistic. N = number of municipalities belonging to each cluster. RR = relative risk.
MC2
N = 289 RR = 1.12 p < 0.001MC1 (primary)
N = 159 RR = 1.17 p < 0.001
MC5
N = 12 RR = 1.66 p < 0.001MC4
N = 54 RR = 1.13 p < 0.001MC7
N = 8 RR = 1.13 p = 0.03MC6
N = 163 RR = 1.08 p < 0.001
MC3
N = 48 RR = 1.22 p < 0.0010 100200 Kilometers
(a) SMR
0.65 - 0.87 0.88 - 0.96 0.97 - 1.04 1.05 - 1.13 1.14 - 1.40
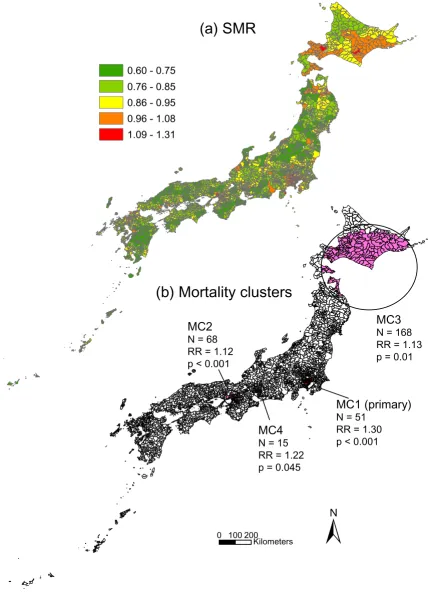
SMR and mortality clusters for breast cancer
Figure 4
SMR and mortality clusters for breast cancer. Municipal standardized mortality ratio (SMR) (a) and mapping of mortality clusters (MC) (b) with higher mortality rates from female breast cancer. The clusters were identified by the spatial scan statis-tic. N = number of municipalities belonging to each cluster. RR = relative risk.
0 100200
Kilometers
MC3
N = 168 RR = 1.13 p = 0.01
MC4
N = 15 RR = 1.22 p = 0.045
MC2
N = 68 RR = 1.12 p < 0.001
MC1 (primary)
N = 51 RR = 1.30 p < 0.001
(a) SMR
0.60 - 0.75 0.76 - 0.85 0.86 - 0.95 0.96 - 1.08 1.09 - 1.31
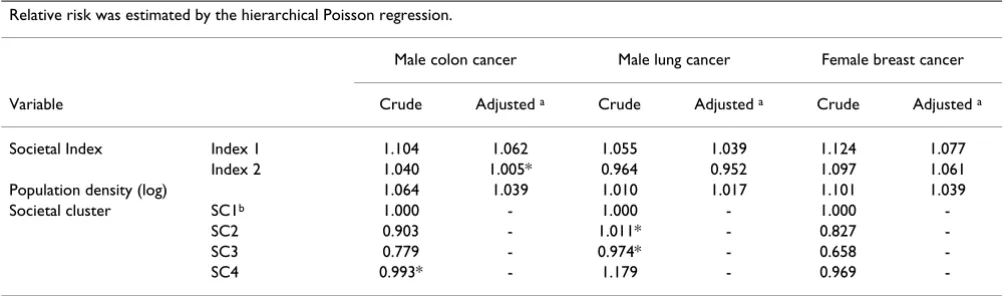
Table 3: Relative risk of societal indices, population density and societal cluster.
Relative risk was estimated by the hierarchical Poisson regression.
Male colon cancer Male lung cancer Female breast cancer
Variable Crude Adjusted a Crude Adjusted a Crude Adjusted a
Societal Index Index 1 1.104 1.062 1.055 1.039 1.124 1.077
Index 2 1.040 1.005* 0.964 0.952 1.097 1.061
Population density (log) 1.064 1.039 1.010 1.017 1.101 1.039
Societal cluster SC1b 1.000 - 1.000 - 1.000
-SC2 0.903 - 1.011* - 0.827
-SC3 0.779 - 0.974* - 0.658
-SC4 0.993* - 1.179 - 0.969
-aThe model included societal indices and population density. bThe reference for societal clusters. *not significant (p > = 0.05)
Table 4: Relationship between mortality clusters and societal clusters.
Figures show the number of municipalities and the percentage in parenthesis by mortality cluster.
Mortality cluster a Societal cluster b
SC1 (N = 507) SC2 (N = 1483) SC3 (N = 1246) SC4 (N = 124)
Male colon cancer
MC1 (N = 53) 53 (100.0)
MC2 (N = 228) 8 (3.5) 59 (25.9) 152 (66.7) 9 (3.9)
MC3 (N = 61) 45 (73.8) 7 (11.5) 9 (14.8)
MC4 (N = 27) 25 (92.6) 2 (7.4)
MC5 (N = 1) 1(100.0)
Male lung cancer
MC1 (N = 159) 81 (50.9) 33 (20.8) 33 (20.8) 12 (4.8)
MC2 (N = 289) 8 (2.8) 46 (15.9) 221 (76.5) 14 (4.8)
MC3 (N = 48) 5 (10.4) 6 (12.5) 37 (77.1)
MC4 (N = 54) 28 (51.9) 24 (44.4) 2 (3.7)
MC5 (N = 12) 4 (33.3) 7 (58.3) 1 (8.3)
MC6 (N = 162) 27 (16.7) 94 (58.0) 16 (9.9) 25 (15.4)
MC7 (N = 8) 8 (100.0)
Female breast cancer
MC1 (N = 51) 51 (100.0)
MC2 (N = 68) 57 (83.8) 2 (2.9) 9 (13.2)
MC3 (N = 168) 8 (4.8) 24 (14.3) 126 (75.0) 10 (6.0)
MC4 (N = 15) 15 (100.0)
ropolitan areas of Nagoya, Fukuoka and Tokyo, respec-tively, while MC5 was located in the mountainous area on Shikoku Island.
As shown in Figure 4 (b), of the four mortality clusters identified for female breast cancer, three were located in metropolitan areas: MC1 in Tokyo, MC2 in Osaka and MC4 in Nagoya. The centre of the remaining cluster, MC3, was located in Hokkaido.
RRs of societal indices, population density, and societal clusters for cancer mortality, which were estimated by the hierarchical Poisson regression, are shown in Table 3. Mortality from colon and breast cancers was significantly and positively related to societal indices and population density. Mortality from lung cancer was significantly and negatively related to Index 2. SC2, SC3, and SC4 showed the lower RR compared to SC1 for colon and breast can-cers, while SC4 showed the higher RR for lung cancer.
Table 4 shows the relationships between mortality clusters and societal clusters. For MC1, MC3, MC4 and MC5 in colon cancer, the dominant societal cluster was SC1. For MC2 the proportion of SC1 was very low (3.5%), and the dominant cluster was SC3 (66.7%). In lung cancer, there were variations in dominant societal clusters. Similar pat-terns of societal cluster were observed only for MC1 and MC4 with SC1 as the dominant societal cluster and for MC2 and MC5 with SC3. In breast cancer, most munici-palities of MC1, MC2 and MC3 consisted of SC1. For MC3, the dominant societal cluster was SC3 (75.0%).
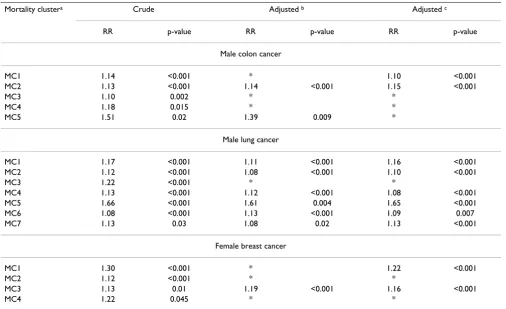
Comparisons of mortality clusters before and after adjust-ment for societal indices, population density, and societal clusters are shown in Table 5. After adjustment in colon cancer, MC1, MC3, MC4, and MC5 were not detected or showed a decrease of RR. In lung cancer, only MC2 was not detected after adjustment. In breast cancer, MC1, MC2 and MC4 were not detected or showed a decrease of RR, while MC3 showed an increase of RR after adjustment.
Table 5: Comparisons of crude and adjusted mortality clustering
Mortality clustera Crude Adjusted b Adjusted c
RR p-value RR p-value RR p-value
Male colon cancer
MC1 1.14 <0.001 * 1.10 <0.001
MC2 1.13 <0.001 1.14 <0.001 1.15 <0.001
MC3 1.10 0.002 * *
MC4 1.18 0.015 * *
MC5 1.51 0.02 1.39 0.009 *
Male lung cancer
MC1 1.17 <0.001 1.11 <0.001 1.16 <0.001
MC2 1.12 <0.001 1.08 <0.001 1.10 <0.001
MC3 1.22 <0.001 * *
MC4 1.13 <0.001 1.12 <0.001 1.08 <0.001
MC5 1.66 <0.001 1.61 0.004 1.65 <0.001
MC6 1.08 <0.001 1.13 <0.001 1.09 0.007
MC7 1.13 0.03 1.08 0.02 1.13 <0.001
Female breast cancer
MC1 1.30 <0.001 * 1.22 <0.001
MC2 1.12 <0.001 * *
MC3 1.13 0.01 1.19 <0.001 1.16 <0.001
MC4 1.22 0.045 * *
aMortality cluster (MC) of municipalities with high mortality was identified by the spatial scan statistic: Figures 2-4. bAdjusted for relative risk of societal indices and population density.
Discussion
The results of the present study identified spatial clusters with high mortality rates of colon and lung cancer in men, and of breast cancer in women in Japan. The societal char-acteristics of the municipalities belonging to these clusters were determined by the relationships between mortality clusters and societal clusters. A single dominant societal cluster was detected for colon and breast cancer, although one mortality cluster was exclusive for each cancer. In con-trast, we did not detect a dominant societal cluster for lung cancer.
The detection of a single dominant societal cluster for colon and breast cancer, SC1, suggested that there were homogeneous area characteristics for increased mortality due to these types of cancer. This societal cluster had a high Index 2 representing high income and education level and high population density, which were urban characteristics. These findings were consistence with those of a previous study indicating a positive relationship between mortality from these cancers and socioeconomic index of urbanisation [14]. The relationship between mortality from colon and breast cancer and urban resi-dence is plausible considering risk factors of these cancers, such as westernised dietary habits and low birth rate [16].
One mortality cluster for each of colon and breast cancer (MC2 and MC 3, respectively) showed different character-istics from other mortality clusters. It is possible that fac-tors other than those related to urbanisation contributed to the increased mortality in these areas, and further stud-ies are required to elucidate these unique factors. This observation suggests that the factors contributing to the increased mortality in these exceptional areas may be overlooked in conventional ecological studies.
Unlike colon and breast cancer, no dominant societal cluster was observed for lung cancer. The prevalence of smokers was not included in the set of indicators in the present study because municipal data concerning smok-ing were not available. It is possible that socioeconomic factors used in this study are surrogates of factors related to colon and breast cancers (e.g., dietary habits), while they might not be surrogates of smoking. The higher mortality in Hokkaido prefecture, as identified by MC2, could be explained by the slightly higher smoking rate reported in this area [16]. However, the prefectural data of smoking did not found that other clusters were not related to areas with higher smoking rate [16]. Previous studies showed small variation in male smoking rate and little relationship between smoking rate and regional socioeco-nomic conditions, and there was no correlation of male smoking rate with lung cancer mortality [17,18]. Thus, it seems that the difference of smoking rate does not thoroughly explain the regional variation in lung cancer
mortality rate, although there is no doubt in contribution of smoking to lung cancer, which is the leading cause of cancer deaths in Japanese men [19].
A number of possible contributors to increased mortality from lung cancer in addition to smoking have been reported [20]. Air pollution is an important factor among these possible contributors, and the observation that sev-eral clusters of lung cancer were located in metropolitan areas may be explained by the increase in lung cancer due to air pollution. In Okinawa prefecture, local brand ciga-rettes with a higher tar yield and the prevalence of human papilloma virus infection were suspected to contribute to the increased mortality from lung cancer in this area [21,22]. If multiple factors: i.e., smoking, air pollution and other specific local factors, contribute to the regional variation in lung cancer mortality, it is reasonable that no uniform characteristics of mortality clusters were detected in the present study.
We found a similarity of mortality clusters among three types of cancers. Three metropolitan areas (Tokyo, Osaka, and Nagoya) were detected as mortality clusters for all cancers. Urban areas recently show a decrease of the rela-tive health level in Japan, and cancer mortality largely attributes to the decreased health level among urban populations [13-15]. Mortality from several types of cancers seems to be concurrently increased by factors related to urban areas such as health risk behaviour and fewer attendances in cancer screening [23,24]. On the other hand, our findings suggested that the northern part including lots of rural-poor municipalities (SC3) appeared to be another area with higher mortality from some types of cancer. The possible causes of higher mor-tality in this area should be carefully investigated focusing on differences from those in urban areas.
restricted local areas [28-30], but the incidence data of cancer across the country was not available in Japan.
The societal indicators used in this study were restricted. We used indicators that were demonstrated previously to be critically associated with health level [13,15,31], although some indicators of potential cancer risks may not have been included, especially with regard to health-related behaviour. Second, the societal clustering of municipalities was an important issue in the present study. In contrast to other countries [32-34], as there are no established area classifications or societal indices rep-resenting regional characteristics in Japan, we formulated societal indices and classified municipalities by the prin-ciple component analysis and the cluster analysis. Differ-ent combinations of indicators may result in differDiffer-ent figures of societal clusters. Especially, the principle com-ponent analysis has been the subject of a variety of criti-cisms including sensitivity of indicator selection and meaning of the components extracted [35,36], although it has been used to reduce socioeconomic indicators and to obtain one or a few composite index [29,32,37]. In addi-tion, unlike mortality data, societal data were not treated by spatial statistics. Spatial methods such as using popu-lation potential [38] instead popupopu-lation density and data smoothing for unstability in the municipalities with small population could contribute to more accurate societal classifications of municipality.
The relation between societal characteristics and mortality was mainly examined using societal clusters and mortality clusters. Societal indices and population density showed the significant relation to mortality according to types of cancer, and they might be more sensitive than societal clusters. The statistical comparisons of societal indices and population density among mortality clusters showed significant differences for most pairs of mortality clusters (data not shown). Thus, the analyses with these variables appeared to be too sensitive to examine homogeneity and heterogeneity among mortality clusters. Since the number of societal clusters was arbitrary in the cluster analysis, an increase of the number of societal clusters would show more complicated variations in the societal characteristics among mortality clusters. Significantly, in the present study even when simple societal clustering was applied, both heterogeneity and homogeneity in societal charac-teristics among mortality clusters were observed. In addi-tion, the comparison of mortality clusters before and after adjustment for societal characteristics quantitatively sup-ported these heterogeneity and homogeneity.
Conclusion
The combination of spatial analysis and investigation of the relationships between mortality and societal factors revealed areas in Japan with higher mortality rates and
their societal characteristics. The spatial clusters of colon and breast cancer showed homogeneous societal charac-teristics, with the exception of one cluster. However, the societal characteristics of clusters of lung cancer varied. The homogeneous characteristics of areas with higher mortality rates require strategies across the country or common between higher mortality areas, while exclusive clusters, such as those seen for colon and breast cancer, and variations in societal characteristics for lung cancer imply the need of strategies specific for selected areas with higher mortality.
Methods
Study unit and period
Local public entities in Japan are divided into two catego-ries: the first consists of municipalities (i.e., cities, towns and villages), while the second consists of prefectures. All districts in the country belong to one of the municipalities and fall within the boundaries of one of the prefectures. Tokyo prefecture (Tokyo Metropolis) includes 23 special wards ("ku") in addition to cities, towns and villages. Twelve large cities (cities designated by ordinance), such as Osaka and Nagoya, consist of wards ("ku"). In 1995, there were a total of 3372 municipalities (23 Tokyo spe-cial ward cities, 127 wards of 12 cities designated by ordinance, 651 cities, 1994 towns and 577 villages) nested within 47 prefectures [39].
The study was performed from 1993 to 1998 during which time several municipalities were annexed or divided, and therefore the aggregated data from these municipalities could not be used. Thus, the final number of municipalities analyzed in the present study was 3360.
Mortality calculation
In this study, we examined the mortality rates of three high priority cancers: male lung and colon cancer and female breast cancer. Lung and colon cancer were the first and fourth leading causes of cancer death, respectively, in men, and breast cancer was the fourth one in women in the Japanese population in 1995 [20]. The rates of colon and breast cancer have both increased steadily over the last several decades in Japan. Classification was based on the 9th and 10th versions of the International Classifica-tion of Diseases (ICD-9 in 1993–94 and ICD-10 in 1995 to 1998): colon cancer, ICD-9 153–154 and ICD-10 C18-C21; lung cancer, ICD-9 162 and ICD-10 C33-C34; and breast cancer, ICD-9 174 and ICD-10 C50 [40,41].
influ-ence of the Hanshin-Awaji earthquake [14]. Total number of deaths during 5 years was 57,109 for colon cancer, 101,515 for lung cancer, and 32,290 breast cancer. The nationwide age-and cause-specific mortality rates and census municipal age-specific population in 1995 were used as data sources [42]. The aggregated data using mac-rofiles of the vital statistics were drawn from a database of previous studies [14].
Municipal SMR was calculated and disease mapping was drawn. For calculation of SMR, the hierarchical Poisson regression analysis [13,14,43] was applied since this anal-ysis could correct the unstability in mortality due to heter-ogeneity of population size: there was marked variation in the population size among municipalities, ranging from a few hundred to a few hundred thousand, and municipal-ities with a small population showed statistical fluctua-tion in mortality. The secondary medical care zone (SMCZ), which is defined by prefectural governments for medical care planning according to the Medical Service Law, was used as a higher level. There were 344 SMCZs across Japan in 1995, each of which consisted of neigh-bouring municipalities and covered a population of 300,000 on average. Bayesian standardized mortality ratio of municipalities was estimated using the iterative gener-alized least squares (IGLS) and the Markov chain Monte Carlo method [44]. Relative risks (RRs) of societal indices, population density, and societal clusters for cancer moral-ity were estimated using the hierarchical Poisson regres-sion with IGLS. In addition to crude RRs, societal and population density were included in the model to estimate adjusted RRs. For societal clusters, SC1 was used as the reference category. The details of hierarchical Pois-son regression are described in previous studies [13,14,44]
Mortality clusters: spatial scan statistic
The spatial scan statistic was used to detect and evaluate the statistical significance of spatial clusters. The details of the spatial scan statistic were reported previously [4-6,36] and SaTScan ver. 4.0.3 http://www.satscan.org was used for the analysis. The numbers of deaths in each municipal-ity were modelled as Poisson distributions. Under the null hypothesis, the expected number of deaths calculated using age-specific national mortality rates and the age-spe-cific municipal population from the 1995 census [42] was proportional to the indirectly age-adjusted population at risk. An infinite number of circles were superimposed on the map, using the municipal centroid as the centre. The municipal centroid (latitude and longitude) was com-puted with the map of Japan (geographic coordinate system, GRS 1980; http://www.esrij.com) using ArcGIS 8.3 (ESRI Japan, Tokyo). The radii of the circles were set to vary continuously from zero to a maximum including at most 10% of the total population at risk, to obtain a
cer-tain number of potential clusters. The data for an entire circle contained different sets of neighbouring municipal-ities, and each circle represented a potential mortality cluster. For each circle, the likelihood was calculated for observing the number of deaths occurring within that cir-cle, and the circle with the maximum likelihood was taken as the primary cluster. The distribution of maximum like-lihood under the null hypothesis was evaluated using the Monte Carlo hypothesis testing set with 999 simulations. In addition to the primary cluster, the spatial scan statistic identified the secondary clusters, and ordered them according to the likelihood ratio test statistics. In the present study, secondary clusters were identified using no geographical overlap procedure and those with p-values of less than 0.05 were significant. Mortality clusters were mapped using ArcGIS 8.3 (ESRI, Japan).
Societal clusters
Based on the findings of previous studies [13,15,31], seven socioeconomic indicators were chosen as potential factors related to mortality (Table 1). These indicators were obtained and calculated using the System of Social and Demographic Statistics consisting of governmental statistics including mainly census data [42]. Unemploy-ment rate reflected the percentage of unemployed persons aged 15–65 years in the total workforce. Educational level reflected the age-adjusted educational level, using the per-centage of those who had graduated from college or a higher level among the population aged 20 and over, and was standardised by nationwide sex-and age-specific pop-ulations as for standardisation of age-adjusted mortality rate. Income per capita was calculated by aggregating the annual taxable income per household by municipality, and dividing it by the total municipal population.
To reduce the number of variables and identify dimen-sional societal factors, the principal component analysis with correlation matrix analysis and varimax rotation was performed. The principle components for which the cor-relation matrix eigenvalues were more than 1.0 were selected as significant dimensions. The component score for the extracted component was assigned to municipali-ties as a composite societal index: consequently two indi-ces were obtained as shown in Table 1. Then, municipalities were classified into four societal clusters using the K-means cluster analysis with two societal indi-ces and population density (log-transformed). The princi-ple component analysis and the cluster analysis were performed using SPSS 11.0 (SPSS Inc., Chicago, IL, USA).
Relationships between mortality clusters and societal clusters
were examined by the cross-tabular analysis of mortality clusters and societal clusters.
Furthermore, cluster detections with the spatial scan sta-tistic were performed adjusting for societal indices and population density or societal clusters to determine whether mortality clusters would change before and after adjustment for these variables. The risks of municipalities were calculated using RRs from the hierarchical Poisson regression and used as the adjustment file in the spatial scan statistic [29,44].
Authors' contributions
YF designed the study, analyzed the data, and drafted the article. MU designed the study and interpreted the results. KN helped to interpret the results and edited the draft. TT supervised the data analysis and writing article.
Acknowledgements
This research was supported by Grant-in-Aid for Scientific Researches by the Japan Society for the Promotion of Science (Grant No. 14570326 and 16590497).
References
1. Cromley EK, McLafferty SL: GIS and public health New York. Guilford Press; 2002.
2. Ellioitt P, Wakefield JC, Best NG, Briggs DJ: Spatial epidemiology New York: Oxford University Press; 2000.
3. Rosenberg MS, Sokal RR, Oden NL, DiGiovann D: Spatial autocor-relation of cancer in Western Europe. Eur J Epidemiol 1999,
15:15-22.
4. Kulldorff M, Feuer EJ, Miller BA, Freedman LS: Breast cancer clus-ters in the northeast United States: a geographic analysis.
Am J Epidemiol 1997, 146:161-170.
5. Green C, Hoppa RD, Young TK, Blanchard JF: Geographic analysis of diabetes prevalence in an urban area. Soc Sci Med 2003,
57:551-560.
6. Jemal A, Kulldorff M, Devesa SS, Hayes RB, Fraumeni F: A geo-graphic analysis of prostate cancer mortality in the United States, 1970–89. Int J Cancer 2002, 101:168-174.
7. Diez Roux AV, Schwartz S, Susser E: Ecological variables, ecolog-ical studies, and multilevel studies in public health research.
In Oxford textbook of public health Edited by: Detels R, McEwen J, Bea-glehole R, Tanaka H. New York: Oxford University Press; 2002:493-507.
8. Morgentern H: Ecological study. In Modern epidemiology Edited by: Rothman KJ, Greenland S. Philadelphia: Lippincott Williams & Wilkins; 1998:459-480.
9. Uehara M, Takahashi M, Hoshuyama T, Pan G, Feng Y: Geographical correlation between ambient UVB level and mortality risk of leukemia in Japan. Environ Res 2003, 92:78-84.
10. Tominaga S, Kuroishi T: An ecological study on diet/nutrition and cancer in Japan. Int J Cancer 1997, Suppl 10:2-6.
11. Aihara H, Iki M: An ecological study of the relations between the recent high suicide rates and economic and demographic factors in Japan. J Epidemiol 2003, 13:A56-61.
12. Nagata C: Ecological study of the association between soy product intake and mortality from cancer and heart disease in Japan. Int J Epidemiol 2000, 29:832-836.
13. Fukuda Y, Nakamura K, Takano T: Municipal socioeconomic sta-tus and mortality in Japan: sex and age difference, and trends of 1973–1998. Soc Sci Med 2004, 59:2435-2445.
14. Fukuda Y, Nakamura K, Takano T: Cause-specific mortality dif-ferences across socioeconomic position of municipalities in Japan, 1973 to 1998: increased importance of injury and sui-cide to inequality for ages under 75. Int J Epidemiol 2005,
34:100-109.
15. Fukuda Y, Nakamura K, Takano T: Wide range of socioeconomic factors associated with mortality among cities in Japan.
Health Promot Int 2004, 19:177-187.
16. Kanda A, Ojima T, Miura Y, et al.: Prefectural variation in alcohol consumption, smoking, physical exercise, and obesity and the trend. Koseino Shihyo 2002, 49(15):7-15.
17. Fukuda Y, Nakamura K, Takano T: Socioeconomic pattern of smoking in Japan: income inequality and gender and age differences. Ann Epidemiol 2005, 15:365-372.
18. Asahi S, Watanabe M, Tajimi M, et al.: Relationships between pre-fectural smoking and alcohol consumption rates and cause-specific mortality. Koseino Shihyo 2003, 50(1):1-7.
19. Health and Welfare Statitics Association: Kokumin ensei no doko
Tokyo: Health and Welfare Statistics Association; 2002.
20. Colditz GA, Atwood KA, Emmons K, et al.: Harvard report on cancer prevention volume 4: Harvard Cancer Risk Index.
Cancer Causes Control 2000, 11:477-488.
21. Wakai K, Ohno Y, Genka K, et al.: Smoking habits, local brand cigarettes and lung cancer risk in Okinawa, Japan. J Epidemiol
1999, 7:99-105.
22. Nakazato I, Hirayasu T, Kamada Y, Tsuhako K, Iwamasa T: Carci-noma of the lung in Okinawa, Japan: with special reference to squamous cell carcinoma and squamous metaplasia.
Pathology International 1997, 47:659-672.
23. Fukuda Y, Nakamura K, Takano T: Accumulation of health risk behaviors is associated with lower socioeconomic status and women's urban residence: a multilevel analysis in Japan. BMC Public Health 2005, 5:53.
24. Fukuda Y, Nakamura K, Takano T: Reduced likelihood of cancer screening among women in urban areas and with low socio-economic status: a multilevel analysis in Japan. Public Health in press.
25. Wakefield JC, Kelsall JE, Morris SE: Clustering, cluster detection, and spatial variation in risk. In Spatial Epidemiology Edited by: Elliot P, Wakefield JC, Best NG, Briggs DJ. NY: Oxford University Press; 2000:128-152.
26. Waller LA, Gotway CA: Spatial clustering of health events: regional count data. In Applied Spatial Statistics for Public Health Data New Jersey: John Wiley & Sons; 2004:200-271.
27. Tango T, Takahashi K: A flexibly shaped spatial scan statistic for detecting clusters. Int J Health Geogr 2005, 4:11.
28. Buntinx F, Gey H, Lousbergh D, et al.: Geographical differences in cancer incidence in the Belgian province of Limburg. Eur J Cancer 2003, 39:2058-2072.
29. Sheehan TJ, DeChelo LM, Kulldorff M, Gregorio DI, Gershman S, Mroszczyk M: The geographic distribution of breast cancer incidence in Massachusetts 1988 to adjusted for covariates.
Int J Health Geogr 2004, 3:17.
30. Kulldorff M, Nagarwalla N: Spatial disease clusters: detection and inference. Stat Med 1995, 14:799-810.
31. Takano T, Nakamura K: An analysis of health levels and various indicators of urban environments for Healthy Cities projects. J Epidemiol Community Health 2001, 55:263-270. 32. Krieger N, Chen JT, Waterman PD, Soobader MJ, Subramanian SV,
Carson R: Geocoding and monitoring of US socioeconomic inequalities in mortality and cancer incidence: does the choice of area-based measure and geographic level matter?; The Public Health Disparities Geocoding Project. Am J Epidemiol 2002, 156:471-482.
33. House JM, Lepkowski JM, Williams DR, et al.: Excess mortality among urban residents: how much, for whom, and why? Am J Public Health 2000, 90:1898-1904.
34. Morris R, Carstairs V: Which deprivation? A comparison of selected deprivation indexes. J Public Health Med 1991,
13:318-326.
35. Armitage P, Berrry G, Matthews JNS: Mutivariate methods. In
Statitical Methods in Medical Research Oxford: Blackwell Sceince; 2002:455-484.
36. Kachigan SK: Factor analysis. In Multvariate Statitical Analysis New York: Radium; 1991:236-260.
37. Folwell K: Single measures of deprivation. J Epidemiol Community Health 1995, 49:S51-S56.
Publish with BioMed Central and every scientist can read your work free of charge
"BioMed Central will be the most significant development for disseminating the results of biomedical researc h in our lifetime."
Sir Paul Nurse, Cancer Research UK
Your research papers will be:
available free of charge to the entire biomedical community
peer reviewed and published immediately upon acceptance
cited in PubMed and archived on PubMed Central
yours — you keep the copyright
Submit your manuscript here:
http://www.biomedcentral.com/info/publishing_adv.asp
BioMedcentral 39. Society for self-government of municipalities: Municipal handbook
Tokyo: Daiichi Hoki; 2000.
40. Ministry of Health and Welfare: Vital statistics 1994 Tokyo: Health and Welfare Statistics Association; 1997.
41. Ministry of Health, Labour, and Welfare: Vital statistics 1995 Tokyo: Health and Welfare Statistics Association; 1997.
42. Statistics Bureau, Management and Coordination Agency: System of socioeconomic and demographic statistics Tokyo: Statistical Information Institute for Consulting and Analysis; 2000.
43. Leyland AH, McLeod A: Mortality in England and Wales, 1979–1992
Glasgow: MRC Social & Public Health Sciences Unit; 2000. 44. Rasbash J, Browne W, Goldstein H, et al.: A user's guide to MLwiN