Copyright © The Author(s). All Rights Reserved. Published by American Research Institute for Policy Development DOI: 10.15640/jmpp.v7n1a3 URL: https://doi.org/10.15640/jmpp.v7n1a3
The Impact of Race, Ethnicity and Gender on Investor Stock Risk Behavior: Implications
for Invest Managers
J. R. Smith
1, Andrea Tillman-Hawkins
2, Alisa L. Mosley
3& Jean-Claude Assad
4Abstract
An event study methodology for different time periods were employed to discern to what extent, if any, race, ethnicity and gender impact stock prices to determine firm performance. The research question was addressed from the perspective of investors stock risk behavior. Study findings utilizing multiple regression techniques revealed significant mixed results with respect to a cultural diverse workforce and firm performance. Research voids, gaps, priorities and avenues for future research were advanced.
Keywords: cultural diversity, gender diversity, firm stock performance, stock values, stock risks, Racio-ethnicity.
Introduction
Corporate firms domestically and internationally are continuously including in their mission statement the thrust for a diverse work force. Not only is it morally and ethically sound, it is the right thing to do and good business practices toward perpetuating positive organization performance from the perspective of investors stock risks (e.g. Awais, Rasheed & Khursheed, 2016; Baker, 2016; Barber, Yassaman & Thomas, 2016; Betul & Lambkin, 2017; Billett, Jiangb & Regoa, 2014; Bolla, Kohler & Wittig, 2016; Bonaparte, Bazley, Korniotis & Kumar, 2017; Brown, 2007; Korstanji, 2017; Noussair, Trautmann & Van De Kuilen; 2014; Pandey, Sharma & Mittal, 2013; & Strang, 2017.
Pisani (2017) succinctly notes that the biggest problem right now is that investor stock risks are negligible because stocks are so expensive that buying enthusiasm is very muted [emphasis added]. He goes on to identify geopolitical, weaker economic data, the high valuation of the stock market and the risk from disappointing earnings and fiscal reforms pushed out as the four main risks presently associated with investor stock risks. In a thorough editorial preface critiquing articles in the International Journal of Risk and Contingency Management, Volume 6, Issue 3, Strang (2017) put the nail in the coffin addressing the topic ―How Businesses Make Profit and How They Mitigate Their Risks. Of course, their mission statement must be inclusive of maintaining a diverse workforce with hopes of stock prices being indicative of firm performance with respect to investors stock risks behavior.
The corporate market share and stock portfolio management literature is in its infancy stage and has sparsely produced empirical data based studies addressing the extent stock prices and investors stock risk cultural diversity contribute toward organizational performance (Apfelbaum, Bartelt, Bernard, Levine, Massey, Stark & Zajac, 2014; Breda & Manning 2017; Chan, Lik, Lin, & Lin 2016, 2017; Chapple & Humphrey 2014; Frijns,Dodd & Cimerova. 2016; Lee & Kim 2010; & Roberson & Park, 2007). Findings have often been inconclusive and contradictory.
1 Jackson State University, College of Business, Department of Business Administration, Jackson, MS, USA, [email protected]
2 Chairperson &Associate Professor of Management, Alabama A & M University, College of Business & Public Affairs,
Department of Management and Marketing, Huntsville, AL, USA, [email protected]
3 Vice President Academic Affairs, Tennessee State University, Office of the Provost, Nashville, TN, USA, [email protected]
4 Associate Professor of Economics, Jackson State University, College of Business, Department of Business Administration,
The influx of minorities and women as new entrants into the workforce necessitated empirical research on how firm performance might be affected by the changing workplace demographics. As workplace diversity increased, managers sought to harness employees’ diverse perspectives, eliminate conflicts, and enhance corporate performance. (Cook & Glass, 2009b, 2011; Dezso & Ross, 2012; Gul, Srinidhi & Ng, 2011; Gundemir, Dovidio, Homan & De Dreu 2016; Johnson & Heckman, 2016; Apfelbaum, 2016; & Stamarski and Hing, 2015). Empirical data based research studies are much needed and ongoing to discern to what extent a culturally diverse workforce contributes to organizational performance.
(Alison, 2011; Buckingham, 2010; Chapple & Humphrey, 2014; Frijns, Dodd & Cimerova, 2016; & Roberson & Park, 2007). However, these studies have often yielded contradictory and inconclusive findings.
Research Problem
This study will investigate the impact of cultural diversity on firm stock performance. The effect of racio-ethnicity and gender diversity on firm performance from the external perspective of shareholders (i.e., investors) was examined in this study. More specifically, this study was conducted to determine how investors responded to the cultural diversity activities of the firm through the change in firm stock values. Hence, the major research questions are: 1. Do the components of cultural diversity (i.e., racio-ethnicity and gender diversity) have an impact on firm performance? 2. Does gender diversity or racio-ethnicity have an influence on firm performance? 3. Do stock values respond differently to cultural diversity announcements on the day of the announcement and during the post-announcement periods?
Literature Review
3.1 Diversity in Organizations 3.1.1 Perspectives on Diversity
Different people viewed diversity differently, resulting in numerous perspectives and conflicting responses (Cox & Blake 1991; Dass & Parker, 1999; Milliken & Martins, 1996). Over the years, diversity had been described in a number of ways. Sims (1994) considered diversity to be ―the full participation of a diverse population within a particular system,‖ synonymous with pluralism and multiculturalism (p. 2). Cox (1994) defined it as ―the representation of people, in one social system, with distinctly different group affiliations of cultural significance‖ (p. 6). Gilbert and Ivancevich (2000) suggested that diversity referred to ―the inclusion of all groups at all levels in the company‖ (p. 218). Others attempted to define it broadly, as encompassing any characteristic that differentiated one person from another including, ―gender, race, age, physical ability, sexual orientation, religion, skills, and [organizational] tenure‖ (Joplin & Daus, 1997, p. 218); and racio-ethnicity, qualities, attitudes, perspectives, and backgrounds (Robinson & Dechant, 1997).
3.1.2 Cultural Diversity in Organizations
Cultural diversity encompassed the differences associated with the racio-ethnicity and gender of the workforce. This section discussed cultural diversity in organizations as a competitive advantage and examined how it affected individual performances and group outcomes.
Competitive Advantage. Richard (2000) revealed that racial diversity provides a competitive advantage to firms
during periods of business growth. He reasoned that ―cultural diversity in human capital serves as a source of sustained competitive advantage because it creates value that is both difficult to imitate and rare‖ (p. 165). Richard noted that the background, experiences, and knowledge of an individual would be hard to replace. Although different people had similar qualifications, their contributions seemed to differ because of their individual characteristics.
Kirby and Richard (2000) found that employees considered the problem-solving and resource-acquisition arguments to be the most compelling reasons for organizations to implement diversity programs. The cost-reduction argument was the least preferred argument; it advocated that diversity reduces the costs associated with turnover, absenteeism, and low productivity.
Diversity research expanded to incorporate inherent and acquired diversity. Inherent diversity referred to those characteristics that are beyond the control of the individual such as race, ethnicity, gender, (Cox, 1994; Richard, 2000; Wright et al., 1995), disabilities (Murrell, Dietz-Uhler, Dovidio, Gaertner & Drout, 1994), age (Barnum, Liden & Ditomaso, 1995), and personality (Barsade, Ward, Turner, & Sonnenfeld, 2000).
Acquired diversity referred to those characteristics that were achieved or selected by an individual including education, experience, job function, and tenure (Gilbert & Ivancevich, 2000; Joplin & Daus, 1997; Robinson & Dechant, 1997). This research study concentrated on how the inherent diversity characteristics of racio-ethnicity and gender impact firm performance.
Cultural Diversity and Firm Performance
The relationship between cultural diversity and firm performance has been studied; however, a consistent connection between these two variables has not yet been established. Litz and Folker (2002) studied the gender-balance between men and women in management teams in the retail industry. Industry productivity measures and net profit margin were used to measure firm performance. The findings indicated that gender diversity correlated with superior performance and high profit returns.
Ng and Tung (1998) addressed the relationship in a field study which focused on the Canadian banking industry. Culturally heterogeneous groups were those with a mixture of Chinese, East Indians, Caucasians, other Asians, and Aboriginals. Culturally homogeneous groups were those with a majority of Caucasians or Asians. Firm performance was measured using productivity, profitability, and profitability growth rate. The researchers concluded that culturally diverse work teams attained higher rates of profitability and productivity (i.e., revenues per full-time employee) than the culturally homogenous work teams.
Hartenian and Gudmunson (2000) examined whether cultural diversity relationship in the service sector had an influence on firm performance as measured by revenue, net income, and owner/CEO income. They found that workforce diversity contributed to high percentage increases in revenue and suggested that firms with diverse workforces outperformed firms with more demographically homogenous workforces. This study’s approach to the relationship between cultural diversity and firm performance differed from the previously mentioned studies in that firm performance was measured by the change in stock values, and thus, provided insight into how the investors responded to the cultural diversity activities of the firm.
Wright et al. (1995) performed a similar study to address the relationship between racial diversity and firm performance. Racial diversity was operationalized by Department of Labor (DOL) awards for affirmative action and discrimination lawsuit settlements. An event study was performed to determine how the announcements of these firm-specific events impacted firm performance as measured by the change in stock values. The findings indicated that investors responded positively to the DOL awards for affirmative action and negatively to the discrimination lawsuit settlements. This study focuses on the positive announcements of racio-ethnicity and gender diversity and how the investors responded to those announcements.
Research Factors and Hypothesized Relationships
Racio-ethnicity was operationalized by referring to the Fortune’s ―50 Best Companies for Minorities,‖ a listing of firms that provide the best environments for minorities. Gender diversity was operationalized by firms being ranked on the Fortune’s list of ―50 Powerful Women‖ and Working Mothers’ list of ―100 Best Companies for Working Mothers‖ according to the flexibility of their organizational environments in support of working mothers.
relationship between cultural diversity and firm performance was a relationship between the public statements of corporate events related to cultural diversity and the resulting impact on stock values.
Hypotheses
H1 There is no relationship between racio-ethnicity and firm performance.
Hypothesis 1 was tested using the event study methodology and multiple regression analysis. First, an event study was performed using the t test to determine whether the cultural diversity announcement related to racio-ethnicity had any impact on firm stock values.
A multiple regression analysis was performed to assess how racio-ethnicity influenced firm performance. Racio-ethnicity was operationalized through the racio-ethnic groups of Asians, Blacks/African Americans, Hispanics, and Native Americans. The relationship between each racio-ethnic group and firm performance was measured. To test Hypothesis 1, racio-ethnic groups were divided into four testable sub-hypotheses using multiple regression analysis:
H1a There is no relationship between the percentage of Asians in the firm and its performance.
H1b There is no relationship between the percentage of Blacks/African Americans in the firm and its performance. H1c There is no relationship between the percentage of Hispanics in the firm and its performance.
H1d There is no relationship between the percentage of Native Americans in the firm and its performance.
H2 There is no relationship between gender diversity and firm performance.
Hypothesis 2 was tested using the event study methodology and regression analysis. The event study was performed using the t test to determine whether the cultural diversity announcement related to gender had any impact on firm stock values. The regression analysis was performed to assess whether gender diversity influenced firm performance.
H3 There are no differences between the influence of racio-ethnicity and gender diversity on firm performance. Hypothesis 3 was tested by comparing the results of the event studies and regression analyses performed on the cultural diversity announcements of racio-ethnicity and gender diversity in H1 and H2. The impact of each announcement on the percentage change in stock values was compared in an effort to determine which component of cultural diversity had more of an influence on firm performance.
H4 There are no differences between how stock values will respond to cultural diversity announcements on the day of the announcement and during the post-announcement period. Hypothesis 4 was tested using the event study methodology, which was performed using a t test. The influence of the cultural diversity announcements on firm stock values was determined for the day of the announcement and then observed during the post-announcement period of 10 days to determine whether the impact was sustained.
Methodology
Stock values were used to test the hypothesized relationships between the components of cultural diversity i.e., racio-ethnicity and gender impact on firm performance using, an event study methodology with regression analysis techniques. The sample source of data and the data collection procedures followed by the development of the conceptual statistical model are presented to analyze the data and address the study questions posed and discern whether study hypotheses and sub hypotheses are rejected or supported .
7.1 Sample
Three different data sources were utilized to investigate the relationship between cultural diversity and firm performance. The information regarding the independent variables was collected from announcements printed in the
Fortune and Working Mother magazines. Information collected on racio-ethnicity was obtained from Fortune.
Information collected on gender diversity was obtained from Fortune and Working Mother. Each list was published annually from 1998 to 2003. Firm performance information was obtained from The Wall Street Journal (1998-2003),
the Standard and Poor’s Daily Stock Price Record for the New York Stock Exchange (NYSE) and the American Stock
Racio-ethnicity was measured by the percentage breakdowns of Blacks/African Americans, Hispanics, Asians, and Native Americans for those firms that appeared on the Fortune list of the ―50 Best Companies for Minorities‖ (Chen, Hickman, LeBlanc,Vanderkam, & Vella-Zarb, 2000; Esposito, Garman, Hickman, Watson & Wheat, 2001; Hickman, 2002; Hickman, Tkaczyk, Florian, Stemple & Vazquez, 2003; Robinson & Hickman, 1999; Urresta & Hickman, 1998). The publication of the list constituted a firm-specific announcement of racio-ethnicity.
An annual analysis was conducted using the announcements made from 1998 to 2003. The percentage breakdown per racio-ethnic group was used to compare the correlation of each individual group on firm performance. The annual rankings for racio-ethnicity were presented by the Fortune list of the 50 best companies for minorities from 1998 to 2003.
Gender diversity was measured by the announcement of women in high-powered executive positions in corporate America and the percentage of women in the firm workforce for the years of 1998 to 2003. The fifty most powerful women in American businesses were ranked each year in Fortune’s ―50 Powerful Women‖ (Folpe, 1999; Grainger, Tkaczyk, & Wheat, 2000; Harrington et al., 2001; Sellers, 1998; Sellers, Harrington, & Shanley, 2003; Wheat & Shuerman, 2002).
The Fortune lists highlighted the scope of each executive’s power and influence and not the powerful influence
of their corporate employers per se. This sample included firms that appeared at least once on that list and were publicly traded on the NYSE, the AMEX or the NASDAQ from 1998 to 2003. For some firms, the list included two or more women serving as senior executives in different departments or subsidiaries. To control for this firm duplication, two analyses were performed for that specific year. The first analysis included individual firms represented by one executive. A second analysis was performed on those firms represented by two or more executives. The total number of firms included in this sample was 108.
The percentages of women in the workforce were presented annually in the Working Mother list of ―100 Best Companies for Working Mothers‖ (―100 Best Companies,‖ 2002 & 2003; Cartwright, 1999; ―Rating the 100,‖ 2000 & 2001; Wilburn, 1998). The Working Mother lists ranked firms according to the flexibility of their environments for working mothers. The companies in this sample appeared at least once on this list during the study period (1998 to 2003) and were publicly traded on the NYSE, AMEX or NASDAQ. The sample size was 332.
Firm performance was measured by the percentage change in firm stock value. Stock value referred to the ―market price of a firm’s common stock‖ or the stock price (McGuigan, Moyer, & Harris, 2002, p. 8). ―A firm’s stock price [was] the tangible measure of shareholder wealth‖ and was influenced by both external and internal factors (p.13). The stock data for each corporation were collected using the closing stock quotes published daily in The Wall
Street Journal (1998-2003), Standard and Poor’s Daily Stock Price Record (1998-2003), and the online historical stock
database provided by Yahoo!Finance. Companies were eliminated from the study for several reasons: (a) data for the racio-ethnicity breakdown were unavailable, (b) stocks were not publicly traded on the NYSE, the AMEX or the NASDAQ, and (c) the stocks were not consistently reported during the study period. The number of companies included in the racio-ethnicity analysis ranged from 40 companies in 2000 to 44 companies in 2003. The gender analysis included 49 to 61 companies each year.
Changes in stock values were analyzed in this study to assess the change in firm performance in relation to the cultural diversity announcements. The assumption was that the percentage change in stock values following an announcement indicated the degree to which firm performance was influenced by cultural diversity. The stock values for the firms identified by each cultural diversity announcement were examined on the day of the announcement and over a pre- and post-announcement period of 30 days each.
Time Effects
The Model
The model was based on the Capital Asset Pricing Model (CAPM). It was used to determine whether cultural diversity in the workforce influences firm performance, which was measured by the change in stock values.
Capital Asset Pricing Model.
The CAPM was used to quantify the relationship between the risk and the expected return of an individual stock or a portfolio of stocks from the perspective of the investor (Fabozzi & Modigliani, 2003). Shareholders invested in a firm’s stock based on the ―present value of all future cash returns [wealth] expected to be generated by the firm for the benefit of its owners‖ (p.3). There was a tradeoff between the amount of risk and the expected return on the investment. In general, the higher investment risk should result in a higher rate of return.
Proposed Conceptual Model
The relationship between cultural diversity and firm performance was analyzed in this study in three phases. In the first phase of the analysis, event studies were performed in an effort to determine the impact of announcements of cultural diversity on firm performance, as measured by the percentage change in stock values. In the second phase of the analysis, the relationship between racio-ethnicity and firm performance was examined. In the third phase, the gender-performance relationship was explored.
The relationship between dimensions of cultural diversity and firm stock values after an announcement of diversity activities was investigated in this study.. Cultural diversity announcements referred to firm-specific announcements related to women and minorities. In the proposed model, the unsystematic risk (ε) was associated with the cultural diversity announcements. The following general equation (1.1) indicated that the expected stock return was a function of the systematic (market) and unsystematic (firm) factors:
Expected return = f (Systematic factors, Unsystematic factors), or E(Rd) = f (SM, UCD ), where
E(Rd) = the expected daily rate of return for the stock, (1.1) SM = the systematic market factors, and
UCD = the unsystematic factors associated with cultural diversity.
The data used for this study were cross-sectional in nature and thus, rendered it somewhat impossible to test the influence of systematic factors. Therefore, a separate test was conducted to analyze the relationship between the variations in the market indices and the variations in the stock values of the selected firms. Given the aforementioned limitation, testing the model focused primarily on the unsystematic components of the CAPM model. For the purpose of this study, the unsystematic factors were characterized by the diversity composition of the firms’ workforce.
Similar to Wright et al. (1995), this study measured the relationship between the announcements of cultural diversity and stock values using the event study approach. The study took a multi-phase approach to analyzing this relationship. In phase 1, the stock values before the announcement were compared with the stock values after the announcement. The change in stock values were analyzed to determine whether the cultural diversity announcements influence the firm stock values (Hypotheses 1, 2, 4) and then to specify which component of cultural diversity (i.e., racio-ethnicity, gender) had more of an influence on firm performance (Hypothesis 3).
Phases 2 and 3 utilized regression analysis to estimate the diversity-performance relationship with racio-ethnicity and gender, respectively. Similarly, regression analysis was used in the Carter, Simkins and Simpson (2003) study to link the proportion of women and minorities on corporate boards of directors to firm value. Multiple regression analysis was performed to estimate the influence of racio-ethnicity, which was operationalized through the racio-ethnic variables (i.e., Asians, Blacks/African Americans, Hispanics, and Native Americans), on firm performance (Hypothesis 1).
The proposed model was expressed in equation (1.2).
Yd = β0 + β1(M) + β2(A) + β3(B) + β4(H) + β5(NA) + ε, where (1.2) Yd = firm performance, the percentage change of the daily stock values, β0 = the beta constant,
B = the percentage of Blacks/African Americans in the workforce, H = the percentage of Hispanics in the workforce,
NA = the percentage of Native Americans in the workforce, and ε = the random error term.
Firm performance, as indicated above, comprised the percentage change in daily stock values, Yd, for each firm in the sample. ―The value of a share of stock [was] calculated as the present value of the stream of dividends the stock [was] expected to provide [to the investor] in the future‖ (Brigham, Gapenski, & Ehrhardt, 1999, p. 362). In finance literature, the stock price was typically computed according to equation (1.3) (Hirt & Block,1999):
P0 = D1/(1 + Ke)1 + D2/(1 + Ke)2 + … + Dn/(1 + Ke)n , where (1.3) P0 = present value of the stock price,
Dn = dividend for each year, and
Ke = required rate of return (discount rate).
The stock’s present value, P0, corresponded to the actual market price of a stock on any given day. The dividend, Dn, indicated the payout that the investor expected to receive at the end of each year. The required rate of return was the minimum return on a stock that was acceptable to the investor after taking into consideration the riskiness of the investment and the potential returns on other available investment opportunities (Brigham et al., 1999).
In this study, P0 was recorded as its published value—the daily stock price published in the newspaper. Thus, Yd was the percentage change of P0. The systematic return, M, which represented the expected return on the market portfolio for that day, was proxied using the S&P 500 index. The unsystematic returns were represented by racio-ethnic groups.
Due to data incompatibility between the systematic return (M) and the stock values (Yd), it was necessary to change the proposed model to address the problem. Specifically, the S&P 500 index (M) provided a single daily value during the study period. The daily stock data (Yd) were collected for several companies every day of the study period, resulting in numerous daily values. Because the daily market value was incompatible with the numerous daily stock values, the statistical package could not perform the analysis. Therefore, it was necessary to test the racio-ethnicity and the market variables in the proposed model separately. For this reason, two regression models were used for each component of cultural diversity in this study.
Racio-ethnicity Effect. The first regression model (1.4) was used to determine the relationship between
racio-ethnicity in the firm and firm performance. The racio-racio-ethnicity effect referred to the correlation that racio-racio-ethnicity had with firm performance before and after the cultural diversity announcement related to racio-ethnicity. Racio-ethnicity was measured by the percentage of the racio-ethnic groups participating in the firm workforce, as ranked by
Fortune as the best companies for minorities. Firm performance was measured by the percentage change in stock
values. Therefore, any difference in the relationship between the racio-ethnic groups and firm performance after the racio-ethnicity announcement pointed toward a racio-ethnicity effect. Equation 1.4 was used to test this relationship and was expressed as follows:
Yd = β0 + β1(A) + β2(B) + β3(H) + β4(NA) + ε, where
Yd = firm performance, the percentage change of the daily stock values,
β0 = the beta constant, (1.4)
A = the percentage of Asians in the firm,
B = the percentage of Blacks/African Americans in the firm, H = the percentage of Hispanics in the firm,
NA = the percentage of Native Americans in the firm, and ε = the random error term.
Racio-ethnicity Announcement Effect. The second regression model (1.5) was used to determine whether the
In this model, a dummy variable was used to determine the effect of the racio-ethnicity announcement. The post-announcement period was denoted by 1, and the pre-announcement period was denoted by 0. The data for the systematic market variable (M) were collected using the S&P 500 Index. To address the data incompatibility issue, the stock values for the companies included in the study were averaged each day of the study period, thus, creating a portfolio of the average daily stock values (Ypd). The stock portfolio provided one daily value, which was compatible with the single daily market value. Equation 1.5 was used to capture the impact of the racio-ethnicity announcement on the daily stock portfolio. It was expressed as follows:
Ypd = β0 + β1(D) + β2(M) + ε, where (1.5)
Ypd = average daily stock values of the portfolio of n companies β0 = the beta constant,
D = announcement period: 1 if post-announcement, 0 if pre-announcement, M = the expected return on the market portfolio for that day, and
ε = the random error term.
The relationship between gender diversity and firm performance was further assessed in phase 3 of the analysis. In addition to performing an event study related to the announcement of gender diversity, a regression analysis was performed.
The regression analysis ―predict[ed] or estimate[ed] the value of one variable corresponding to a given value of another variable‖ (Daniel & Terrell, 1995, p. 480). In this analysis, gender diversity was an independent variable and firm performance was the dependent variable. The proposed model was expressed in the following equation:
Yd = β0 + β1(M) + β2(W) + ε, where (1.6)
Yd = firm performance, the percentage change of the daily stock values, β0 = the beta constant,
M = the expected return on the market portfolio for that day, W = the percentage of women in the firm, and
ε = the random error term.
As mentioned in the previous section on racioethnicity and firm performance, data collected for the systematic return (M) and the company stock values (Yd), were incompatible. Therefore, it was necessary to test the variables in the proposed model separately. The two regression models used in this study were expressed in equations 1.7 and 1.8. The models were designed to determine the gender diversity effect (1.7) and the gender diversity announcement effect (1.8) on firm performance.
Gender Diversity Effect. The gender diversity effect referred to the relationship between the percentage of
women in the firm and firm performance. Equation 1.7 was used to test this relationship:
Yd = β0 + β1(W) + ε, where (1.7)
Yd = firm performance, the percentage change of the daily stock values, β0 = the beta constant,
W = the percentage of Women in the workforce, and ε = the random error term.
Gender Diversity Announcement Effect. The gender diversity announcement effect refers to the impact of the
gender diversity announcement on firm performance. A dummy variable was used to determine the effect of the gender diversity announcement. The post-announcement period was denoted by 1 and the pre-announcement period was denoted by 0. The data for the systematic market variable (M) were collected using the S&P 500 Index. To address the data incompatibility issue, the stock values for the companies included in the study (i.e., Working Mother) were averaged for each day of the study period, thus, creating a portfolio of the average stock values (Ypd). The stock portfolio provided one daily value, which was compatible with the daily market value.
The equation 1.8 was used to capture the impact of the gender diversity announcement on the daily stock portfolio. It was expressed as follows:
Ypd = β0 + β1(D) + β2(M) + ε, where (1.8) Ypd = average daily stock values of the portfolio of n companies
β0 = the beta constant,
ε = the random error term.
A regression analysis was performed in an attempt to estimate how gender diversity related to firm performance (Hypothesis 2). The percentage of women in the firm provided insight into the performance of firms with gender diversity. A year to year analysis was conducted to ascertain the influence of the gender diversity announcement on firm performance.
Results and Discussion
The relationship between racio-ethnicity and firm performance (i.e., the racio-ethnicity effect) was analyzed each year. The impact of the racio-ethnicity announcement on firm performance was examined using multiple regression analysis, with the racio-ethnic groups as the regressors (independent variables) on firm performance (dependent variable).
The racio-ethnicity announcement effect was assessed to determine whether racio-ethnicity influenced firm performance. The event study methodology was employed to determine how the racio-ethnicity announcement impacted firm performance. Announcement windows were used each year during the study period to analyze the racio-ethnicity-performance relationship. Each window included the pre-announcement period (-), the day of the announcement (0), and the post-announcement period (+). The announcement windows were described as the 3-day immediate response period (-1, 0, +1), the 21-day long-term analysis period (-10, 0, +10).
9.1 Racio-ethnicity/Firm Performance Regression Analysis Findings
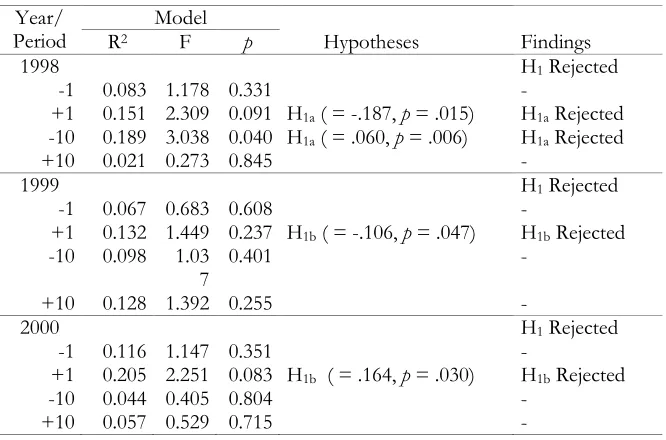
This study indicated that significant relationships existed between racio-ethnicity and firm performance. Hypothesis 1 stated that there is no relationship between racio-ethnicity and firm performance. To test Hypothesis 1, racio-ethnic groups were divided into four testable sub-hypotheses (Asians H1a, Blacks/African Americans H1b, Hispanics H1c, Native Americans H1d) using multiple regression analysis. Table 1 reveals that there were significant relationships between the racio-ethnic groups and firm performance during the pre-announcement and post-announcement periods, but neither of the relationships was consistent. This indicates partial support for Hypothesis 1 for every year of the study. However, a definite pattern was not established between racio-ethnicity and firm performance.
Table 1. Results of the Regression Analyses for Racio-ethnicity by Year
Year/
Period R2 Model F p Hypotheses Findings
1998 H1 Rejected
-1 0.083 1.178 0.331 -
+1 0.151 2.309 0.091 H1a ( = -.187, p = .015) H1a Rejected
-10 0.189 3.038 0.040 H1a ( = .060, p = .006) H1a Rejected
+10 0.021 0.273 0.845 -
1999 H1 Rejected
-1 0.067 0.683 0.608 -
+1 0.132 1.449 0.237 H1b ( = -.106, p = .047) H1b Rejected
-10 0.098 1.03
7 0.401 -
+10 0.128 1.392 0.255 -
2000 H1 Rejected
-1 0.116 1.147 0.351 -
+1 0.205 2.251 0.083 H1b ( = .164, p = .030) H1b Rejected
-10 0.044 0.405 0.804 -
2001 H1 Rejected
-1 0.027 0.267 0.897 -
+1 0.136 1.497 0.222 -
-10 0.207 2.485 0.060 H1c ( = .060, p = .009)
H1d ( = -.604, p = .030)
H1c Rejected
H1d Rejected
+10 0.261 3.348 0.019 H1a ( = -0.67, p = .014) H1a Rejected
2002 H1 Rejected
-1 0.291 3.891 0.010 H1a ( = .166, p = .008)
H1c ( = -.130, p = .009)
H1a Rejected
H1c Rejected
+1 0.098 1.029 0.405 -
-10 0.077 0.790 0.539 -
+10 0.116 1.245 0.308 -
2003 H1 Rejected
-1 0.160 1.859 0.137 H1a ( = -.119, p = .050) H1a Rejected
+1 0.122 1.361 0.265 -
-10 0.195 2.358 0.070 H1c ( = .034, p = .039) H1c Rejected
Note. - = Failed to reject
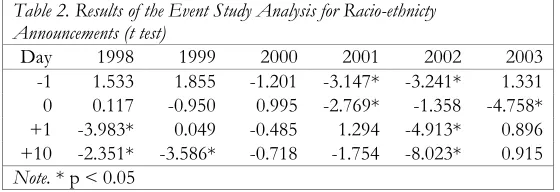
Event Study Findings
Hypothesis 1 was also tested using the event study methodology. A t test was performed to compare the stock
values before the racio-ethnicity announcement with the stock values after the announcement. Table 2 provides evidence that the racio-ethnicity announcements impacted firm performance throughout the study years. However, there was not enough evidence to establish a definite trend in the relationship between racio-ethnicity and firm performance. Overall, the analyses rejected Hypothesis 1.
Table 2. Results of the Event Study Analysis for Racio-ethnicty Announcements (t test)
Day 1998 1999 2000 2001 2002 2003
-1 1.533 1.855 -1.201 -3.147* -3.241* 1.331
0 0.117 -0.950 0.995 -2.769* -1.358 -4.758*
+1 -3.983* 0.049 -0.485 1.294 -4.913* 0.896
+10 -2.351* -3.586* -0.718 -1.754 -8.023* 0.915
Note. * p < 0.05
This statistical technique was used to test Hypothesis 4, which stated that there are no differences between how stock values will respond to cultural diversity announcements on the day of the announcement and during the post-announcement period. An overview of the event studies revealed that the racio-ethnicity post-announcements impacted firm performance throughout the study years on the day of the announcement and after the announcement. Therefore, Hypothesis 4 was rejected. Table 3 summarizes the findings for Hypotheses 1 and 4.
Table3: Summary of the Event Study Analyses for the Racio-ethnicity Announcements
Year H1 H4
1998 Rejected Rejected
1999 Rejected Rejected
2000 Failed Reject to Failed Reject to
2001 Rejected Rejected
2002 Rejected Rejected
2003 Rejected Rejected
Regression Analysis Findings
The relationship between gender diversity and firm performance was examined using the regression analysis and the event study methodology. Table 4 presents a summary of the findings of the regression analyses.
Although there were mixed findings relating to the gender diversity effect and the gender diversity announcement effect on firm performance, a relationship existed between gender diversity and firm performance throughout this analysis. Therefore, the analysis rejected Hypothesis 2, which stated that there is no relationship between gender diversity and firm performance, for the years of 1998, 1999, 2000, and 2003. The analysis failed to reject Hypothesis 2 for the 2001 and 2002 years of the study.
Table 4. Results of the Regression Analyses for Gender by Year
Year/
Period R2 Model F p Hypothesis Findings
1998 H2 Rejected
-1 0.033 1.774 0.189 -
+1 0.035 1.868 0.178 -
-10 0.000 0.010 0.921 -
+10 0.097 5.606 0.022 H2 ( = -.018, p = .022) H2 Rejected
1999 H2 Rejected
-1 0.096 6.070 0.017 H2 ( = .034, p = .017) H2 Rejected
+1 0.000 0.015 0.904 -
-10 0.058 3.495 0.067 -
+10 0.059 3.569 0.064 -
2000 H2 Rejected
-1 0.001 0.033 0.856 -
+1 0.007 0.376 0.542 -
-10 0.015 0.852 0.360 -
+10 0.152 9.848 0.003 H2 ( = .027, p = .003) H2 Rejected
2001 H2 Failed to Reject
-1 0.011 0.667 0.417 -
+1 0.031 2.001 0.162 -
-10 0.014 0.859 0.358 -
+10 0.042 2.740 0.103 -
2002 H2 Failed to Reject
-1 0.045 2.947 0.091 -
+1 0.005 0.289 0.593 -
-10 0.008 0.498 0.483 -
+10 0.054 3.568 0.064 -
2003 H2 Rejected
-1 0.012 0.705 0.405 -
+1 0.058 3.619 0.062 -
-10 0.124 8.325 0.005 H2 ( = -.011, p = .005) H2 Rejected +10 0.095 6.226 0.015 H2 ( = .008, p = .015) H2 Rejected
Note. - = Failed to reject
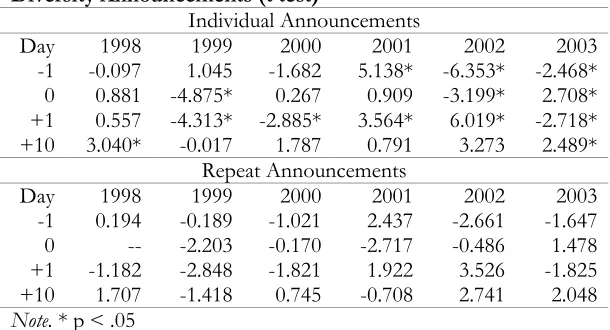
The event study methodology was utilized to determine whether the gender diversity announcements had an impact on firm performance, as measured by the percentage change in stock values. A t test was performed to compare the stock values before the gender diversity announcement with the stock values after the announcement.
The event studies were utilized to test Hypotheses 2 and 4. Hypothesis 2 stated that there is no relationship between gender diversity and firm performance. Hypothesis 4 stated that there are no differences between how stock values will respond to cultural diversity announcements on the day of the announcement and during the post-announcement period. In each year of the study, the Fortune ―50 Powerful Women‖ rankings included at least two executives employed by the same firm. Therefore, two analyses were performed for each year. The first event study was performed on those firms that were represented by one executive (i.e., individual companies). The second ―repeat‖ event study included the firms that were represented by two or more women executives (i.e., repeat companies).
Table 5 provides evidence that the gender diversity announcements impacted firm performance throughout the study years on the day of the announcement and after the announcement for the individual and repeat announcements.
Table 5. Results of the Event Study Analyses for Gender Diversity Announcements (t test)
Individual Announcements
Day 1998 1999 2000 2001 2002 2003
-1 -0.097 1.045 -1.682 5.138* -6.353* -2.468* 0 0.881 -4.875* 0.267 0.909 -3.199* 2.708* +1 0.557 -4.313* -2.885* 3.564* 6.019* -2.718* +10 3.040* -0.017 1.787 0.791 3.273 2.489*
Repeat Announcements
Day 1998 1999 2000 2001 2002 2003
-1 0.194 -0.189 -1.021 2.437 -2.661 -1.647 0 -- -2.203 -0.170 -2.717 -0.486 1.478 +1 -1.182 -2.848 -1.821 1.922 3.526 -1.825 +10 1.707 -1.418 0.745 -0.708 2.741 2.048
Note. * p < .05
Conclusion. The findings of the event studies are summarized in Table 6. Overall, there were mixed findings
for Hypothesis 2. The analyses yielded mixed results for four years of the study, suggesting that the influence of gender
diversity on firm performance varied during those years. The analyses for the remaining two years of the study indicated that there were significant influences of gender diversity on firm performance. Overall, the findings revealed that there is no significant pattern in the relationship between gender diversity and firm performance. Hypothesis 4 was rejected for every year of the study. The analyses revealed significant impacts of gender diversity announcements on firm performance throughout the study periods.
Table 6: Summary of the Event Study Analysis for the Gender Diversity Announcements
Individual Companies Repeat Companies
Year H2 H4 H2 H4
1998 Rejected Rejected Failed to Reject Failed to Reject 1999 Rejected Rejected Failed to Reject Failed to Reject 2000 Rejected Rejected Failed to Reject Rejected 2001 Rejected Rejected Failed to Reject Rejected 2002 Rejected Rejected Rejected Rejected 2003 Rejected Rejected Failed to Reject Rejected
The repeat analyses failed to reject Hypothesis 4 during the first two years of the study indicating insignificant impact of the gender diversity announcement on firm performance. Hypothesis 4 was rejected during the last four years of the study. This suggested that the gender diversity announcement had a significant impact on firm performance for those years.
9.4 Racio-ethnicity and Gender Diversity Compared
Comparative Analysis of Regression Analyses
The comparative analysis between the racio-ethnicity and gender diversity was conducted for the regression analyses and the event study analyses for each year of the study. This analysis was conducted to test Hypothesis 3, which stated that there are no differences between the influence of racio-ethnicity and gender diversity on firm performance.
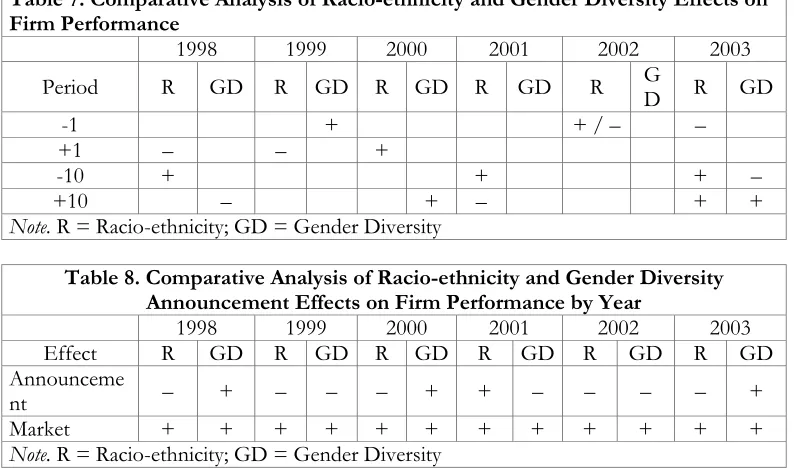
Although the racio-ethnicity and gender diversity analyses were performed using different data sources, it was the effects of the announcements of racio-ethnicity and gender diversity on firm performance that were compared in this analysis. Tables 7 and 8 summarize the comparative analysis of the racio-ethnicity and gender diversity regression analyses.
Table 7. Comparative Analysis of Racio-ethnicity and Gender Diversity Effects on Firm Performance
1998 1999 2000 2001 2002 2003
Period R GD R GD R GD R GD R GD R GD
-1 + + / – –
+1 – – +
-10 + + + –
+10 – + – + +
Note. R = Racio-ethnicity; GD = Gender Diversity
Table 8. Comparative Analysis of Racio-ethnicity and Gender Diversity Announcement Effects on Firm Performance by Year
1998 1999 2000 2001 2002 2003
Effect R GD R GD R GD R GD R GD R GD
Announceme
nt – + – – – + + – – – – +
Market + + + + + + + + + + + +
Note. R = Racio-ethnicity; GD = Gender Diversity
Racio-ethnicity and Gender Diversity Effects. The racio-ethnicity effect on firm performance was compared with the gender diversity effect on firm performance for each year of the study. For every year of the comparative analysis study, 1998-2003, Hypothesis 3 was rejected indicating that there were differences between the influence of racio-ethnicity and gender diversity on firm performance.
Racio-ethnicity and Gender Diversity Announcement Effects. The racio-ethnicity announcement effect was negative for the first three years of the study and positive for the last three years of the study. The gender diversity announcement effect was positive for the three years of the study (i.e., 1998, 2000 and 2003) and negative for the other years of the study (i.e., 1999, 2001 and 2002). In years 1999 and 2002, the racio-ethnicity and gender diversity announcement effects were negative. Thus, Hypothesis 3 was rejected, indicating that there were differences between the influence of racio-ethnicity and gender diversity announcements on firm performance for the years of 1998, 2000, 2001, and 2003. However, the analysis for 1999 and 2002 failed to reject Hypothesis 3 because there were no differences between the announcement effects of racio-ethnicity and gender diversity on firm performance for those years of the study.
Therefore, the comparative failed to reject Hypothesis 3, indicating that there were no differences between the influence of the market on firm performance after the racio-ethnicity and gender diversity announcements.
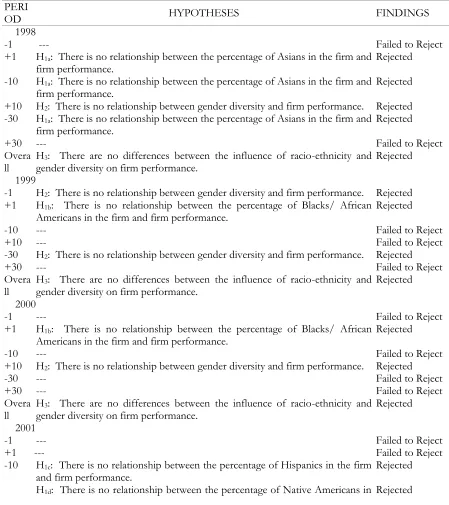
Conclusion. Overall, the comparison between the influence of racio-ethnicity and gender diversity on firm
performance yielded different results. Table 9 summarizes the results of the comparative analysis for the regression analyses. For every year of the study, a comparative analysis was performed on the regression results of the racio-ethnicity and gender diversity analyses. In the first three years of the study, racio-racio-ethnicity and gender diversity influenced firm performance during different study periods.
For example, in 1998, relationships between racio-ethnicity and firm performance were found during the +1, -10, and -30 study periods. In the +10 study period, there was a relationship between gender diversity and firm performance. During these years, there were differences between the influence of racio-ethnicity and gender diversity on firm performance. Thus, the comparative analysis rejected Hypothesis 3.
Table 9: Summary of the Comparative Analysis of the Effects of Racio-ethnicity and Gender Diversity on Firm Performance Using Regression Analysis
PERI
OD HYPOTHESES FINDINGS
1998
-1 --- Failed to Reject
+1 H1a: There is no relationship between the percentage of Asians in the firm and
firm performance. Rejected
-10 H1a: There is no relationship between the percentage of Asians in the firm and
firm performance. Rejected
+10 H2: There is no relationship between gender diversity and firm performance. Rejected -30 H1a: There is no relationship between the percentage of Asians in the firm and
firm performance. Rejected
+30 --- Failed to Reject
Overa
ll H3: There are no differences between the influence of racio-ethnicity and gender diversity on firm performance. Rejected 1999
-1 H2: There is no relationship between gender diversity and firm performance. Rejected +1 H1b: There is no relationship between the percentage of Blacks/ African
Americans in the firm and firm performance. Rejected
-10 --- Failed to Reject
+10 --- Failed to Reject
-30 H2: There is no relationship between gender diversity and firm performance. Rejected
+30 --- Failed to Reject
Overa
ll H3: There are no differences between the influence of racio-ethnicity and gender diversity on firm performance. Rejected 2000
-1 --- Failed to Reject
+1 H1b: There is no relationship between the percentage of Blacks/ African
Americans in the firm and firm performance. Rejected
-10 --- Failed to Reject
+10 H2: There is no relationship between gender diversity and firm performance. Rejected
-30 --- Failed to Reject
+30 --- Failed to Reject
Overa
ll H3: There are no differences between the influence of racio-ethnicity and gender diversity on firm performance. Rejected 2001
-1 --- Failed to Reject
+1 --- Failed to Reject
-10 H1c: There is no relationship between the percentage of Hispanics in the firm
and firm performance. Rejected
the firm and firm performance.
+10 H1a: There is no relationship between the percentage of Asians in the firm and
firm performance. Rejected
-30 H1b: There is no relationship between the percentage of Blacks/ African
Americans in the firm and firm performance. Rejected
+30 --- Failed to Reject
Overa
ll H3: There are no differences between the influence of racio-ethnicity and gender diversity on firm performance. Rejected 2002
-1 H1a: There is no relationship between the percentage of Asians in the firm and
firm performance. Rejected
H1c: There is no relationship between the percentage of Hispanics in the firm
and firm performance. Rejected
+1 --- Failed to Reject
-10 --- Failed to Reject
+10 --- Failed to Reject
-30 --- Failed to Reject
+30 --- Failed to Reject
Overa
ll H3: There are no differences between the influence of racio-ethnicity and gender diversity on firm performance. Rejected 2003
-1 H1a: There is no relationship between the percentage of Asians in the firm and
firm performance. Rejected
+1 --- Failed to Reject
-10 H1c: There is no relationship between the percentage of Hispanics in the firm
and firm performance. Rejected
H2: There is no relationship between gender diversity and firm performance. +10 H1a: There is no relationship between the percentage of Asians in the firm and
firm performance. Failed to Reject
H2: There is no relationship between gender diversity and firm performance. -30 H1c: There is no relationship between the percentage of Hispanics in the firm
and firm performance. Rejected
H2: There is no relationship between gender diversity and firm performance. +30 H1a: There is no relationship between the percentage of Asians in the firm and
firm performance. Failed to Reject
H2: There is no relationship between gender diversity and firm performance. Overa
ll H3: There are no differences between the influence of racio-ethnicity and gender diversity on firm performance. Rejected
Comparative Analysis of the Event Studies
This comparative analysis was conducted to test Hypothesis 3, which stated that there are no differences between the influence of racio-ethnicity and gender diversity on firm performance.
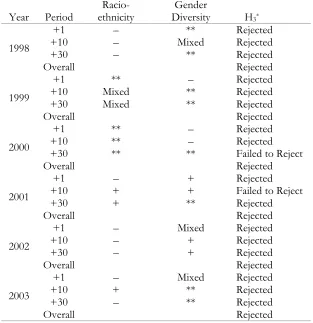
Table 10: Comparative Analysis of the Influences of Racio-ethnicity and Gender Diversity on Firm Performance, Using Event Study Methodology, by Year
Year Period ethnicity Racio- Diversity Gender H3* 1998
+1 – ** Rejected
+10 – Mixed Rejected
+30 – ** Rejected
Overall Rejected
1999
+1 ** – Rejected
+10 Mixed ** Rejected
+30 Mixed ** Rejected
Overall Rejected
2000
+1 ** – Rejected
+10 ** – Rejected
+30 ** ** Failed to Reject
Overall Rejected
2001
+1 – + Rejected
+10 + + Failed to Reject
+30 + ** Rejected
Overall Rejected
2002
+1 – Mixed Rejected
+10 – + Rejected
+30 – + Rejected
Overall Rejected
2003
+1 – Mixed Rejected
+10 + ** Rejected
+30 – ** Rejected
Overall Rejected
*H3: There are no differences between the influence of racio-ethnicity and gender diversity on firm performance. Note: ** denotes insignificant results; + denotes significant positive results; – denotes significant negative results
As an illustration, in the year 2003, the racio-ethnicity announcement negatively influenced firm performance during the 1-day announcement periods and positively influenced firm performance during the 10-day post-announcement period. The impact of the gender diversity post-announcement during the 3-day post-announcement period was mixed. The influence of the gender diversity on firm performance was insignificant during the 10-day announcement periods. Thus, Hypothesis 3 was rejected.
Conclusion. The comparative analyses revealed that there were differences between the influence of
racio-ethnicity and gender diversity on firm performance. Therefore, Hypothesis 3 was rejected for every year of the study. The research questions posed for this dissertation study are:
Do the components of cultural diversity (i.e., racio-ethnicity and gender diversity) have an impact on firm performance?
Does gender diversity or racio-ethnicity have an influence on firm performance?
Do stock values respond differently to cultural diversity announcements on the day of the announcement and during the post-announcement periods?
Research Questions 1 and 2 were addressed by testing Hypotheses 1, 2 and 3. Study findings revealed that racio-ethnicity and gender diversity had an influence on firm performance through the use of event studies and multiple regression analysis. Some findings were mixed, however. Research Question 3 was addressed by testing
Hypothesis 4 using event studies and t tests. Study findings revealed that stock values responded differently to cultural
diversity announcements on the day of the announcement and during the post announcement period. Study Limitations and Future Research
As with any research, limitations of study findings must be recognized and addressed. Data availability on the study variables poses limitations on the implications of the study results. The highest representation of Native Americans was less than 5 percent of the workforce analyzed. Companies that did not trade on the NYSE, AMEX or NASDAQ during the study period were not included in the study.
The use of cross-sectional secondary data eliminated the dynamic nature of gathering primary data from firms to ascertain the impact of cultural diversity on firm performance and to determine causal relations.
The use of event study methodologies also poses limitations on the implications of the study results. McWilliams and Siegel (1996) cited several design mistakes that occur during the use of the event study for management research, including long event windows and not controlling for competing effects occurring during the event window. This study attempted to bridge the gap by using a six-year analysis over a twenty one-day study period. Although not analyzed in this study, an extended analysis addressed the confounding effects of competing events and found that many of the diversity-performance relationships existed after controlling for the competing events.
Limitations of the study findings exist from the mere fact that actual attitudes, perceptions and opinion of the firm investors were not assessed. The investors may have reacted to the positive announcements focusing on the racio-ethnicity and gender diversity simply because they were positive announcements not because of the implications on firm performance.
10.2 Future Research
Future research should explore the diversity-performance relationship from a gender-conscious perspective. Research indicated that diversity-conscious investors respond positively to companies awarded for having quality diversity management initiatives (McMillan-Capehart et al., 2010). As more women enter the workforce, their ability to invest or join investment groups will increase. Future research should focus on whether women will focus their investment power on companies that promote, empower, and support women.
Future research should include efforts directed toward specific industry organizations to get at cultural diversity on firm performance. Will cultural diversity’s impact on firm performance differ among or between organizations operating in the goods and services industries?
Differential news media (e.g., newspapers, magazines, tv, radio, consumer and trade journals, etc.) should be canvassed over extended periods of time to determine the effects on cultural diversity with respect to racio-ethnicity and gender diversity on firm performance.
Managerial Implications
The thrust of this research effort was directed toward discerning how well a diverse workforce faired with respect to a company’s stock value and investor’s stock risk impacts organizational performance and/or productivity. In essence, do ethnicity and gender play a major role in an organizational structure, design and survival, myth or reality? A recapitulation of study finding in summary fashion follows.
Hypotheses 1 stated that there is no relationship between racio-ethnicity and firm performance with respect to Asians, Blacks/African Americans, Hispanics and Native Americans. Overall, the event study findings rejected Hypothesis 1.
Hypotheses 2 stated that there is no relationship between gender diversity and firm performance. The event study findings yielded mixed results for Hypothesis 2 in that the influence of gender diversity on firm performance varied during four years of the study.
Hypothesis 3 stated that there are no differences between the influence of racio-ethnicity and gender diversity on firm performance. The comparative analysis for the regression analyses rejected Hypothesis 3, indicating that there were differences between the influence of racio-ethnicity and gender diversity on firm performance.
rejected for every year of the study. Gender diversity announcements had a significant impact on firm performance throughout the study periods.
Management Implications
It is clearly understand today that a diverse workforce is not only mandated by some country governments, but it is good for business at all levels, and perpetuates employee morale, job satisfaction and organization’s performance (Apfelbaum, 2016; Betul & Lambkin, 2017; Bonaparte, et al, 2017; Breda & Manning, 2017; Brown, 2007; Buckingham, 2010; Chan, et al, 2016, 2017; Chapple & Humphrey, 2014; Korstanje 2017; & McMillan-Capehart, 2003). Yes, we must indeed embrace the ideology that diversity in organizations is not a myth, but a reality from a positive perspective.
First, organization leadership teams should commit themselves to developing diversity initiatives to foster promotions and empower women and minorities in the workplace. Bush and Peters (2017) succinctly pinpoints:
“Diversity is an empty word in much of corporate America. Many companies invest in diversity efforts and appoint chief diversity officers, yet are disappointed with the meager results. Over the last 30 years there has been progress, but most agree the full opportunity has not been realized. Thousands have made the business case for why diversity matters, and shown how it drives revenue, motivates employees, and fosters innovation. But for some reason, this often leads to unsatisfying debates without advancing diversity/”
Also, Apfelbaum, et al. (2014), referring to a CUNY’s Center for Urban Research study findings that Wall Street’s workforce as made up of white men, who earned more than twice as much as women and minorities. The learned researchers concluded that was a major reason why their study findings are another compelling reason to diversity markets, teams, boards, and organizations (p. 18529).
Secondly organization leadership teams should develop gender diversity initiatives that will promote and empower women in their organizations. Some researchers have suggested that female executives are more risk averse (Martin, Nishikawa, & Williams, 2009; Mitra 2016; Baskaran, 2017) and may contribute to a ―more balanced approach to risk management‖ when serving on gender-diverse executive teams (Awais, et al, 2016; Barber, 2016; Bansak, Graham & Zebedee, 2011, p. 1606; Betul & Lambkin, 2017). Hence, investors may respond to gender diversity announcements positively if they appreciate a more stable management approach resulting in a less risky investment.
References
Apfelbaum, Evan. (2016. August 8). Why your diversity program may be helping women but not minorities (or vice versa). Harvard Business Review.
Apfelbaum, E. P; Bartelt,V. L., Bernard, M., Levine, S.S., Massey, D. S., Stark, D., & Zajac, E. J. (2014). Ethnic diversity deflates price bubbles. Proceedings of the National Academy of Sciences of the United States of America, 111(52): 18524 – 18529.
Alison, G. (2011). Diversity at a very reasonable cost. Toronto Star (Canada).
Awais, M., M. F. Laber, Rasheed, N., & Khursheed, A. (2016), Impact of financial literacy and investment
experience on risk tolerance and investment decisions: empirical evidence \from Pakistan, International
Journal of Economics and Financial Issues, Vol. 6 No. 1, pp. 73-79.
Baker, Malcolm. (2016). Risk neglect in equity markets. Journal of Investment Management, Vol. 42, Number 3, pp. 12-25. Bansak, C. A., M. E. Graham, & A. A. Zebedee. (2011). The effects of gender composition of senior management on
the economic fallout. Applied Economics Letters, 18, 1603-1607.
Barber, Dennis III, Saadamand, Yassaman, & Thomas Kavoori. (2016). Gender and financial risk. The U.S. and Brazil. Studies in Business and Economics, Vol. 11. Issue 1, p. 15-25. DOI: https://doi.org/10.1515/sbe-2016-0002
Barnum, P., R. C. Liden, R. C., Ditomaso, N. (1995). Double jeopardy for women and minorities: Pay differences with age. Academy of Management Journal, 38(3), 863-880.
Barsade, S. G., Ward, A. J., Turner, J. D. F., & Sonnenfeld, J. A. (2000). To your heart’s content: A model of affective diversity in top management teams. Administrative Science Quarterly, 45(4), 802-836.
Baskaran, Venkatlaskhmi. (2017, April 18). Are women empowerment programs creating corporate gender imbalance? Linkedin.
Betul, Cal, & Lambkin, Mary. (2017), Stock exchange brands as an influence on investor behavior, International Journal
Billett, M.T., Jiangb, Z. & Regoa, L. L. (2014). Glamour brands and glamour stocks, Journal of Economic Behavior &
Organization, Vol. 107, Part B, pp. 744-759.
Bolla, Lidia, Kohler, Alexander & Wittig, Hagen. (2016). Index-linked investing—A curse for the stability of financial markets around the globe? Journal of Investment Management, Vol. 42, Number 3, pp. 26-43.
Bonaparte, Yosef, Bazley, William J., Korniotis, George M, & Kumar, Alok. (2017). Discrimination, social risk, and portfolio choice (July 18, 2017). 7th Miami Behavioral Finance Conference 2016. Available at SSRN:
https://ssrn.com/abstract=2863351 or http://dx.doi.org/10.2139/ssrn.2863351
Breda, Thomas & Manning, Allan. (2017). Diversity and social capital within the workplace: Evidence from Britain," LSE Research Online Documents on Economics 69042, (January 27) London School of Economics and Political Science, LSE Library.
Brigham, E. F., Gapenski, L. C., & Ehrhardt, M. C. (1999). Financial management: Theory and practice (9th ed.). Fort Worth, TX: The Dryden Press/Harcourt Brace College Publishers.
Brown, Dorothy A., Pensions and Risk Aversion: The Influence of Race, Ethnicity, and Class on Investor Behavior. Lewis and Clark Law Review, Vol. 11, 2007; Washington & Lee Legal Studies Paper No. 07-04. Available at SSRN: https://ssrn.com/abstract=955856
Buckingham, E. (2010). A case study exploring the impact of managing workplace diversity on diversity awareness and employee job satisfaction. Dissertation Abstracts International Section A: Humanities and Social Sciences, 71(4-A), 1365. (2010-99190-481)
Bush, Michael & Peters, Kim. (2016). December05). How the Best Companies Do Diversity Right, Fortune. Carter, D. A., Simkins, B. J., & Simpson, W. G. (2003). Corporate governance, board diversity, and firm value. The
Financial Review, 38(1), 33-53.
Cartwright, C. (1999, October). 100 best companies for working mothers. Working Mother, 26-73.
Chan, Konan, Li, Fengfei, Lin, Ji-Chai, & Lin, Tse-Chen.( 2016). What do stock price levels tell us about the firms?
Journal of Financial Economics, June, Vol. 120, Issue 3, pp. 601–622.
Chan, Konan, Li, Fengfei, Lin, Ji-Chai, & Lin, Tse-Chen (2017). What do stock price levels tell us about the firms?
Journal of Corporate Finance, October, Vol. 26, pp. 34-50.
Chapple, Larelle & Humphrey, Jacquelyn. (2014). Does Board Gender Diversity Have a Financial Impact? Evidence Using Stock Portfolio Performance. Journal of Business Ethics, July Vol. 122(4), pp. 709-723,
Chen, C. Y., Hickman, J., LeBlanc, E., Vanderkam, L., & Vella-Zarb, K. (2000, July 10). Companies for minorities.
Fortune, 142(2), 190-200.
Cook, A., & Glass, C. (2009a). Between a rock and a hard place: Managing diversity in a shareholder society. Human
Resource Management Journal 19(4), 393-412.
Cook, A., & Glass, C. (2009b). When markets blink: US stock price responses to the appointment of minority leaders.
Ethnic & Racial Studies, 32(7), 1183-1202.
Cook, A., & Glass, C. (2011). Does diversity damage corporate value? Measuring stock price reactions to a diversity award. Ethnic & Racial Studies, 34(12), 2173-2191.
Cox, T., Jr. (1994). Cultural diversity in organizations: Theory, research, and practice. San Francisco: Berrett-Koehler. Cox, T. H, Jr., & Blake, S. (1991). Managing cultural diversity: Implications for organizational competitiveness.
Academy of Management Executive, 5(3), 45-56.
Daniel, W. W., & Terrell, J. C. (1995). Business statistics for management and economics (7th ed.). Boston, MA: Houghton Mifflin Company.
Dass, P., & Parker, B. (1999). Strategies for managing human resource diversity: From resistance to learning.
Academy of Management Review, 13(2), 69-81.
Dezsö, C. L., & Ross, D. (2012). Does female representation in top management improve firm performance? A panel data investigation. Strategic Management Journal, 33(9), 1072-1089.
Esposito, F., Garman, S., Hickman, J., Watson, N., & Wheat, A. (2001, July 9). America’s 50 best companies for minorities. Fortune, 144(1), 122-127.
Fabozzi, F. J., & Modigliani, F. (2003). Capital markets: Institutions and instruments (3rd ed.). Upper Saddle River, NJ: Prentice Hall.
Folpe, J. M. (1999, October 25). Fortune’s 50 Most Powerful Women. Fortune, 140(8), 103-107.