J Biostat Epidemiol. 2018; 4(3): 119-123
Journal of Biostatistics and Epidemiology
Please cite this article in press as: Vakili Basir A, Gholami FesharakiM, RowzatiM.Multivariate logistic regression analysis using Original Article
Multivariate logistic regression analysis using multilevel model
Ahmad Vakili Basir1, Mohammad Gholami Fesharaki2*, Mohsen Rowzati3
1 Biostatistics Department, Faculty of Medical Sciences, Tarbiat Modares University, Tehran, Iran
2 Assistant Professor of Biostatistics, Biostatistics Department, Faculty of Medical Sciences, Tarbiat Modares University, Tehran, Iran
3 Worksite Follow-Up Unit, Occupational Health Center, Mobarakeh Steel Company, Isfahan, Iran
ARTICLE INFO ABSTRACT
Received 06.12.2017 Revised 27.12.2017 Accepted 05.03.2018
Background & Aim: One of the basic assumptions in simple linear regression models is the statistical independence of observations. Sometimes this assumption is not true for study subject and consequently the use of general regression models may not be appropriate. In this case, one of the leading methods is the use of multilevel models. The present study utilizes multivariate logistic regression model using a multilevel model to exhibit the chance of having elbow, wrist and knee disorders over the past year based on elbow, wrist and disorders during the past week.
Methods & Materials: This study is a cross-sectional study that was carried out from April 2015 to May 2016 in Mobarakeh Steel Company, Isfahan. The study population includes 300 male employees of Mobarakeh Steel Company, with a mean age of 41.40±8.17 years and an average working experience of 16.0±7.66 years. Data were analyzed using SPSS (version 24) and MLwiN software.
Results: Based on this study, results obtained from single variable and multivariable regression were different.
Conclusion: Based on this study, it can be suggested that multivariable regression cause a better and more accurate deduction compared to single variable method.
Key words: Multivariate logistic regression; Multilevel model; Missed values; WMSDs; NIOSH
Introduction
The aim of statistics is the development and application of methods for extraction of valuable results from data sources and experiences. This science is divided into two main statistics groups including descriptive and inferential. The aim of inferential statistics is to discuss the effects of descriptive variables on response variables through modeling. Different statistical modeling can be described in generalized linear model format. A generalized linear model is composed from three components, including random, systematic and link function. Random component can be defined as distribution of variables’ response which is continuous or discrete and the mean of random component can be considered as
a function of covariates. The systematic component is a relationship between the mean of dependent variable with covariates (x_1,x_2,...,x_p) and link function, correlation between the mean of random and systematic components. In most of medical applications and studies the desired answer variable is defined as zero and one. For example, if the individual age is supposed as an independent variable, whether he/she has cardiovascular disease or not, the dependent (response) variable can be zero (with heart failure) or one (without heart failure). If n number of individuals are examined, data of (x_1,y_1),(x_2,y_2),…,(x_n,y_n) will be obtained in which x_i is considered as age and y_i is zero or one. Logistic regression is, therefore, used in this condition. Odds ratio, which is defined as a ratio of occurrence probability to lack of occurrence probability, is designed in logistic regression. However, general logistic regression cannot be used in multivariate response. For instance, it has been supposed that a researcher _____________________________________________________
* Corresponding Author: Mohammad Gholami Fesharaki, Postal Address: Department of Biostatistics, Faculty of Medical Sciences, Tarbiat Modares University, Tehran, Iran
wants to evaluate the effect of shift working, work experience and education on musculoskeletal disorders incidence (1–3). Musculoskeletal disorders depend on work patterns. It is not specific to the industry or specialty and may be seen in all industries and professions. Symptoms of this disease are mainly observed in areas of the lower back, neck and upper extremities of the body (4, 5). According to NIOSH (National Institute for Occupational Safety and Health), which is done just for occupational patients, Work-related Musculoskeletal Disorders are ranked second after respiratory illnesses (6). Symptoms of the disease are reported for back, neck and upper limbs. If the author wants to consider correlations, a simple logistic regression for back problems, additional simple logistic regression for neck and one another for upper limbs is needed. Indeed, three logistic regression models are used for one hypothesis. Use of three models instead of one model increases first type error. Furthermore, consideration of relationships between these three variables in three separate regressions is impossible. For this purpose, see the Figure 1.
Multilevel model
One of the basic assumptions in simple linear
regression models is the statistical
independence of observations (7). Sometimes this assumption is not true for study subject and consequently, the use of general regression models may not be appropriate. This status occurred for multilevel of cluster data that contain intergroup relation structures (8, 9). Appropriate model for the analysis of these data is multilevel models (10, 11). Since multilevel models consider correlation between observations, they provide more accurate results than compared to simple linear regression analysis (10, 12). In follow-up studies, there is the possibility of data loss which can lead to loss of information and missed values. The presence of missed values may decline accuracy of calculated statistical indicators and subsequently increase the complexity of model and statistical methods. Since results from incomplete data can result in bias, these data analysis should be done in appropriate way (8, 9, 13). Multilevel model is a suitable method because it does not require data with balanced structure (11, 12). Multilevel models are a kind of analytical models that include variables measured at hierarchy different levels. Indeed, they include a class of models that use hierarchical linear regression. These models consider hierarchical structure of data. Multilevel models are also
J Biostat Epidemiol. 2018; 4(3): 119-123
known as random coefficients model, variants component model, and hierarchical linear model (14, 15). For example, it has been supposed that there are binary variables ( , , ) with a predictor variable ( ). For the fitness of the three variables logistic regression model, the following Equation can be used:
( ) = +
( ) = +
( ) = +
(1)
Data structure in this form, which has known as structure, is shown in Table 1.
It has been also supposed that if the correlation matrix = , , is summarized as follow:
1 1
1
Data structure can be converted to that in Table (2), which is known as structure. Considering the long structure, Equation fitness form of Equation (1) can be converted to that in Equation (2): = + + ( + ) + ( + ) + (2)
where = 1 = 2
0 . and = 1 = 30 .
also assume that with a conception of
~ (0 , ). With this assumption the value of
can be calculated with following formula:
=
+ 3
Methods
This is a cross-sectional study which was carried out from April 2015 to May 2016 in Mobarakeh Steel Company, Isfahan. Study
population contained 300 male employers in Mobarakeh Steel Company, Isfahan. The inclusion criteria were as follow:
Being official employment or Contract At least one year of services in the factory Lack of absence within the last 6 months At least 20 h activity each week
History of limb fractures during the last year
Severe damage
History of physiotherapy and surgery during the last 6 months.
Individuals who had fever, chronic infection, acute inflammatory reactions, and limb fractures during the study, as well as unwilling participants were excluded from the study. In this study, three questionnaire tools, examination and figures were used for data collection. Nordic questionnaire was applied to evaluate musculoskeletal disorders in different organs of employers. The validity and reliability of this questionnaire, which has been confirmed in different studies, were performed by the researcher (16–18). The physical status of employers including Gait status, Posture in standing and working modes, and
muscular-Table 2. Long structure
∗ ∗ 2 1 1 0 0 0 0 2 2 0 1 0 2 0 2 3 1 0 1 0 2 6 1 0 0 0 0 0 6 2 1 1 0 6 0 6 3 1 0 1 0 6 3 1 1 0 0 0 0 3 2 1 1 0 3 0 3 3 0 0 1 0 3 4 1 0 0 0 0 0 4 2 0 1 0 4 0 4 3 1 0 1 0 4 8 1 1 0 0 0 0 8 2 0 1 0 8 0 8 3 0 0 1 0 8 7 1 1 0 0 0 0 7 2 1 1 0 7 0 7 3 1 0 1 0 7 9 1 1 0 0 0 0 9 2 0 1 0 9 0 9 3 0 0 1 0 9 7 1 0 0 0 0 0 7 2 1 1 0 7 0 7 3 1 0 1 0 7 5 1 1 0 0 0 0 5 2 0 1 0 5 0 5 3 0 0 1 0 5 9 1 0 0 0 0 0 9 2 1 1 0 9 0 9 3 1 0 1 0 9
Table 1. Wide structure
skeletal system evaluation through observation, touch, range of joints movements, and also assessment of strength and flexibility of muscles. The abdominal muscle and vertebrae strength were evaluated using Kendall method, while the strength of other muscles was evaluated by standard muscle measurement technique (MMT). Laboratory and paraclinical examinations were also provided in case there were pathological findings during clinical assessment of each person. QEC method was applied to evaluate the level of muscular-skeletal disorders (19, 20). Data were analyzed through IBM’s SPSS (Version 24) and Software.
Results
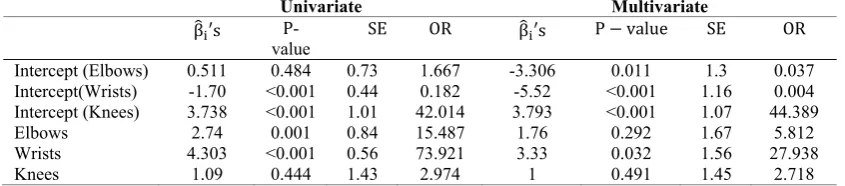
In this study, 300 workers from Mobarakeh Steel Company, Isfahan with a mean age of 41.40±8.17 years and a work experience of 16.0±7.66 years were included. In this research, a variable of chronic problem in each week was used as an independent variable for prediction of the presence of problem chance in one year. Therefore, the presence of chronic problem over the last year in elbow, wrist, and knee was a functional problem within the last one week. In the both single and multivariable models, effect of knee failure in last week on knee failure in last year was rejected. However, a chance of 15.4 and 73.9 times were found to be significant for elbow and wrist problems in single variable (Table 3). These results for multivariable showed a chance of 28 for the wrist problem. Furthermore, in multivariate condition, effect of elbow problem in last week on the last year was rejected.
Discussion and Conclusion
Since results obtained from single variable and multivariable regression were different, it can be suggested that multivariable regression cause a better and more accurate deduction compared to single variable method.
Ethics approval and consent to participate
Medical Ethics Committee of Tarbiat Modares University Medical School approved the study (code number: IR.TMU.REC. 1395.398).
Acknowledgements
We gratefully acknowledge Tarbiat Modares University Financial support. The authors wish to thanks all the personnel, especially the staff of Industrial Medicine in Department of EMSC, for their cooperation throughout the study.
Conflicts of interests
The authors declare that there is no conflict of interest regarding the publication of this article.
References
1. Kheiri H, Moshfegh H, Hatani H, Ranjbarian M. Investigation of relationship between musculoskeletal disorders and working conditions among workers at a pharmaceutical industry in Iran (2011-2012). Iran J Heal Saf Environ. 2014;1(3):145–50.
2. Chiu YJ, Liao WC, Wang TH, Shih YC, Ma H, Lin CH, et al. A retrospective study: Multivariate logistic regression analysis of the outcomes after
pressure sores reconstruction with
fasciocutaneous, myocutaneous, and perforator flaps. J Plast Reconstr Aesthetic Surg. 2017;70 (8):1038–43.
3. Mesquita CC. Musculoskeletal Disorders in Workers-risk factors: What Can We Do? Occup Med Heal Aff. 2013; 27 Apr.
4. Mortazavi SB, Khavanin A, Motamedzade M, Hajizade E, Mohseni M. The effect of postures on musculoskeletal disorders in work places. J Kermanshah Univ Med Sci. 2012;16(5):367–74.
5. Punnett L, Wegman DH. Work-related
musculoskeletal disorders: the epidemiologic evidence and the debate. J Electromyogr Kinesiol. 2004;14(1):13–23.
6. Choobineh AR, Daneshmandi H, Deilami F, Khoshnami S. Ergonomic workplace assessment and survey of musculoskeletal injuries in a generator manufacturing company. J Heal Syst Res. 2013;9:20–30.
Table 3. Comparison of estimated coefficients of multivariate logistic regression and ordinary logistic regression
Univariate Multivariate
β ′s P
-value SE OR β ′s P − value SE OR
Intercept (Elbows) 0.511 0.484 0.73 1.667 -3.306 0.011 1.3 0.037
Intercept(Wrists) -1.70 <0.001 0.44 0.182 -5.52 <0.001 1.16 0.004 Intercept (Knees) 3.738 <0.001 1.01 42.014 3.793 <0.001 1.07 44.389
Elbows 2.74 0.001 0.84 15.487 1.76 0.292 1.67 5.812
Wrists 4.303 <0.001 0.56 73.921 3.33 0.032 1.56 27.938
J Biostat Epidemiol. 2018; 4(3): 119-123
7. Neter J, Kutner MH, Nachtsheim CJ, Wasserman W. Applied linear statistical models. Vol. 4. Irwin Chicago; 1996.
8. Harvey G. Multilevel Models in Educational and Social Research. John Wiley & Sons, 2011. 9. McCulloch CE, Neuhaus JM. Generalized linear
mixed models. Wiley Online Library; 2001. 10. Sullivan LM, Dukes KA, Losina E. Tutorial in
biostatistics. An introduction to hierarchical linear modelling. Stat Med. 1999;18(7):855–88. 11. Buxton R. Statistics: Multilevel modeling. Math
Learn Support Centre–Technical report. 2018. Online available at: www.statstutor.ac.uk/ resources/uploaded/multilevel modelling.pdf. 12. Haji Ahmadi M, Ayatollahi MT, Behboudian J.
The effect of missing data in growth curves. J Babol Uni Med Sci. 2004;6(4):23-29.
13. Fitzmaurice GM, Laird NM, Ware JH. Applied longitudinal analysis. Vol. 998. John Wiley & Sons; 2012.
14. Guo G, Zhao H. Multilevel modeling for binary data. Annu Rev Sociol. 2000;26(1):441–62. 15. Song X, Lee S. Model comparison of generalized
linear mixed models. Stat Med. 2006;25(10): 1685–98.
16. Kuorinka I, Jonsson B, Kilbom A, Vinterberg H, Biering-Sørensen F, Andersson G, et al.
Standardised Nordic questionnaires for the analysis of musculoskeletal symptoms. Appl Ergon. 1987;18(3):233–7.
17. Crawford JO. The Nordic Musculoskeletal Questionnaire. Occup Med (Chic Ill) [Internet]. 2007;57(4):300–1. Available from: http://dx.doi. org/10.1093/occmed/kqm036
18. Dickinson CE, Campion K, Foster AF, Newman SJ, O’rourke AMT, Thomas PG. Questionnaire development: an examination of the Nordic Musculoskeletal questionnaire. Appl Ergon. 1992;23(3):197–201.
19. David G, Woods V, Li G, Buckle P. The development of the Quick Exposure Check (QEC) for assessing exposure to risk factors for work-related musculoskeletal disorders. Appl Ergon. 2008;39(1):57–69.