AUTUMN 2017, Vol 3, No 2, JOURNAL OF HYDRAULIC STRUCTURES Shahid Chamran University of Ahvaz
Journal of Hydraulic Structures J. Hydraul. Struct., 2017; 3(2): 22-31
DOI: 10.22055/jhs.2018.24654.1062
Three-dimensional numerical modeling of score hole in
rectangular side weir with finite volume method
Samira Ghotbi1 Azam Abdollahi2
Mehdi Azhdari Moghadam3
Abstract
Local scouring in the downstream of hydraulic structures is one of the important issues in river and hydraulic engineering, which involves a lot of costs every year, so the prediction of the rate of scour is important in hydraulic design. Side weirs are the most important of hydraulic structures that are used in passing flow. This study investigates the scouring due to falling jet from side weir in downstream in side channel numerically. The simulation was done with finite volume method. The comparison of numerical and experimental results of flow fields shows agreement. Results show that from upstream to downstream of side weir located in side channel, scoring is increased and the dimensions of the scour hole in the downstream of the rectangular side weirs increase along it. In fact, at the downstream of the lower edge of side weirs in side channel, scouring has the greatest dimensions; in particular the depth.
Keywords:Scour, Side weir, Three-dimensional Modeling, Finite volume method.
Received: 08 October 2017; Accepted: 06 November 2017
1. Introduction
Side weirs are common hydraulic structures that are used to transfer water from the main canal to the side channel, these structures are used to control flood and divert temporary flow. So far, many studies have been conducted on the discharge coefficient ([1], to [4]) and changes in the geometry of these side weirs ([5], to [7]) in a fixed bed. G. Michellazo, in an experimental study investigated the effect of the moving bed in the main channel on the flow properties of rectangular side weir. Finally, the results showed that the side weir in the moving bed for deviating the flow is much more effective than in the fixed bed [8]. Scouring is a natural
1 Faculty of Civil Engineering, University of Sistan and Baluchestan, Zahedan, Iran, [email protected] (Corresponding author)
2 Faculty of Civil Engineering, University of Sistan and Baluchestan, Zahedan, Iran, [email protected]
AUTUMN 2017, Vol 3, No 2, JOURNAL OF HYDRAULIC STRUCTURES Shahid Chamran University of Ahvaz
phenomenon due to water flow on erosion bed’s rivers and canals. Also local scouring is part of the morphological changes of the waterways, which is mainly due to various structures made by human [9]. Up to now, a lot of study has carried out on the local scoring in the downstream of the conserved bed. Farhoudi & Smith, examined the scour profiles in the downstream of hydraulic jump and presented the scour hole according to dimensionless profiles [10]. Balachandar et al., investigated the effect of a tail water depth on scour hole development on a loose bed of cohesion less sand material then provided diagrams for the development of the scour hole at different times [11]. The outflow of hydraulic structures is often as a jet that may causes significant changes in the topography of the river and surrounding these structures. It is caused substantial damages and environmental effects. The jet with high speed creates a great shear stress which often has a critical shear stress to start moving particles. Passing time, bed scour increases scour depth also reduces shear stress that causes a reduction the rate of scour [12]. With time, this leads to equilibrium a scour depth [13]. Equilibrating in the scour depth is an approximation phenomenon [11]. Jo Jong-Song, in a 2D numerical model investigate the local scour alteration in open channels of a tideland dike and concluded as the width of open channel between tideland dikes decreased, due to increased flow velocity, the scoured depth intensely increased [14]. M. Burkow, M. Griebel, investigate a 3D numerical simulation of fluid flow and sediment transport at rectangular obstacle. Results show the typical vortex system for the sediment transport and its interplay with shear stress and transport rates [15]. Török et al., offered a combined application of two bedload transport formulas that extends the application usage. Consequently more suitable simulation results [16].
Figure1. Flow pattern of falling jet in score hole
Sediment transmission and Problems concerning its caused existence challenge in hydraulic structures. This subject is studied by engineers and river morphologists. In recent years, hydraulic and sediment science have progressed vastly. For the first time Shields examined the threshold of sediment motion. He presented a diagram that is surveyed the stability of soil channel and rivers. There are several insight for estimating the dimension of scour hole in the downstream of hydraulic structures. Several analytical, experimental, and laboratory relationship has been proposed to determine the depth, width and length of scour hole ([17], [18]). One of the Relationships for estimating the depth of the scour hole in the downstream of Falling jet is Veronese [19]:
(1)
That q is flow rate and H1 is the height of the cascade. The above relation is very simple and just using these two parameters, the depth of the scour hole can be calculated and the effect of
0.54 0.225 1
1.9
s
AUTUMN 2017, Vol 3, No 2, JOURNAL OF HYDRAULIC STRUCTURES Shahid Chamran University of Ahvaz
sediment properties is not considered. Another relationship to calculate the depth of scouring is given that In addition to the the above parameters, also the physical properties of the sediment, are considered [20].
(2)
g, dw and d, are Gravity acceleration, the depth of tail water depth, and the particle diameter index respectively which, according to their suggestion, is the same as the average particle diameter d50. According to the previews studies, Investigation of scouring in downstream of side wires is unprecedented. Thus in this research a numerical model of scouring due to falling jet from rectangular lateral side weir has been investigated. Although the prediction of scour depth and the estimation of the final shape of the bed by laboratory models seems reasonable, but from the point of view of cost and time, it is not affordable. Using a series of assumptions, the governing equations of the flow and sediment can be simplified. In this research, a three dimensional numerical model is used.
2. Mathematical modeling
In this research, mathematical simulation of flow over the rectangular side weir and sediment transport in the bed of side channel in downstream the side weir has been developed. For this purpose, finite volume (VOF) method has been used for numerical solution of equations. Rectangular cube cells grid has been used for the domain mesh generation. Selection of this grid is because of easy to generation, the proper order and less memory need.
3. Governing equations:
Sediment scouring models are sensitive to the turbulence model because the turbulence model directly affects the viscosity. Using viscosity, the shear stress is calculated locally. Also, for calculating the transport rate and erosion of the load, the local shear stress is used. The RNG turbulence model is mainly recommended for scouring modeling in this software [21] that used in this study. In the present study, following assumptions are used:
(a) An incompressible fluid (water) flows. (b) The pressure distributed hydrostatically.
(c) Flow is shallow enough thus Vertical accelerations be neglected. (d) The effects of wind and wave are ignored.
The governing equations for fluid flow in this study are the continuity and momentum equations that are presented below.
Mass continuity equation:
(3)
Where VF is the volume fraction of the flow, ρ is the fluid density, R is the coefficient of the
cylindrical or Cartesian coordinates in the equation,
R
DIF is Disturbance phrase, andR
SORis themass source.
u
,v
andw
represent the velocity along x, y and z.A
x ،A
y andA
z Equal to thefractions of the surface for flow along x, y and z. The first term on the right hand side of the 1
0.6 0.05 0.15
0.3 0.1
3.27 w
s
q H d
d
g d
(
)
(
)
(
)
xF x y z DIF SOR
uA
V
uA
R
vA
wA
R
R
t
x
y
z
x
AUTUMN 2017, Vol 3, No 2, JOURNAL OF HYDRAULIC STRUCTURES Shahid Chamran University of Ahvaz
above equation is related to the disturbances and defined as:
( ) ( ) ( ) x
DIF x y z
A
R A R A A
x x y y z z x
(4)
And the second term on the right hand side of equation represents the change in density.
2
y
x x SOR
F
uA
vA
zuA
R
V
P
wA
R
c
t
x
y
z
x
(5)That P is the pressure and c is the velocity of the wave. The momentum equation in three directions in three dimensions are:
2
1 1
( )
y SOR
x y z x x x w s
F F F
A v R
u u u u P
uA vA wA G f b u u u
t V x y z xV x V
(6)
1 1
( )
y SOR
x y z y y y w s
F F F
A vu R
v v v v P
uA vA wA G f b v v v
t V x y z xV y V
(7)
1 1
( )
SOR
x y z z z z w s
F F
R
w w w w P
uA vA wA G f b w w w
t V x y z z V
(8)
x
f
،f
yand
f
z parameters are the viscosity accelerations andG
x ،G
y andG
z areVolumetric accelerations and
b
x ،b
y andb
z are Flow drops in permeable environments.4. Computational domain:
In order to validate the numerical model in this study, the experimental results of rectangular side weir were studied by Bagheri and Haydarpour [22], is used. The specifications of the hydraulic structure are as follows. The main channel was designed with a length of 3 meters and a width of 0.4 meters and a height of 35/0. The rectangular side weirs location is 1.8 meters from the beginning of the channel. The side weirs specifications is presented in the table below. The side channel is along the main channel with a same width to main channel. Bottom of the side channel has been covered with aggregate materials. Sediment height at the bottom of the side channel is 10 cm. The diameter of sediment aggregates in this study is equal to 0.005 mm and their density is 2650 kg / m3.
Table1. Specifications of side weir [22]
( m3/s )
inflow Length (cm) Height (cm)
0.042 30 15.4
Sediment characteristic parameters in the side channel are presented in table 2. The soil is cohesion less.
Table2. Specifications of sediment
Bed loading Suspension coeff. Critical shields Bed
loading coeff. Angle (degree)
0.018 0.05 8 32
AUTUMN 2017, Vol 3, No 2, JOURNAL OF HYDRAULIC STRUCTURES Shahid Chamran University of Ahvaz
dimensionless parameter * i
R
.(9)
Using the above equation, the critical Shields number is calculated from the following equation.
(10)
5. Boundary Conditions:
The boundary conditions for the walls in main and lateral channel are Wall no slip condition. The symmetry boundary condition, for the water surface boundary, fixed velocity with the specified head for the input channel and the continuative boundary condition for downstream boundary is used. It is assumed that inlet flow is a fully developed flow. This assumption was reasonable.
Figure2. scheme for computational domain and boundary conditions
6. Model Validation:
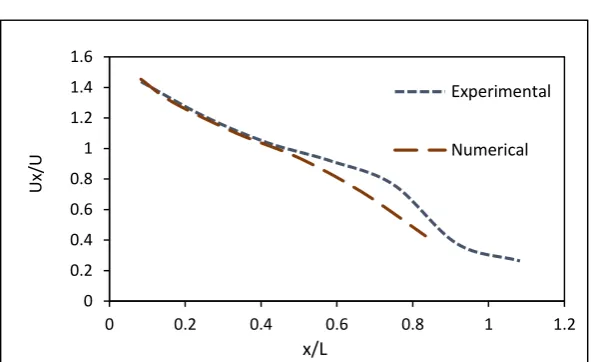
Given that only at the bottom of the side weirs, i.e. in the sub-channel of sediment and there is no deposition in the main channel, the flow conditions are precisely the same as the flow field in the range of side weirs of laboratory without sediment models. And for validation, the results of similar laboratory models can be used. To this purposes, Bagheri et al.'s [21] laboratory model has been used. Therefore, it is used to confirm accuracy of flow velocity profile on the side weir. As can be seen, the results are reasonable.
*0.52
, 2
* 3 0.1
0.054[1 exp( )] 10 ( )
i cr i
i
R
R
, ,
* ,
0.1( s i f) f s i i s i
f
g d
R d
AUTUMN 2017, Vol 3, No 2, JOURNAL OF HYDRAULIC STRUCTURES Shahid Chamran University of Ahvaz
Figure4. Comparison of the normalized velocity-length profiles obtained from the mathematical and Bagheri et al.'s laboratory [22] model
7. Results and Discussion:
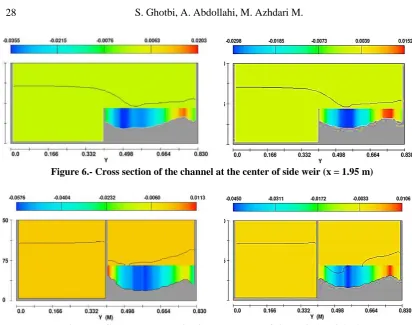
Figure 5-7 shows the scour depth at the three upstream, downstream, and center points in the channel cross-section. As you can see, the scouring rate in the downstream is increased by moving from the top of the weirs to the end of it. This indicate increased eddy velocities during the side weirs. The maximum scour at the lateral side of the side weir is 5.76 cm. The times are relative and represent to the balance for scouring equilibrium.
t = 0.5 t = 1
Figure 5. Cross section of the channel at the upstream of side weir(x = 1.8 m)
0 0.2 0.4 0.6 0.8 1 1.2 1.4 1.6
0 0.2 0.4 0.6 0.8 1 1.2
Ux/U
x/L
Experimental
AUTUMN 2017, Vol 3, No 2, JOURNAL OF HYDRAULIC STRUCTURES Shahid Chamran University of Ahvaz
Figure 6.- Cross section of the channel at the center of side weir (x = 1.95 m)
Figure 7. Channel cross section in downstream of side weir (x = 2.1 m)
Figure 8, which is related to scouring in the downstream of side weirs, Compared the maximum depth of the scour hole in the three upstream, downstream, and center points of side weirs. As it can be seen, at all three points in the downstream of the side weirs, the greatest amount of scouring occurs in the initial times, and then the slope of the changes and the scouring is reduced to equilibrium.
Figure 8. Comparison of maximum depth of the scour hole in upstream, downstream, and center points of the side weirs
0 0.01 0.02 0.03 0.04 0.05 0.06 0.07
0 0.2 0.4 0.6 0.8 1
Time
X=1.8 m
X=1.95 m
X=2.1 m
m
ax
im
um
de
pth o
f
sc
o
ur
ho
le
(m
AUTUMN 2017, Vol 3, No 2, JOURNAL OF HYDRAULIC STRUCTURES Shahid Chamran University of Ahvaz
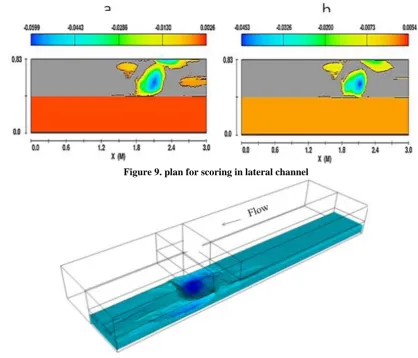
As can be seen, Figure 9 shows the variation of scour along the sub channel during the simulation. What emerges from this is that as time progresses, scour is increased and the dimensions of the scour hole (length, width and depth) are increasing. There are also other points around the hole that have scoured and have eroded in very small parts, due to the creating flow of falling jet from the weir. Also, points with brown and red colors around the hole represent the sedimentary hills caused by the sediment deposition in the downstream of weir. In fact, at these points, the height of the bed is increasing. The negative sign in this figure indicates a decrease in depth and scour, and a positive sign indicates an increase in the depth and formation of sedimentary hills. Figure 10 shows the scouring pattern in the sub-channel. As can be seen, the depth of the scour hole in the downstream of weir is higher at the lower edge than the other points.
Figure 9. plan for scoring in lateral channel
Figure 10. score hole in downstream of side weir
AUTUMN 2017, Vol 3, No 2, JOURNAL OF HYDRAULIC STRUCTURES Shahid Chamran University of Ahvaz
Figure11. Turbulent kinetic energy in downstream of side weir in side channel
8. Conclusions
AUTUMN 2017, Vol 3, No 2, JOURNAL OF HYDRAULIC STRUCTURES Shahid Chamran University of Ahvaz
9. References
1. Swamee PK, Pathak SK, Ali MS, (1994). Side-weir analysis using elementary discharge coefficient. Irrigation and drainage engineering, pp: 120(4):742-55.
2. Singh R, Manivannan D, Satyanarayana T, (1994). Discharge coefficient of rectangular side weirs. Irrigation and Drainage Engineering, pp: 120(4):814-9.
3. Borghei SM, Jalili MR, Ghodsian MA, (1999). Discharge coefficient for sharp-crested side weir in subcritical flow. Hydraulic Engineering, pp: 125(10):1051-6.
4. Ghodsian M, (2003). Supercritical flow over a rectangular side weir. Canadian Journal of Civil Engineering, pp: 30(3):596-600.
5. Cheong HF, (1991). Discharge coefficient of lateral diversion from trapezoidal channel. Irrigation and Drainage Engineering, pp: 117(4):461-75.
6. Emiroglu ME, Kaya N, Agaccioglu H, (2009). Discharge capacity of labyrinth side weir located on a straight channel. Irrigation and drainage engineering, pp: 136(1):37-46.
7. Kaya N, Emiroglu ME, Agaccioglu H, (2011). Discharge coefficient of a semi-elliptical side weir in subcritical flow. Flow Measurement and Instrumentation, pp: 22(1):25-32.
8. Michelazzo G, Minatti L, Paris E, Solari L, (2016). Side Weir Flow on a Movable Bed. Hydraulic Engineering, pp: 142(6):04016007.
9. Hoffmans G. J. C. M, Pilarczyk K. W, (1995). Local scour downstream of hydraulic structures. Hydra. Eng, pp: 121(4): 326-340.
10. Farhoudi J, Smith K. V. H, (1985). Local scour profiles downstream of hydraulic jump. Hydra. Res, pp: 23(4): 343-358.
11. Balachandar R, Kells J. A, Thiessen R. J, (2000). The effect of tailwater depth on the dynamics of local scour. Can. J. Civ. Eng, pp: 27, 138-150.
12. Kells J. A, Balachandar R, Hagel K. P, (2001). Effect of grain size on local channel scour below a sluice gate. Can. J. Civ. Eng, pp: 28, 440-451.
13. Kurniawan, A., Altinakar, M. S. Graf, W. H. (2001). Flow pattern of an eroding jet. Proceedings of XXIX IAHR Congress, Beijing, China.
14. Jo J. S, (2017). Numerical Simulation of Scour Depth in Open Channels of Tideland Dike. American Journal of Naval Architecture and Marine Engineering, pp: 9(4):91-98.
15. Burkow M, Griebel M, (2015). A full three dimensional numerical simulation of the sediment transport and the scouring at a rectangular obstacle. Preprint submitted to Elsevier.
16. Török G. T, Baranya S, Rüther N, (2017). 3D CFD Modeling of Local Scouring, Bed Armoring and Sediment Deposition. Water, pp: 9(1):56.
17. Martins RB, (1975). Scouring of Rocky River beds by free jet spillways. Int. Water Power Dam Constr, pp: 27(4):152-3.
18. Rajaratnam N, Mazurek K, (2003). Erosion of sand by circular impinging water jets with small tailwater. Hydraulic Engineering, ASCE, pp: 129(3):225-229
19. Veronese A., Erosion of a bed downstream from an outlet, Colorado A & M College, Fort Collins, United States, 1937.
20. Mason PJ, Arumugam K, (1985). Free jet scour below dams and flip buckets. Hydraulic Engineering, pp: 111(2):220-35.
21. Brethour J, Burnham J, (2010). Modeling sediment erosion and deposition with the FLOW-3D sedimentation & scour model. Flow Science Technical Note, FSI-10-TN85, pp: 1-22.