Damage Identification in Large-scale Double-layer Truss
Structures Via a Two-stage Approach
S.R. Hoseini Vaez
a,∗, N. Fallah
a, A. Mohammadzadeh
baDepartment of Civil Engineering, Faculty of Engineering, University of Qom, Qom, Iran. bDepartment of Civil Engineering, EITC, University of Manitoba, Winnipeg, Canada.
Article info
Article history:Received 13 January 2019 Received in revised form 17 March 2019
Accepted 18 March 2019
Keywords:
Damage identification
Whale optimization algorithm Damage locating vector
Large-scale double-layer trusses Two-stage approach
Exponential decreased stress
Abstract
In this study, a two-stage damage identification approach based on modal flexibility differences and whale optimization algorithm (WOA) was applied to localize and quantify damages in large-scale double-layer truss structures. In first stage, damage locating vector (DLV) method using EDS (exponential decreased stress) was employed to find the real damaged elements of structure; then, WOA algorithm was used to determine the severity of suspected damaged elements obtained from the first stage. To evaluate the reliability of the proposed approach, two large-scale double-layer truss structures were studied. Furthermore, to assess the effect of noise on the accuracy of damage detection, the article compares the results of EDS with NCE. Calculation results demonstrate that the combination of DLV method using EDS and WOA algorithm provides an effective tool to carefully determine the location and the severity of structural damages in noisy condition directly. Moreover, the approach determines damages even though there are the low number of used mode shapes and a high number of structural elements.
1. Introduction
To detect damage of structures and validity of their applicability and integrity, Structural Health Moni-toring (SHM) has been studied by many researchers [1, 2]. Previously, Farrar and Worden [3] and Sohn et al. [4] summarized damage identification methods of SHM briefly.
Because of the effect of damage on stiffness of structural components, modal properties of structure change. Yan et al. [5] summarized researches studied by using dynamic characteristics of structure. Addi-tionally, Salawu [6] reviewed studies of utilizing vari-ations of natural frequencies and mode shapes and discussed the cheap and easy use of the variations. Messina et al. [7] provided the Multiple Damage Loca-tion Assurance Criterion (MDLAC) to detect damage
of structures. Change in stiffness of elements causes change in the flexibility matrix of the structure. It has been used by many researchers, for example, Pandey and Biswas [8] used changes in flexibility matrix of healthy and damaged elements to localize damaged el-ements and showed that flexibility matrix can be pre-cisely calculated by low-frequency modes of the struc-ture while other modal characteristics of strucstruc-ture need high frequency modes. Seyedpoor [9] proposed a new indicator which is named Flexibility Strain Energy Based Index (FSEBI) by using changes of strain en-ergy and flexibility matrix of structure. Zhao and De-Wolf [10] derived sensitivity of mode shapes, natural frequencies, and modal flexibility to damage through introducing sensitivity coefficient. They compared the maximum and minimum of sensitivity coefficients and
∗Corresponding author: S.R. Hoseini Vaez (Associate Professor)
E-mail address: [email protected]
http://dx.doi.org/10.22084/jrstan.2019.18031.1076 ISSN: 2588-2597
concluded that sensitivity of modal flexibility is more than others. Many researches in the field of damage identification worked through one-stage [11–16] and two-stage [17–19] methods. The most common method among them was to use a metaheuristics optimization algorithm with determination of an inverse optimiza-tion problem. In such approach, damaged elements were identified by their damage severity together. But many researchers utilized wide range of metaheuristics algorithms, for instance, Begambre and Laier [20] in-troduced PSOS algorithm, combining particle swarm optimization algorithm (PSO) and simplex approach. They formulated an objective function based on the Frequency Response Function (FRFs) of the systems.
All in all, though the use of one-stage methods pro-vided acceptable accuracy for damage identification of small-scale structures, it has no competence in large-scale structures where many excessive healthy elements are localized in every try, and it causes difficulties such as long running time, high computational costs, and de-crease of accuracy for quantifying damage severity of damaged elements. Therefore, the one-stage method does not have application to detect damage.
One of the most useful approaches to identify dam-age is to divide the process into two stdam-ages, includ-ing locatinclud-ing damaged elements and quantifyinclud-ing damage severity of localized elements. The approach makes an increase in the rate of localizing damaged elements in the first stage, especially in the large-scale structures, as well as, improvement in the accuracy of quantify-ing damage severity in the second stage due to the de-crease in the number of algorithm variations. To local-ize damaged elements in the first stage, Moslem and Nafaspour [21] utilized residual force method. With integrating mode shapes and natural frequencies, Guo and Li [22] proposed evidence theory to localize dam-aged sites in the first stage. They provided a micro-search GA to quantify the damage severity in the sec-ond step and analyzed a numerical model of a can-tilever beam to compare the provided method to the MDLAC and the simple genetic algorithms. Bernal [23] proposed Damage Locating Vector (DLV) method to localize damage in linear elastic structures through de-signing the static force vectors causing zero stress over damaged elements. Seyedpoor and Montazer porposed [24, 25] new two-step approaches to identify damage in trusses. They introduced a new modal residual vector-based indicator and a flexibility-vector-based damage prob-ability to locate the potentially damaged elementsin the first step, and then differential evolution algorithm was used to determine severity of located elements. Many other researchers utilized two-stage approaches such as Seyedpoor [9] and Vo-Duy et al. [26] who used modal strain energy. Mousavi and Gandomi [27] also proposed a new hybrid approach which utilized only one mode shape and its structural corresponding
eigen-value to conduct damage identification.
The large-scale engineering structures are of the im-portant ones in which damage identification accompa-nies many difficulties, challenging researchers to vali-date detection of damage precisely. Spatial structures are ones which are examined in three dimensions and are extensively used in large-span spaces without need to disruptive columns. Double-layer trusses are the most common type of structures which have been used extensively. There is approximately no limit on de-signing of this type of structures [28], for this reason researchers are eager to use this characteristic of the double-layers and have employed their numerical els to examine their achievements on large-span mod-els.
There are several instruments and operating mode shapes; as Wireless Sensor Networks (WSNs) that ob-tain dynamic parameters such as mode shapes in real-world truss structures. For example, Gao et al. [1] experimentally verified a 5.6m (18ft)-long spatial truss structure and showed that DLV can be utilized with low number of sensors and modes, while 40% stiff-ness reduction of single member was subjected by the change of modal properties.
Fallah et al. [18] proposed a two-stage approach to damage identification of large-scale trusses. But they could not find damages directly in noisy condition, so the damages were detected statistically. This article has employed DLV method as a candidate approach to localize damaged elements of large-scale double-layer truss structures directly in noisy condition. Further-more, Whale Optimization Algorithm (WOA) [29] was applied to quantify the damage severity of located el-ements. The reason why WOA was chosen is that due to that the problem has a large number of vari-ables and the many local solutions, WOA inherently has high local optima avoidance mechanism. Although loading DLV vectors into coordinate sensor leads to zero stress over damaged elements, it can result in zero stress over healthy elements. Therefore, normalized cu-mulative energy (NCE) [30] and normalized cucu-mulative stress (NCS) [31] were employed to estimate DLV, and in this article, exponential decreased stress (EDS) has been provided.
Sections of this study are organized as follows: in section 2, damage identification approach is presented. The whale optimization algorithm (WOA) is presented in section 3. Scenario studies are indicated in section 4. Finally, conclusion is given in section 5.
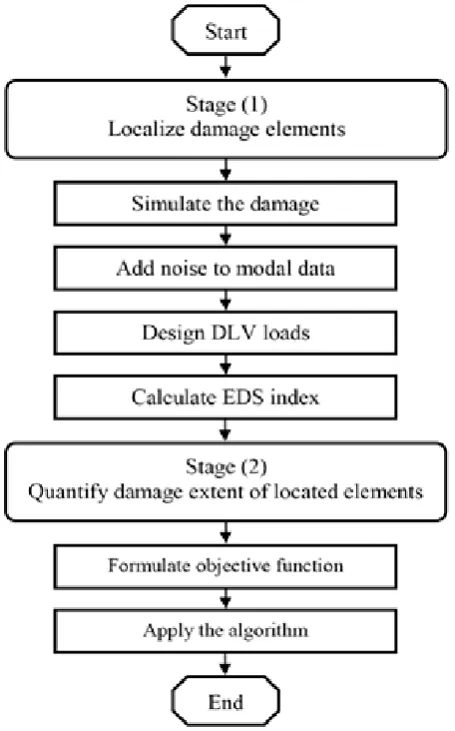
2.1. Localize Damaged Elements
2.1.1. Simulate the Damage
In this article, the damage was simulated by reduc-ing elasticity modulus of elements and considerreduc-ing β vector. Every array of β vector ranges between zero for completely intact element, and one for completely damaged one. The vector reduces elasticity modulus of structural elements as follows:
Edj= (1−βj)×Ej (1)
whereEdj andEj are elasticity moduli of thejth ele-ment in damaged and healthy conditions, respectively. Also the vectorβ varies in different considered scenar-ios.
Fig. 1. Damage identification approach.
2.1.2. Add Noise to Modal Data
In practice, avoiding the noise during measurement modal data such as mode shapes and natural frequen-cies is impossible. In this study, the error (noise) was added to the modal data as follows [15, 32]:
ωj=ωj×(1 +ηω×rand[−1,1]) (2)
ϕij=ϕij×(1 +ηϕ×rand[−1,1]) (3)
whereωj andϕijarejth natural frequency andith
de-gree of freedom inith mode shape for noisy condition, respectively. η is noise level whereηω andηϕ are 1% and 3%, respectively.
2.1.3. Design DLV Loads
Damage Locating Vectors (DLVs) were treated as static force vectors in DLV method. The static force vec-tors were designed through the null space of the change in flexibility matrix of intact and damaged structure. Loading the vectors into sensor coordinates resulted in in zero stress over damaged elements. The flexibility matrix of structure can be calculated by using modal properties as follows:
F=
ndof∑
j=1 1 ω2
j
×ϕj×ϕTj (4)
in which,ωj andϕj are thejth natural frequency and mass-normalized mode shape, respectively;ndof is the number indicating degree of freedom. Moreover, flex-ibility matrix can be fairly accurately estimated by a few low mode shapes, nm, as follows [8]:
˜
F≈
nm ∑
j=1 1 ω2
j
×ϕj×ϕTj (5)
Assume a linear system in the pre and post damage states. Suppose a number of created load distributions are applied to the intact and damaged structures and produce identical deformations. If all these loads are defined in L matrix, one can say:
( ˜Fh−F˜d)×L= 0 (6)
or
∆ ˜F×L= 0 (7)
whereF˜h andF˜d are flexibility matrices of intact and damaged states, respectively. There are two possible states for the above equations: first,∆ ˜F= 0, in this scenario the flexibility matrices of intact and damaged conditions are equal and there is no damage (which is contrary to our assumption) then∆ ˜F̸= 0; second,∆ ˜F
is not full rank andLcomprises the vectors that make the null space. The null space and its corresponding load vectors can be estimated by a singular value de-composition (SVD) as follows [23]:
∆ ˜F=UΣVT = [U] [
Sr1 0
0 Srn≈0
] [˜
VT
LT ]
(8)
andV˜T are a basis for the null space and the row space, respectively.
Therefore, every column ofLmatrix is designed as a Damage Locating Vector or DLV. Loading every col-umn of L matrix into the sensor coordinates leads to zero stress over the damaged elements. According to the position and number of the sensors, using one sin-gle DLV vector can probably locate excessive healthy elements in addition to the certain ones [23]. For this reason, NCS and NCE are provided [30, 31, 33]. In or-der to locate damaged elements, the accuracy of both NCE and NCS decreases by increasing the number of structural elements and decreasing the number of con-sidered modes.
2.1.4. Calculate EDS Index
In this section, EDS (Exponential Decreased Stress) has proposed to well localize the damaged elements of large-scale spatial structures. Studies on responses of structural stress showed that the most positive stresses of the damaged elements are between 0 and 1, while for other elements this amount equals to much larger than 1. EDS uses the point and decreases the stress of the damaged elements, and increases the stress of the healthy ones through exponentiation of stresses. When ith column ofLmatrix is applied to sensor coordinates, stress of elements is given by:
σie=Eeεe (9)
where
σei = [σi1, σ2i, . . . , σnei ]; e= [1,2, . . . , ne] (10)
where E and ε are elasticity modulus and strain, re-spectively, andneis the number of structural elements. EDS of every element is equal to:
EDSe= EDS
e
max k {EDS
k} (11)
where
EDSe= nDLV∏
i=1
σei2 (12)
wherenDLV is the DLVs’ number. It is clear that the high number of DLVs makes more desirable results.
2.2. Quantify Damage Severity of the Located Elements
2.2.1. Formulate the Objective Function
In this step, an objective function based on changes of modal flexibility of structure is utilized. Compared to
the modal data such as mode shapes and natural fre-quencies, structural flexibility is more sensitive to dam-age [10]. According to the mentioned points, Perera et al. [34] definedan objective function,f, as follows:
f = 1−M ACF LEX = 1− nm ∏
i=1
M ACF LEXi (13)
where
M ACF LEXi=
|FT
num,iFexp,i|2 (FT
num,iFnum,i)(FTexp,iFexp,i) (14)
in which,Fexpi andFnumi are experimental and analyti-cal flexibility vectors corresponding toith mode shape of structure, respectively, which collect the diagonal terms of the flexibility matrix; MAC is also a modal assurance criterion that measures correlation between two vectors Fnum
i and F
exp
i . If the correlated flexibil-ity vectorsequate each other, the MAC will have values next to 1. Values of objective function were normalized between zero and one that high and low values of them demonstrate high and low correlation, respectively.
2.2.2. Apply the Algorithm
Solving inverse optimization problem was utilized to assess the damage extent of the reported damaged ele-ments. Therefore, the whale optimization algorithm presented by Mirjalili and Lewis [29] was utilized. Hence, every located scenario was run by WOA and best (with least value of objective function) and aver-age solutions were reported. Details of the algorithm are given in section 3.
3. Whale
Optimization
Algorithm,
WOA
Whale Optimization Algorithm is a swarm-based tech-nique, introduced by Mirjalili and Lewis [29]. The WOA algorithm was proposed based on social behavior of humpback whales. WOA works based on bubble-net hunting strategy.
According to the strategy, the humpback whales hunt small fishes or group of krill close to surface, i.e., they swim around the prey about a shrinking circle and along a path similar to spiral simultaneously. There-fore, they make distinguishing bubbles along a circle or a path similar to shape of ‘9’. To update the location of the whales within optimization process, there is a 50% probability for choosing between the spiral model and shrinking encircling mechanism. The strategy was mathematically modeled as follows:
3.1. Shrinking Encircling Preys
not known a priori. Then, other search agents update their position in the current iteration,t, as follows:
D=|C·X∗(t)−X(t)| (15)
X(t+ 1) =X∗(t)−A·D (16)
whereX and X∗ are the position vector and the best position vector obtained so far, respectively; the signs || and· denote the absolute value and an element-by-element multiplication, respectively;C andA are fac-tor vecfac-tors that are given as:
A= 2a·rand−a (17)
C= 2·rand (18)
in which a decreases linear from 2 to 0 (in both ex-ploitation and exploration phases) andrandis a vector with random number in the range(0,1).
3.2. Spiral Bubble-net Feeding Behavior (Ex-ploitation Phase)
To imitate the movement of the whales which is simi-lar to helix, the distance between the hunt and whale is firstly calculated:
Dt=|X∗(t)−X(t)| (19)
Then, spiral equation is utilized between the loca-tion of hunt and whale as follows:
X(t+ 1) =D′·ebl·cos(2πl) +X∗(t) (20)
where l and b are a random number in the range of (−1,1)and a constant factor for determining the shape of the logarithm spiral, respectively.
In addition to the mentioned approach, the whales search randomly for hunt as follows:
3.3. Search for Hunt (Exploration Phase)
Humpback whales search randomly such thatsearch agent will be forced to replace far away from a ref-erence one if A with the random valueless than−1or greater 1 is used. So considering a selected search agent instead of the best one acquired so far, the location of search agent is updated as follows:
D=|C·Xrand−X| (21)
X(t+ 1) =Xrand−A·D (22)
in whichXrand is a random location.
In last iteration,X∗that is the best search agent in objective function terms is reported as solution of the problem.
4. Solving Scenario Sudies
In this section, to show the efficiency of EDS and the algorithm, two large-scale double-layer trusses such as
a 200-bar double layer grid and a 960-member double layer grid with some multiple scenarios are studied. For every example, three different multiple scenarios with four, six, and eight damaged elements are considered. Because the EDS values of elements change within each run of DLV, 30 independent runs of the DLV procedure were performed. Then, the mean values of the EDS values corresponding to all elements with various num-bers of modes (6, 8 and 10 first modes) were shown in every scenario of each example. To demonstrate the ef-ficiency of EDS, the results of NCE are displayed and compared to the results of EDS. Then detecting the suspected damaged elements, damage severity of these elements were assessed by WOA algorithm in noise-added condition. The best (least obtained value of objective function) and the average calculated results during ten runs were compared to the results of GA al-gorithm to show the ability of WOA alal-gorithm. More details about GA algorithm can be found in Ref. [2]. The eight first modes were used for all scenarios. For all examples, the number of iterations was assumed as 200 and population size was considered as 100. The results were reported to three decimal places. In the figure of each example, the damaged elements of sce-narios are bolded.
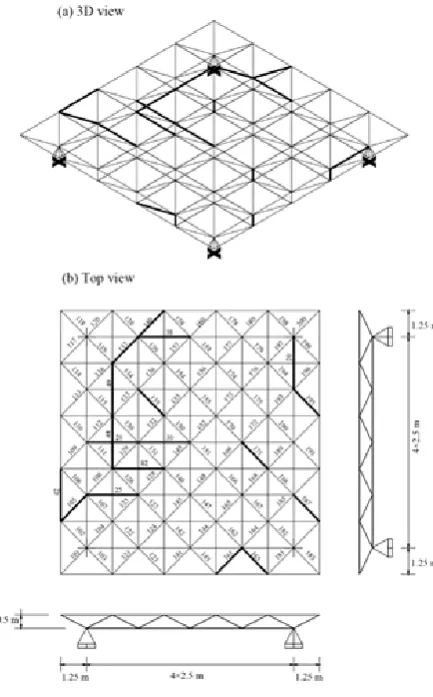
4.1. A 200-bar Double Layer Grid
In this study, the first example was adouble-layer grid truss with dimension of10×10m and height of 0.5m. This structure was investigated in the field of optimiza-tion by Gholizadeh et al. [35], considering frequencies constraints. The details of bottom, top, and diago-nal layers of the structure are illustrated in Fig. 2. The material density and the elasticity modulus were taken equal to 7850kg/m3 and 2.1 ×10¹¹N/m2, re-spectively. Non-structural masses of 19620kg were at-tached to each free node which were in the top layer. The cross-sectional areas were taken from the result of [35]. The details of three multiple damage scenarios are presented in Table 1.
4.1.1. Results and Discussions
For all scenarios, EDS and NCE of all elements in noisy condition are shown in the Figs. 3-5.
Fig. 2. A 200-bar double layer grid.
Table 1
Damage scenarios of the 200-bar double-layer grid.
Scenario Damaged elements Severity of damage
1 38, 82, 171, 195 0.25, 0.20, 0.30, 0.25
2 20, 29, 42, 48, 105, 137 0.10, 0.25, 0.20, 0.10, 0.25, 0.15
3 25, 30, 49, 135, 140, 161, 163, 187 0.25, 0.15, 0.10, 0.20, 0.25, 0.15, 0.08, 0.05
Fig. 4. The results of 200-bar double layer grid for second scenario in noisy condition. a) EDS. b) NCE.
Fig. 5. The results of 200-bar double layer grid for third scenario in noisy condition. a) EDS. b) NCE.
Tables 2-4 show damage severities of reported dam-aged elements assessed by WOA algorithm during ten runs. Furthermore, Table 5 shows damage severities of the elements estimated by GA algorithm.
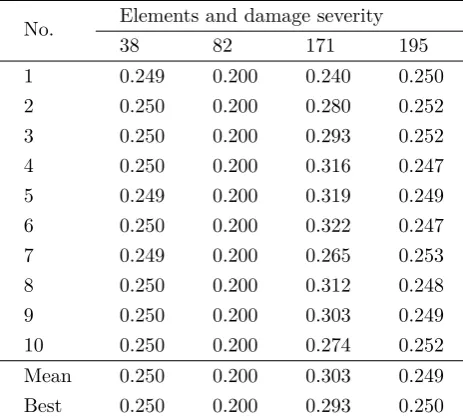
Table 2
Damage severities of the suspected damaged elements assessed by WOA for the first scenario of the 200-bar truss structure.
No. Elements and damage severity
38 82 171 195
1 0.249 0.200 0.240 0.250
2 0.250 0.200 0.280 0.252
3 0.250 0.200 0.293 0.252
4 0.250 0.200 0.316 0.247
5 0.249 0.200 0.319 0.249
6 0.250 0.200 0.322 0.247
7 0.249 0.200 0.265 0.253
8 0.250 0.200 0.312 0.248
9 0.250 0.200 0.303 0.249
10 0.250 0.200 0.274 0.252
Mean 0.250 0.200 0.303 0.249
Best 0.250 0.200 0.293 0.250
Table 3
Damage severities of the suspected damaged elements estimated by WOA for the second scenario of the 200-bar double-layer grid.
No. Elements and damage severity
20 29 42 48 105 137
1 0.099 0.234 0.206 0.095 0.237 0.165 2 0.102 0.255 0.194 0.111 0.236 0.101 3 0.100 0.250 0.203 0.098 0.247 0.152 4 0.097 0.284 0.197 0.095 0.279 0.168 5 0.100 0.173 0.199 0.111 0.219 0.005 6 0.099 0.268 0.212 0.088 0.234 0.239 7 0.100 0.227 0.197 0.108 0.230 0.153 8 0.101 0.240 0.189 0.093 0.317 0.196 9 0.100 0.158 0.192 0.110 0.247 0.132 10 0.101 0.238 0.185 0.107 0.283 0.176 Mean 0.100 0.233 0.197 0.102 0.253 0.149 Best 0.100 0.250 0.203 0.098 0.247 0.152
According to Tables 2-5, the maximum errors corre-sponding to the damaged elements are 0.017 and 0.026 for WOA and GA, respectively.
the case with its modal data having the least difference with experimental modal data. This scenario is or is not the exact answer (depending on the amount of the noise, structure characteristics, and assumed scenario).
On the other hand, the best and the average values are choices according to value of cost function. Therefore, this is usual that some of the best values are not better than the average.
Table 4
Damage severities of suspected damaged elements estimated by WOA for the third scenario of the 200-bar double layer grid.
No. Elements and damage severity
25 30 49 135 140 161 163 187
1 0.252 0.148 0.095 0.216 0.249 0.172 0.031 0.029
2 0.250 0.148 0.100 0.216 0.246 0.154 0.055 0.062
3 0.250 0.153 0.103 0.171 0.253 0.156 0.070 0.052
4 0.251 0.148 0.099 0.224 0.249 0.161 0.071 0.052
5 0.249 0.156 0.109 0.140 0.255 0.131 0.121 0.085
6 0.247 0.152 0.103 0.192 0.252 0.121 0.129 0.069
7 0.252 0.147 0.098 0.207 0.248 0.141 0.087 0.036
8 0.249 0.147 0.102 0.222 0.248 0.117 0.139 0.070
9 0.250 0.148 0.099 0.214 0.249 0.153 0.081 0.049
10 0.250 0.149 0.102 0.215 0.249 0.120 0.131 0.069
Mean 0.250 0.149 0.101 0.201 0.250 0.143 0.092 0.057
Best 0.250 0.148 0.099 0.214 0.249 0.153 0.081 0.049
Table 5
Damage severities of suspected damaged elements estimated by GA for the all scenarios of the 200-bar double layer grid.
Scenario Damage severity
1
Elements 38 82 171 195
Mean 0.260 0.200 0.319 0.249
Best 0.251 0.201 0.288 0.250
2
Elements 20 29 42 48 105 137
Mean 0.126 0.253 0.200 0.100 0.240 0.154
Best 0.104 0.249 0.197 0.104 0.251 0.149
3
Elements 25 30 49 135 140 161 163 187
Mean 0.272 0.154 0.105 0.193 0.275 0.140 0.110 0.065
Best 0.249 0.156 0.102 0.189 0.255 0.158 0.067 0.056
4.2. A 960-member Double-layer Grid
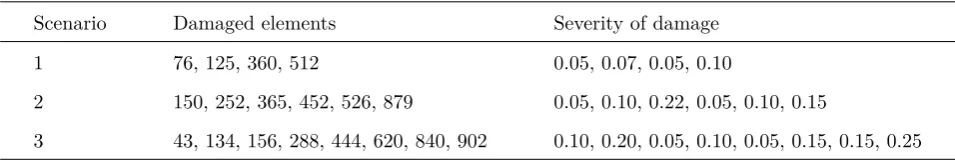
The second practiced double-layer truss included 263 joints and 960 members, as displayed in Fig. 6. This structure was utilized by [36] to acquire the optimum design of the structures. The material density was con-sidered as 7860kg/m3 and the elasticity modulus was equal to 2.04×10¹¹N/m2. Cross-sectional area of all
elements was equal to 72.16cm2. The details of three multiple damage scenarios are given in Table 6.
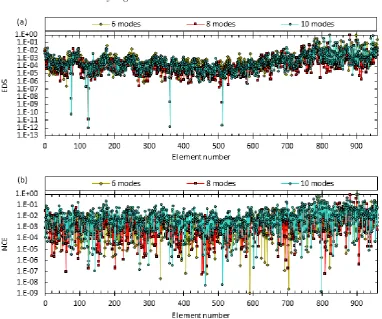
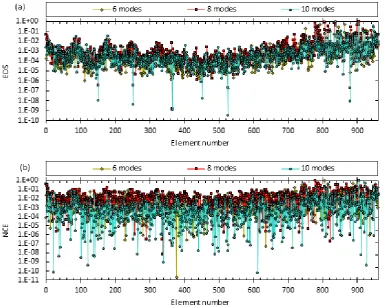
4.2.1. Results and Discussions
For all scenarios, EDS and NCE of all elements in noisy condition are shown in the Figs. 7-9.
Table 6
Damage scenarios of the 960-member double layer grid.
Scenario Damaged elements Severity of damage
1 76, 125, 360, 512 0.05, 0.07, 0.05, 0.10
2 150, 252, 365, 452, 526, 879 0.05, 0.10, 0.22, 0.05, 0.10, 0.15
Fig. 6. The 960-member double-layer grid.
Fig. 8. The results of 960-member double-layer grid for second scenario in noise-added condition. a) EDS. b) NCE.
Tables 7-9 show damage severities of the suspected damaged elements assessed by WOA algorithm within ten runs. Moreover, Table 10 shows damage severities of the elements estimated by GA algorithm.
Table 7
Damage severities of the suspected damaged elements assessed by WOA for the first scenario of the 960-member double-layer grid.
No. Elements and damage severity
76 125 360 512
1 0.040 0.072 0.045 0.119
2 0.052 0.069 0.051 0.096
3 0.055 0.063 0.060 0.077
4 0.048 0.070 0.052 0.099
5 0.065 0.070 0.067 0.099
6 0.060 0.087 0.055 0.173
7 0.058 0.070 0.058 0.102
8 0.042 0.072 0.045 0.109
9 0.059 0.073 0.061 0.110
10 0.052 0.067 0.050 0.093
Mean 0.053 0.071 0.054 0.108
Best 0.048 0.070 0.052 0.099
Table 8
Damage severities of the suspected damaged elements assessed by WOA for the second scenario of the 960-member double-layer grid.
No. Elements and damage severity
150 252 365 452 526 879
1 0.050 0.105 0.222 0.066 0.110 0.149 2 0.061 0.095 0.207 0.070 0.091 0.148 3 0.055 0.091 0.215 0.006 0.088 0.152 4 0.050 0.099 0.210 0.055 0.093 0.151 5 0.033 0.095 0.235 0.028 0.094 0.152 6 0.053 0.090 0.216 0.001 0.093 0.154 7 0.048 0.100 0.217 0.057 0.095 0.150 8 0.051 0.099 0.224 0.050 0.100 0.150 9 0.042 0.103 0.240 0.005 0.108 0.153 10 0.052 0.112 0.219 0.146 0.116 0.145
Mean 0.049 0.099 0.220 0.049 0.099 0.150 Best 0.051 0.099 0.224 0.050 0.100 0.150
Table 9
Damage severities of the suspected damaged elements assessed by WOA for the third scenario of the 960-member double-layer grid.
No. Elements and damage severity
43 134 156 288 444 620 840 902
1 0.099 0.200 0.044 0.099 0.062 0.165 0.150 0.251
2 0.101 0.198 0.049 0.101 0.023 0.161 0.166 0.252
3 0.107 0.218 0.067 0.117 0.000 0.168 0.161 0.252
4 0.097 0.194 0.051 0.096 0.053 0.171 0.140 0.248
5 0.096 0.192 0.059 0.097 0.021 0.135 0.149 0.248
6 0.098 0.199 0.056 0.100 0.062 0.122 0.143 0.248
7 0.091 0.180 0.000 0.074 0.092 0.193 0.138 0.255
8 0.105 0.212 0.057 0.108 0.034 0.112 0.147 0.249
9 0.101 0.195 0.053 0.099 0.057 0.121 0.153 0.249
10 0.104 0.203 0.051 0.106 0.090 0.146 0.150 0.254
Mean 0.100 0.199 0.049 0.100 0.049 0.149 0.150 0.251
Best 0.097 0.194 0.051 0.096 0.053 0.171 0.140 0.248
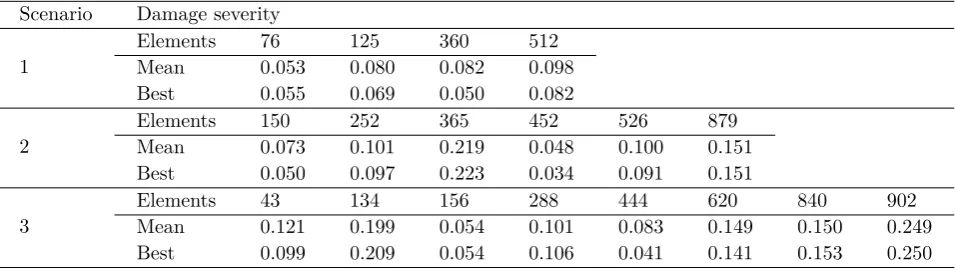
Table 10
Damage severities of the suspected damaged elements assessed by GA for the all scenarios of the 960-member double-layer grid.
Scenario Damage severity
1
Elements 76 125 360 512
Mean 0.053 0.080 0.082 0.098
Best 0.055 0.069 0.050 0.082
2
Elements 150 252 365 452 526 879
Mean 0.073 0.101 0.219 0.048 0.100 0.151
Best 0.050 0.097 0.223 0.034 0.091 0.151
3
Elements 43 134 156 288 444 620 840 902
Mean 0.121 0.199 0.054 0.101 0.083 0.149 0.150 0.249
According to the Tables 7-10, the maximum errors corresponding to the damaged elements are 0.021 and 0.033 for WOA and GA, respectively. The part (a) of figs. 3-5 show that the EDS of the damaged elements are less than that of the others in noisy condition and they are found as really damaged elements. Parts (b) of these Figures demonstrate that the NCE of some healthy elements temporarily decreased and the real damaged elements are not accurately found according to the Figures.
5. Conclusions
In this paper, a two-stage approach based on DLV (Damage Locating Vector) method and WOA (Whale Optimization Algorithm) for damage identification of large-scale double-layer truss structures was presented. In the first stage, DLV method by using Exponential Decreased Stress (EDS) according to stress of struc-tural elements located the damaged elements. In the second stage, WOA algorithm estimated damage sever-ity of the potential damaged elements. Scenario studies including two double-layer grid truss structures were investigated by different multiple scenarios. The re-sults of scenario studies obtained from EDS index and WOA algorithm were compared to the results of NCE (Normalized Cumulative Energy) and GA algorithm, respectively. Although there were high numbers of structural elements and low numbers of used mode shapes, it was concluded that EDS and WOA are effi-cient to locate and quantify the damaged elements in noise-added condition. Furthermore, according to the result of scenario studies, EDS requires lower number of modes than NCE does. The errors in the computa-tion of the damage severity were 0.021 and 0.033 con-sidering eight first modes corresponding to WOA and GA, respectively.
References
[1] Y. Gao, B.F. Spencer Jr, D. Bernal, Experimental verification of the flexibility-based damage locat-ing vector method, J. Eng. Mech., 133(10) (2007) 1043-1049.
[2] S.R. Hoseini Vaez, N. Fallah, Damage detection of thin plates using GA-PSO algorithm based on modal data, Arab. J. Sci. Eng., 42(3) (2017) 1251-1263.
[3] C.R. Farrar, K. Worden, An introduction to struc-tural health monitoring. Philosophical Transac-tions of the Royal Society of London A: Mathe-matical, Phys. Eng. Sci., 365(1851) (2007) 303-315.
[4] H. Sohn, C.R. Farrar, F.M. Hemez, D.D. Shunk, D.W. Stinemates, B.R. Nadler, J.J. Czarnecki,
A review of structural health monitoring litera-ture: 1996-2001. Los Alamos National Labora-tory, USA, (2004).
[5] Y.J. Yan, L. Cheng, Z.Y. Wu, L.H. Yam, Develop-ment in vibration-based structural damage detec-tion technique, Mech. Syste. Sig. Process., 21(5) (2007) 2198-2211.
[6] O.S. Salawu, Detection of structural damage through changes in frequency: a review, Eng. Struct., 19(9) (1997) 718-723.
[7] A. Messina, E.J. Williams, T. Contursi, Structural damage detection by a sensitivity and statistical-based method, J. Sound Vib., 216(5) (1998) 791-808.
[8] A.K. Pandey, M. Biswas, Damage detection in structures using changes in flexibility, J. Sound Vib., 169(1) (1994) 3-17.
[9] S.M. Seyedpoor, A two stage method for struc-tural damage detection using a modal strain en-ergy based index and particle swarm optimization, Int. J. Non-Linear Mech., 47(1) (2012) 1-8.
[10] J. Zhao, J.T. DeWolf, Sensitivity study for vibra-tional parameters used in damage detection, J. Struct. Eng., 125(4) (1999) 410-416.
[11] A. Kaveh, S.R., Hoseini Vaez, P. Hosseini, En-hanced vibrating particles system algorithm for damage identification of truss structures, Scientia Iranica, Trans. Civ. Eng., 26(1) (2019) 246-256.
[12] E.T. Lee, H.C. Eun, Damage detection using measurement response data of beam structure subject to a moving mass, Latin American J. Solids Struct., 12(12) (2015) 2384-2402.
[13] P.S. Sánchez, P.L. Negro, P. García-Fogeda, Vibration-Based Method for Damage Detection at Welded Beams and Rods, Latin American J. Solids Struct., 13(13) (2016) 2336-2355.
[14] J. Xiang, Zhong, Y., Chen, X., and He, Z., Crack detection in a shaft by combination of wavelet-based elements and genetic algorithm, Int. J. Solids Struc., 45(17) (2008) 4782-4795.
[15] A. Kaveh, S.R. Hoseini Vaez, P. Hosseini, N. Fal-lah, Detection of damage in truss structures using Simplified Dolphin Echolocation algorithm based on modal data, Smart Struc. Syst., 18(5) (2016) 983-1004.
[17] N. Fallah, S.R. Hoseini Vaez, H. Fasihi, Damage identification in laminated composite plates using a new multi-step approach, Steel Compos. Struct., 29(1) (2018) 139-149.
[18] N. Fallah, S.R. Hoseini Vaez, A. Moham-madzadeh, Multi-damage identification of large-scale truss structures using a two-step approach, J. Build. Eng., 19 (2018) 494-505.
[19] S.R. Hoseini Vaez, N. Fallah, Damage identifica-tion of a 2D frame structure using two-stage ap-proach, J. Mech. Sci. Technol., 32(3) (2018) 1125-1133.
[20] O. Begambre, J.E. Laier, A hybrid Particle Swarm Optimization-Simplex algorithm (PSOS) for structural damage identification, Adv. Eng. Software, 40(9) (2009) 883-891.
[21] K. Moslem, R. Nafaspour, Structural damage de-tection by genetic algorithms, AIAA J., 40(7) (2002) 1395-1401.
[22] H.Y. Guo, Z.L. Li, A two-stage method to identify structural damage sites and extents by using evi-dence theory and micro-search genetic algorithm, Mec. Syst. Signal Process., 23(3) (2009) 769-782.
[23] D. Bernal, Load vectors for damage localization, J. Eng. Mech., 128(1) (2002) 7-14.
[24] S.M. Seyedpoor, M. Montazer, A damage iden-tification method for truss structures using a flexibility-based damage probability index and dif-ferential evolution algorithm, Inverse Prob. Sci. Eng., 24(8) (2016) 1303-1322.
[25] S.M. Seyedpoor, M. Montazer, A two-stage dam-age detection method for truss structures using a modal residual vector based indicator and dif-ferential evolution algorithm, Smart Struct. Syst., 17(2) (2016) 347-361.
[26] T. Vo-Duy, V. Ho-Huu, H. Dang-Trung, T. Nguyen-Thoi, A two-step approach for damage detection in laminated composite structures us-ing modal strain energy method and an improved differential evolution algorithm, Compos. Struct., 147 (2016) 42-53.
[27] M. Mousavi, A.H. Gandomi, A hybrid damage detection method using dynamic-reduction trans-formation matrix and modal force error, Eng. Struct., 111 (2016) 425-434.
[28] H. Agerskov, Optimum geometry design of double-layer space trusses, J. Struct. Eng., 112(6) (1986) 1454-1463.
[29] S. Mirjalili, A. Lewis, The whale optimization al-gorithm, Adv. Eng. Software, 95 (2016) 51-67.
[30] T. Vo-Duy, N. Nguyen-Minh, H. Dang-Trung, A. Tran-Viet, T. Nguyen-Thoi, Damage assess-ment of laminated composite beam structures us-ing damage locatus-ing vector (DLV) method, Front. Struct. Civ. Eng., 9(4) (2015) 457-465.
[31] S.T. Quek, V.A. Tran, X.Y. Hou, W.H. Duan, Structural damage detection using enhanced dam-age locating vector method with limited wireless sensors, J. Sound Vib., 328(4-5) (2009) 411-427.
[32] J.D. Villalba-Morales, J.E. Laier, Assessing the performance of a differential evolution algorithm in structural damage detection by varying the ob-jective function, Dyna, 81(188) (2014) 106-115.
[33] S.H. Sim, S.A. Jang, B.F. Spencer Jr, J. Song, Reliability-based evaluation of the performance of the damage locating vector method, Probab. Eng. Mech., 23(4) (2008) 489-495.
[34] R. Perera, A. Ruiz, C. Manzano, Performance as-sessment of multicriteria damage identification ge-netic algorithms, Comput. Struct., 87(1-2) (2009) 120-127.
[35] S. Gholizadeh, E. Salajegheh, P. Torkzadeh, Structural optimization with frequency con-straints by genetic algorithm using wavelet ra-dial basis function neural network, J. Sound Vib., 312(1-2) (2008) 316-331.