Http://www.ijetmr.com©International Journal of Engineering Technologies and Management Research [79]
A STUDY ON RISK & RETURN ANALYSIS OF SELECTED SECURITIES
IN INDIA
Dr. P. Subramanyam 1, Dr. Nalla Bala Kalyan 2
1 Associate Professor and HOD, Annamacharya Institute of Technology & Sciences, Rajampet,
Kadapa, India
2 Assistant Professor, Department of Management Studies, Sri Venkateswra College of
Engineering, Karakambadi Road, Tirupati-517507, India
Abstract:
The main objective of the study is to give investors a basic idea of investing into the mutual funds and encourage them to invest in those areas where they can maximize the return on their capital. The research provided an interesting insight into awareness about the mutual funds, risk taking abilities of investors and investment options preferred etc. The Indian Capital has been increasing tremendously during the last few years. With reforms of economy, reforms of investing policy, reforms of public sector and reforms of financial sector, the economy has been opened up and many developments have been taking place in the Indian money market and Capital market. In order to help the small investors, mutual fund industry has come to occupy an important place. This study helps us to understand how the companies diversify themselves in different sectors and in different companies to maximize the returns and to minimize the risks involved in it.
Keywords: India; Risk & Return; Securities; Stock.
Cite This Article: Dr. P. Subramanyam, and Dr. Nalla Bala Kalyan. (2018). “A STUDY ON RISK & RETURN ANALYSIS OF SELECTED SECURITIES IN INDIA.” International Journal of
Engineering Technologies and Management Research, 5(4), 79-86. DOI:
https://doi.org/10.29121/ijetmr.v5.i4.2018.211.
1. Introduction
Http://www.ijetmr.com©International Journal of Engineering Technologies and Management Research [80]
1.1.Security Analysis
Investors have different motives for investing. Leaving aside a few who love the power and prestige of holding a major share or a minor share in the company, the majority of the investors have one of the following motives:
• Regular income either in the form of dividend or interest • Capital gains or capital appreciation
• Hedge against inflation, a positive real rate of return
• Safety of funds and regularity of payment of interest and principal
• Liquidity and marketability in the sense that investor can convert his investments into cash or liquidity and back again into investments when cash is not needed
Security Analysis involves an examination of expected return and accompanying risks. The first three motives of income, capital appreciation and a positive hedge against inflation refers to the expected return. The last two motives of investor lead to the risks involved in the investments. These risks are due to uncertainty of returns, regularity of returns, safety of funds, marketability or lack of it, etc. Investors generally desire to have the maximum return possible, as they like returns, but they dislike risk, and the extent of risk varies from investor to investor. But the return depends on the extent of risk that the investor takes. Investments are made based on security analysis and decisions involved are what securities to be bought or sold and the extent of proportion of funds to be invested in each.
1.2.Stock market
The stock market is simply a term for the overall market or industry that is concerned with buying and selling company’s stock, both private and publicly traded securities. The stock market does many things. It helps to set prices of stocks. The more a stock is traded on the market and the more in demand the stock, the higher is its value. Having a stock market that is interconnected with stock markets around the world helps traders and investors to see how specific stocks are doing. The stock market is mainly present to create money. Through the market, investors - both companies and individuals - can buy stocks, which effectively make them own a small part of a company. If the company prospers, investors are rewarded with dividends and profits. Companies, by becoming public and offering stocks to the public, can raise money and improve their profile through business expansions which can help them make great profit.
2. Scope of the Study
• The analysis is focused on ten companies • The study is merely for academic purpose
• Study restricted to a smaller sample size because of lack of time and resources
• The recommendations made may not be a perfect prediction of the future as technical analysis is not an absolutely accurate practice
• The all portfolio consists of risky assets there no risk-free assets.
Http://www.ijetmr.com©International Journal of Engineering Technologies and Management Research [81] • The holding period for risky assets was for one month period i.e. shares were assumed to be purchased at the first day and sold at the second consecutive day and average return for one month is considered.
• An equal no of shares i.e. I (one) share of each script is assumed to be purchased from the secondary market.
3. Objectives of the Study
The main objective of the study is to know the performance of equities of infrastructure sector 1) To study the return and risk assessments of equities
2) To study the co-efficient of variation of equities
3) To suggest the investors how to invest, when to invest in equities
4) To measure the risks of selected securities with the help of tools and techniques
4. Research Methodology
Data Analysis: The collected data is sorted out and analyzed to prepare the final report. The tools and techniques used in the analysis are
1) RISK=√∑D2/(n-1)
2) Return =close price-previous price/previous price*100 3) Co-efficient of variation=Risk/Return
4) Difference = Return-Average 5) D2 =Difference*Difference
5. Data Analysis & Interpretation
Table 1: A Statement Showing Risk and Return of GMRINFRA
Symbol Series Date Prev. Close
Open Price
Close Price
Ret. Avg. Diff. D2
Http://www.ijetmr.com©International Journal of Engineering Technologies and Management Research [82] GMRINFRA EQ 23-Feb-17 22.15 22 22 -77.9 -78.235 0.335 0.112225 GMRINFRA EQ 24-Feb-17 22.25 22.1 22.1 -78.7 -78.235 -0.465 0.216225 GMRINFRA EQ 27-Feb-17 22.1 22 21.3 -78.9 -78.235 -0.665 0.442225 GMRINFRA EQ 28-Feb-17 21.1 21 20.35 -79.65 -78.235 -1.415 2.002225
TOTAL -78.235 6.9555
AVERAGE RETURN=- -78.235 RISK=√∑D2/ (n-1) =0.60
Figure 1: Risk and Return of GMRINFRA
Interpretation
The above table shows the calculation of risk and return of GMRINFRA Company for a period of one month. The average return is -78.235 and risk is 0.60. The highest market price is 22.65 on 01-Feb-17. The lowest market price is 20.35 on 28-Feb-17
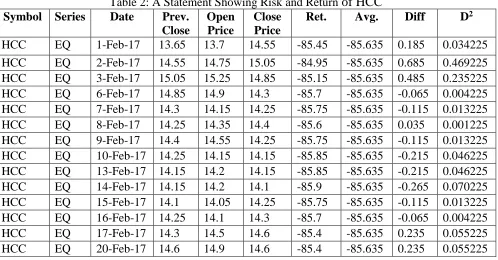
Table 2: A Statement Showing Risk and Return of HCC
Symbol Series Date Prev. Close
Open Price
Close Price
Ret. Avg. Diff D2
HCC EQ 1-Feb-17 13.65 13.7 14.55 -85.45 -85.635 0.185 0.034225
HCC EQ 2-Feb-17 14.55 14.75 15.05 -84.95 -85.635 0.685 0.469225 HCC EQ 3-Feb-17 15.05 15.25 14.85 -85.15 -85.635 0.485 0.235225 HCC EQ 6-Feb-17 14.85 14.9 14.3 -85.7 -85.635 -0.065 0.004225 HCC EQ 7-Feb-17 14.3 14.15 14.25 -85.75 -85.635 -0.115 0.013225 HCC EQ 8-Feb-17 14.25 14.35 14.4 -85.6 -85.635 0.035 0.001225 HCC EQ 9-Feb-17 14.4 14.55 14.25 -85.75 -85.635 -0.115 0.013225 HCC EQ 10-Feb-17 14.25 14.15 14.15 -85.85 -85.635 -0.215 0.046225 HCC EQ 13-Feb-17 14.15 14.2 14.15 -85.85 -85.635 -0.215 0.046225 HCC EQ 14-Feb-17 14.15 14.2 14.1 -85.9 -85.635 -0.265 0.070225 HCC EQ 15-Feb-17 14.1 14.05 14.25 -85.75 -85.635 -0.115 0.013225 HCC EQ 16-Feb-17 14.25 14.1 14.3 -85.7 -85.635 -0.065 0.004225 HCC EQ 17-Feb-17 14.3 14.5 14.6 -85.4 -85.635 0.235 0.055225 HCC EQ 20-Feb-17 14.6 14.9 14.6 -85.4 -85.635 0.235 0.055225
0% 20% 40% 60% 80% 100%
Http://www.ijetmr.com©International Journal of Engineering Technologies and Management Research [83] HCC EQ 21-Feb-17 14.6 14.6 14.4 -85.6 -85.635 0.035 0.001225 HCC EQ 22-Feb-17 14.4 14.5 14.45 -85.55 -85.635 0.085 0.007225 HCC EQ 23-Feb-17 14.45 14.6 14.3 -85.7 -85.635 -0.065 0.004225 HCC EQ 24-Feb-17 14.3 14.3 14.1 -85.9 -85.635 -0.265 0.070225 HCC EQ 27-Feb-17 14.1 14.3 14.25 -85.75 -85.635 -0.115 0.013225 HCC EQ 28-Feb-17 14.25 14.2 14 -86 -85.635 -0.365 0.133225
TOTAL -85.635 1.2905
Average Return=--85.635 RISK=√∑D2/ (n-1) =0.26
Graph 2:
5.1.A Statement Showing Co-Efficient of Variation
COV=Risk/Return
Table 3:
COMPANY RETURN RISK COV
GMR INFRA -78.235 0.6 -0.007669202
HCC -85.635 0.23 -0.002685818
NCC -67.9425 1.6 -0.023549325
LITL -89.255 0.3 -0.003361156
IVRCL -79.7 0.89 -0.011166876
SIMPLEX INFRA -73.275 0.86 -0.011736609
GAMMN INFRA -88.9975 0.27 -0.003033793
REL INFRA 255.1925 18.13 0.071044408
RAMKY INFRA -37.1475 2.97 -0.079951545
UNITY INFRA 69.7925 1.34 0.019199771
COV 0
0.02 0.04 0.06 0.08
RELINFRAUNITY INFRA
Http://www.ijetmr.com©International Journal of Engineering Technologies and Management Research [84]
List of Companies with Positive COV
Table 4:
Graph 3:
6. Findings
The present project work has been undertaken to study Security Analysis for a period of one month. During this study the following facts have been identified.
1) The company GMR INFRA has an average return of -78.235 and risk 0.6 of the highest price during the month was 22.65 on 1-Feb-17. The lowest price during the month was 20.35 on 28-Feb-17. The co-efficient of variation is -0.007669202.
2) The company HCC has an average return of -85.635 and risk of 0.23. The highest price during the month was 14.85 on 3-Feb-17. The lowest price during the month was 14 on 28-Feb-17. The co-efficient of variation is -0.002685818.
3) The company NCC has an average return of -67.9425 and risk of 1.6. The highest price during the month was 34.75 on 1-Feb-17. The lowest price during the month was 29.9 on 11and12-Feb-17. The co-efficient of variation is -0.023549325.
4) The company LITL has an average return of -89.255 and risk of 0.30. The highest price during the month was 11.65 on 28-Feb-17. The lowest price during the month was 10.5 on 24-Feb-17. The co-efficient of variation is -0.003361156.
5) The company IVRCL has an average return of -79.7 and risk of 0.89. The highest price during the month was 21.75 on 1-Feb-17. The lowest price during the month was 19.4 on 09-Feb-17. The co-efficient of variation is -0.011166876.
6) The company SIMPLEX INFRA has an average return of -73.275 and risk of 0.86. The highest price during the month was 27.45 on 2-Feb-17. The lowest price during the month was 24 on 28-Feb-17. The co-efficient of variation is -0.011736609.
7) The company GAMMN INFRA has an average return of -88.9975 and risk of 0.27. The highest price during the month was 11.45 on 2-Feb-17. The lowest price during the month was 10.7 on 12and16-Feb-17. The COV is -0.003033793.
0% 100%
RELINFRA UNITY INFRA
COV
COV
COMPANY COV
RELINFRA 0.071044408
Http://www.ijetmr.com©International Journal of Engineering Technologies and Management Research [85] 8) The company REL INFRA has an average return of 255.1925 and risk of 18.13. The highest price during the month was 382.45 on 22-Feb-17. The lowest price during the month was 329.15 on 03-Feb-17. The co-efficient of variation is 0.071044408.
9) The company RAMKY has an average return of -37.1475 and risk of 2.97. The highest price during the month was 66.65 on 23-Feb-17. The lowest price during the month was 54.2 on 01-Feb-17. The COV is -0.079951545.
10)The company UNITY INFRA has an average return of 69.7925 and risk of 1.34. The highest price during the month was 33.05 on 22-Feb-17. The lowest price during the month was 28.65 on 10-Feb-17. The co-efficient of variation is 0.019199771.
7. Suggestions
The suggestions of the study are as follows:
1) Feb.2017 is favor for investor to invest in Reliance infrastructure as it gives 255.19 returns. 2) Reliance and Unity infrastructure has high idle of COV better to use it in operating cycle
for getting results.
3) Investment in Reliance and unity infrastructure is favor for long term investment.
4) From this analysis it is better not to go with the RAMKY infrastructure as it yields negative returns of the Feb 2017.
5) The eight infrastructure companies are not performed well the month of Feb 2017. So investment in infrastructure industry is risky so better to invest in other sector.
8. Conclusion
The study risk return investigation helps the investor to pick up the securities based on his choice. The study of this kind provides information about the performance of various stocks in the market in terms of risk and return. This paper emphasizes on the market fluctuations relations to the prices of Scrip’s though it is difficult to observe a pattern for the price movements but efforts have been taken using fundamental analysis and technical analysis. Using fundamental analysis, it is observed that the financial position and performance of the firms are in correlation with present market prices. According to technical analysis, the historical data taken is used to observe the trends followed by the Scrip’s. However, we cannot say that any one method is sufficient to analyze and interpret the fluctuations but they help the investor to define the trends to some extent. Overall we can say that the project is satisfied.
References
[1] Fama E, French K. The Cross Section of Expected Stock Return, Journal of Finance. 1992; 427-465
[2] Dhankar RS, Kumar R. Relevance of CAPM to Indian Stock Market, ICFAI. 2007
[3] Mythri B, Radhakrishna Nayak. Selection of Stock: A Practical Study on Selected Software Companies, Journal of Business and Management. 2016
[4] Syndey C. Ludvigson, Serena Ng “The empirical risk return relation: a factor analysis approach” National bureau of economic research 1050 Massachusetts Avenue, Cambridge, MA 02138 [5] Prasanna Chandra, financial management: Theory and Practice, Fourth edition, Tata McGraw- Hill
Http://www.ijetmr.com©International Journal of Engineering Technologies and Management Research [86] [6] Arindam Mandal and Prasun Bhattacharje, “The Indian Stock Market and the Great Recession”-
Theoretical and Applied Economics Volume XIX (2012), No. 3(568), pp. 59-76 [7] I M Pandey.,2010, “Financial Management 10th Edition” Vikas Publishing House
[8] Chikashi Tsuji (2014). An Investigation of the Relationship between Risk and Return: The Case of the Latin American Stock Markets. Accounting and Finance Research, 3(1)