Research article
International Journal of Heterocyclic Chemistry,
Vol. 8, No. 4, pp. 1-15 (Autumn 2018)
© Islamic Azad University, Ahvaz Branch
http://ijhc.iauahvaz.ac.ir
Study of structural effects of binary mixtures of
Nitrobenzene and 2-Alcohols
Mohammad Almasi
Department of Chemistry, College of Science, Ahvaz Branch, Islamic Azad University, Ahvaz, Iran; E-mail addresses:
ABSTRACT
Densities, structural effects and viscosities of binary nonelectrolyte
systems including nitrobenzene + 2-propanol, 2-butanol and 2-pentanol
at temperatures (293.15 to 323.15) K and normal atmospheric pressure
were measured using an Anton-Paar SVM 3000 stabinger viscometer.
Excess molar volumes VEm and viscosity deviations Δη were calculated
and correlated by the Redlich-Kister equation to estimate the standard
uncertainty. These values are negative over the full range of composition
for all studied mixtures. Free volume theory coupled with the
Peng-Robinson equation of state was used to correlate
liquid viscosities of pure compounds and binary mixtures. The
agreement between measured viscosity data and values calculated from
this model is within experimental uncertainties.
Keywords: Density; Viscosity; Free volume theory; Peng-Robinson equation
Introduction
2:: International Journal of Heterocyclic Chemistry, Vol. 8 No. 4, pp. 1-15 (Autumn 2018 )
density measurements. Excess molar volumes can also provide information on possible interactions between components of a binary mixture, such as molecular associations and dipole– dipole and induced dipole–dipole interactions [1]. The interest in studying thermodynamic properties of mixtures containing nitrobenzene is because of their inherent toxicity and hazardous effects to human health and also because of widespread industrial use [2]. This study of the density and viscosity of binary mixtures formed by nitrobenzene with selected 2-alkanols continues our recent systematic studies of the thermodynamic and transport properties of binary mixtures [3,4]. A literature survey reveals that some thermodynamic and transport properties of binary mixtures containing nitrobenzene have been studied [5].
Our approach is to correlate the viscosity of the binary mixtures with the free volume theory which relates the viscosity to the probability of occurrence of an empty neighboring site into which a molecule can jump. This probability is exponentially related to the free volume of the liquids. In this study, the free-volume theory (FVT) has been coupled with the Peng–Robinson equation of state to the correlation of viscosities of pure compounds and binary mixtures. Applicability of this model to the mixtures examined in this work has not yet been verified in the literature.
The importance of free-volume theories for the calculation of viscosities owes to the following facts: (i) Their equations are simple and involve only few parameters; (ii) The parameters have, almost always, a physical meaning; (iii) They can be used over wide ranges of temperature and pressure; (iv) The theories are based on statistical mechanics, therefore, giving them a theoretical background and, (v) they may easily be extended to multicomponent systems [6].
Experimental Materials
All pure materials were obtained from Merck with mass purity >99% and were used as purchased without further purification. Measured densities and viscosities at T= 298.15 K are presented in Table 1 along with the data from the literature [7,8 ]. The largest percentage deviation of our data from the literature data is 0.04% for density and 1.17% for viscosity.
Methods
International Journal of Heterocyclic Chemistry, Vol. 8 No. 4, pp. 1-15 (Autumn 2018 ) :: 3
rapidly rotating outer tube and an inner measuring bob which rotates more slowly. The uncertainty is 1×10⁻⁴ g·cm-3 for density measurements and 1% for viscosity measurements.
Three to five sets of readings for the flow times were taken for each sample. The mixtures were prepared just before use by mass on an electronic balance (Mettler AE 163, Switzerland) accurate to 0.01 mg and kept in airtight stoppered glass bottles to avoid evaporation. The maximum estimated uncertainty in the mole fractions is 1×10⁻⁴.
Results and discussions
Densities and excess molar volumes
From the experimental data, excess molar volumes VmE at different temperatures were calculated using
1 1
1
( )
N E
i
m i i
i
V x M
(1)
where is the density of the mixture, iis the density of pure component i, xi is the mole
fraction, Mi is the molar mass of component i, and N stands for the number of components in
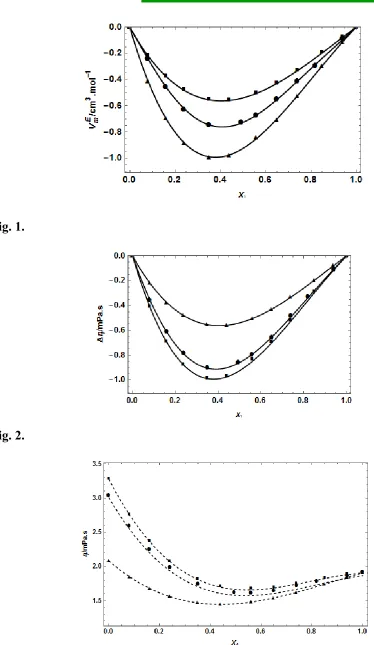
the mixture. The density data as a function of mole fraction for nitrobenzene + propanol, 2-butanol, and 2-pentanol mixtures at various temperatures are reported in Table 2. The densities of the binary mixtures decrease with increasing temperature and increase with increasing carbon chain length. Excess molar volumes of binary mixtures of nitrobenzene + 2-alkanols as a function of mole fraction at T= 298.15 K are plotted in Fig. 1. The VEm values were correlated with a Redlich–Kister type equation [9]
1 1 1
0
(1 ) (1 2
)
N k
E
m k
k
V x x A x
(2)where x1 is the mole fraction of nitrobenzene and Ak is an adjustable coefficient. Standard
deviations were obtained by the equation
1/2 2
exp
( ) / ( )
[
E E]
cal
V V n p
(3)where expE
V and E cal
V are the experimental and calculated data, respectively. Adjustable parameters
4:: International Journal of Heterocyclic Chemistry, Vol. 8 No. 4, pp. 1-15 (Autumn 2018 )
The excess molar volumes are negative for all studied mixtures and increase with the number of carbon atoms of the alcohols. This behavior arises from the specific interactions between the nitrobenzene and 2-alkanol molecules through dipole-dipole interactions, forming complexes through hydrogen bonds. With the higher chain length of 2-alkanols, the structural contributions arising from the geometrical fitting of one component into the other are negligible because of steric hindrance of carbon chain length. Therefore, mixtures containing higher 2-alkanols have
less negative E m
V values. On the other hand, in all cases the number of cross-associated hydrogen
bonds decreases with temperature which leads to less negative values of E m
V .
Dynamic Viscosities
The measured viscosities are reported in Table 2. The viscosities for binary mixtures increase with chain length and decrease with temperature. The viscosity deviation can be calculated as
x1 1x2 2
(4)
where is the mixture viscosity and 1and 2 are the viscosities of pure components. Values of
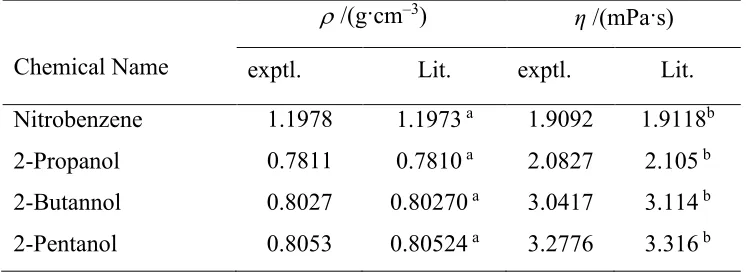
viscosity deviations were correlated by the Redlich–Kister equation and adjustable coefficients are reported in Table 3. The viscosity deviations for the mixtures of nitrobenzene with 2-alkanol at T= 298.15 K are shown in Fig. 2. This figure indicates that the viscosity deviations are negative for all three binary mixtures and become more negative with increasing chain length of the alcohols. This behaviour indicates that specific interactions between nitrobenzene and 2-alkanols decrease with the carbon chain length.
Free Volume Theory
In the free volume theory [10,11], the viscosity is expressed as the sum of two terms
0
res
(5)
0
is the viscosity in the dilute gas limit, while the residual viscosityresdescribes deviations
from the dilute gas. For 0the form proposed by Chung et al [12]
0 40.785 2/3 *
W c c
M T F v
(6)
was used. MW is Molecular weight and vcis critical volume. The reduced collision integral *
International Journal of Heterocyclic Chemistry, Vol. 8 No. 4, pp. 1-15 (Autumn 2018 ) :: 5
*
* * *
4 * * 0.76830
1.16145 0.52478 2.16178
exp(0.77320 ) exp(2.43787 )
6.435.10 sin(18.0323 7.27371)
T T T
T T
(7)
where * 1.2593
c
T T
T
(8)
andFc is given by
(9) where ωis the acentric factor and χis a correction for the influence of hydrogen bonds thatcan be calculated [13] by
(10) where NOH is the number of OH groups in the alcohol. The dimensionless dipole moment term
[13] μr is expressed as
(11)
where μ is the dipole moment in Debye. The residual viscosity is described by a generalized dumbbell model
14 2
10
res
a
N L
(12)
where is the density, is the friction coefficient, Na is Avogadro’s number and L2 is an
average quadratic length related to the size of the molecule. On the other hand, the viscosity
depends on free spaces among the molecules defined as a free volume fraction fV through the
exponential relation [14]
exp
res
V
B A
f
(13) The combination of eqs 12 and 13 leads to
14 2
0
10 exp
res
a
V
B N L
f
(14)
4
1 0.275 0.059035
c r
F
17 0.0682 0.276659 OH
W
N M
1/ 2131.3
r
c c
6:: International Journal of Heterocyclic Chemistry, Vol. 8 No. 4, pp. 1-15 (Autumn 2018 )
in which 0 is a friction coefficient related the mobility of the molecule and B is a parameter
related to the free-volume overlap among the molecules [15]. The friction coefficient 0 is
related to the energy of dissipation E by the expression
0.5 3
10 0
10 10
3
W a f
M E
N b RT
(15) where bf is the dissipation length of the energy E. Combination of eqs. 13 to 15 leads to the final
expression
1.5
3 3 2
4 2 10 10
(0.1 10 ) exp
3
res W W
V W
M P M
L P M B
RT RT
(16)
or, with P =0 to the equivalent condensed free-volume-dependent expression
3
4 10 2/3
10 exp
3
res W
V V
V
RTM B
L f
f
(17) This approach includes three adjustable parameters related to the structural and energetic properties of the fluid: LV, α and B. The theory can be applied to mixtures by employing mixing
rules for the three parameters. In the literature, there is no agreement about the best mixing rules to work [16−22]. The appropriateness of mixing rules is assessed by comparing molecular
predictions with experimental data. In some cases, LV, α and B are defined such that the mixing
rules contain adjustable parameters. These binary interaction parameters are added to the mixture rules to improve the fit of the FVM to experimental data. We have decided to apply a linear compositional mixing rule of the Lorentz type for the three parameters of the dense fluid term:
1 mix
n i i i
x
(18)1 mix
n i i i
B B x
(19), ,
1 V mix
n v i i i
L L x
(20)International Journal of Heterocyclic Chemistry, Vol. 8 No. 4, pp. 1-15 (Autumn 2018 ) :: 7
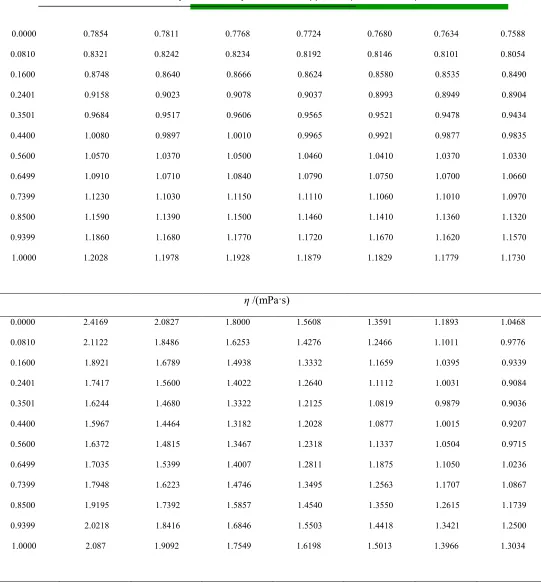
of the free volume theory associated with the PR are presented in Table 4 along with AAD. The Fig. 3 shows the comparison of results of the free volume theory and experimental viscosities of binary mixtures at 298.15 K. The values calculated by free volume theory are in satisfactory agreement with the experimental data over the entire composition range. The maximum AAD is 3.1%.
Conclusions
This paper reports densities and viscosities for binary mixtures of nitrobenzene with 2-alkanols. Excess molar volumes and viscosity deviations were correlated by the Redlich–Kister equation and are negative over the whole composition range. Our analyses suggest the presence of strong intermolecular interaction in all binary mixtures due to the dipole–dipole interactions between polar components and specific interactions between unlike molecules. Free volume theory has been coupled with Peng–Robinson equation of state for modeling the viscosities. The agreement between measured data and theoretical values is within the experimental uncertainties.
Acknowledgments
The author thanks the Islamic Azad University (Ahvaz Branch, Ahvaz) for providing the financial support to carry out this work.
References
[1] M. V. Rathnam, R. K. R. Singh, J. Chem. Eng. Data53 (2008) 265. [2] R. S. Neyband, H. Zarei, J. Chem. Thermodyn. 80 (2015) 119.
[3] M. Almasi, J. Chem. Thermodyn. 69 (2014) 101.
[4] M. Almasi, Physica B 412 (2013) 100.
[5] P. S. Nikam, M. C. Jadhav, M. Hasan, J. Chem. Eng. Data 40 (1995) 931. [6] H. Liu, C. M. Silva, E. A. Macedo, Fluid Phase Equilib. 202 (2002) 89.
[7] J.A. Riddick, W.B. Bunger, T.K. Sakano, Organic Solvents, Physical Properties and Methods of Purification, fourth ed., John Wiley& Sons, New York, 1986.
[8] D.S.Viswanath, T.K. Ghosh, D. H. L. Prasad, N. V. K. Dutt, K. Y. Rani, Viscosity of Liquids: Theory, Estimation, Experiment and Data, Springer, The Netherlands, 2007.
[9] O. Redlich, A.T. Kister, Ind. Eng. Chem. 40 (1948) 345.
8:: International Journal of Heterocyclic Chemistry, Vol. 8 No. 4, pp. 1-15 (Autumn 2018 )
[11] A. Allal, C. Boned, A. Baylaucq, Phys. Rev. E 64 (2001) 011203.
[12] T. H. Chung, M. Ajlan, L. L. Lee, K. E. Starling, Ind. Eng. Chem. Res. 27 (1988) 671.
[13] C. K. Zéberg-Mikkelsen, S. E. Quiñones-Cisneros, E. H. Stenby, Fluid Phase Equilib. 194–197 (2002) 1191.
[14] A. K. Doolittle, J. Appl. Phys. 22 (1951) 1471.
[15] F. Llovell, R. M. Marcos, L. F. Vega, J. Phys. Chem. B 117 (2013) 8159.
[16] N. Cain, G. Roberts, D. Kiserov, R. Carbonell, Fluid Phase Equilib. 305 (2011) 25.
[17] X. Canet, P. Daugé, A. Baylaucq, C. Boned, C. K. Zéberg-Mikkelsen, S. E. Quiñones-Cisneros, E. H. Stenby, Int. J. Thermophys. 22 (2001) 1669.
[18] C. Boned, C. K. Zéberg-Mikkelsen, A. Baylaucq, P. Daugé, Fluid Phase Equilib. 212 (2003) 143. [19] A. Baylaucq, C. Boned, X. Canet, C. K. Zéberg-Mikkelsen, Int. J. Thermophys. 24 (2003) 621. [20] A. Baylaucq, C. Boned, X. Canet, C. K. Zéberg-Mikkelsen, S. E. Quiñones-Cisneros, H. Zhou, Pet. Sci. Technol. 23 (2005) 143.
[21] M. A. Monsalvo, A. Baylaucq, P. Reghem, S. E. Quiñones-Cisneros, C. Boned, Fluid Phase Equilib. 233 (2005) 1.
[22] C. K Zéberg-Mikkelsen, G. Watson, A. Baylaucq, G. Galliero, C. Boned, Fluid Phase Equilib. 245 (2006) 6.
[23] D.Y. Peng, D.B. Robinson, Ind. Eng. Chem. Fundam. 15 (1976) 59.
[24] Yaws, C. L. Yaws handbook of thermodynamic and physical properties of chemical compounds. Norwich: New York; 2004
Figure Captions
Fig. 1. Excess molar volumes VEm vs. mole fraction of nitrobenzene for binary mixtures of nitrobenzene with (▲) 2-propanol, (●) 2-butanol, (■) 2-pentanol at T = 298.15 K. () Redlich–
Kister equation.
Fig. 2. Viscosity deviations ∆η vs. mole fraction of nitrobenzene for binary mixtures of nitrobenzene with (▲) 2-propanol, (●) 2-butanol, (■) 2-pentanol at T = 298.15 K. () Redlich–
Kister equation.
Fig. 3. Experimental and calculated viscosities of nitrobenzene with (▲) 2-propanol, (●)
International Journal of Heterocyclic Chemistry, Vol. 8 No. 4, pp. 1-15 (Autumn 2018 ) :: 9
Fig. 1.
10:: International Journal of Heterocyclic Chemistry, Vol. 8 No. 4, pp. 1-15 (Autumn 2018 )
Fig. 3.
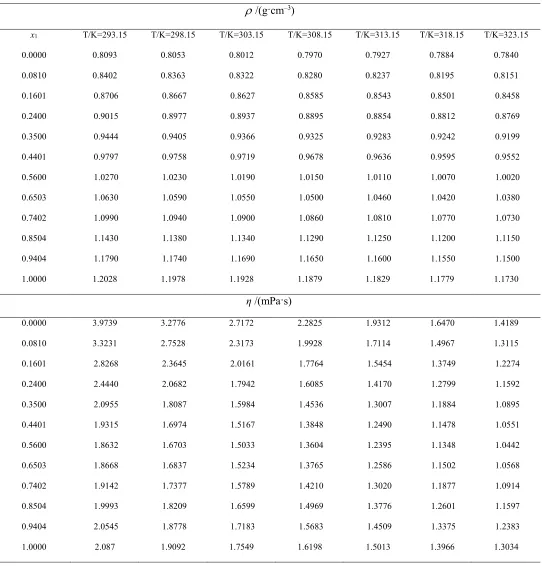
Table 1
Densities, and viscosities η, of pure components at T = 298.15 K and P= 0.1 MPa.
a Ref [7]. b Ref [8].
Table 2
Densities,ρ and viscosities, η for the binary mixtures as a function of the mole fraction x1 of nitrobenzene at pressure P = 0.1
MPa a.
Nitrobenzene + 2-Propanol
/(g·cm–3)
x1 T/K=293.15 T/K=298.15 T/K=303.15 T/K=308.15 T/K=313.15 T/K=318.15 T/K=323.15
Chemical Name
/(g·cm–3) η /(mPa·s)
exptl. Lit. exptl. Lit.
Nitrobenzene 1.1978 1.1973 a 1.9092 1.9118b
2-Propanol 0.7811 0.7810 a 2.0827 2.105 b
2-Butannol 0.8027 0.80270 a 3.0417 3.114 b
International Journal of Heterocyclic Chemistry, Vol. 8 No. 4, pp. 1-15 (Autumn 2018 ) :: 11 0.0000 0.0810 0.1600 0.2401 0.3501 0.4400 0.5600 0.6499 0.7399 0.8500 0.9399 1.0000 0.7854 0.8321 0.8748 0.9158 0.9684 1.0080 1.0570 1.0910 1.1230 1.1590 1.1860 1.2028 0.7811 0.8242 0.8640 0.9023 0.9517 0.9897 1.0370 1.0710 1.1030 1.1390 1.1680 1.1978 0.7768 0.8234 0.8666 0.9078 0.9606 1.0010 1.0500 1.0840 1.1150 1.1500 1.1770 1.1928 0.7724 0.8192 0.8624 0.9037 0.9565 0.9965 1.0460 1.0790 1.1110 1.1460 1.1720 1.1879 0.7680 0.8146 0.8580 0.8993 0.9521 0.9921 1.0410 1.0750 1.1060 1.1410 1.1670 1.1829 0.7634 0.8101 0.8535 0.8949 0.9478 0.9877 1.0370 1.0700 1.1010 1.1360 1.1620 1.1779 0.7588 0.8054 0.8490 0.8904 0.9434 0.9835 1.0330 1.0660 1.0970 1.1320 1.1570 1.1730
η /(mPa·s)
0.0000 0.0810 0.1600 0.2401 0.3501 0.4400 0.5600 0.6499 0.7399 0.8500 0.9399 1.0000 2.4169 2.1122 1.8921 1.7417 1.6244 1.5967 1.6372 1.7035 1.7948 1.9195 2.0218 2.087 2.0827 1.8486 1.6789 1.5600 1.4680 1.4464 1.4815 1.5399 1.6223 1.7392 1.8416 1.9092 1.8000 1.6253 1.4938 1.4022 1.3322 1.3182 1.3467 1.4007 1.4746 1.5857 1.6846 1.7549 1.5608 1.4276 1.3332 1.2640 1.2125 1.2028 1.2318 1.2811 1.3495 1.4540 1.5503 1.6198 1.3591 1.2466 1.1659 1.1112 1.0819 1.0877 1.1337 1.1875 1.2563 1.3550 1.4418 1.5013 1.1893 1.1011 1.0395 1.0031 0.9879 1.0015 1.0504 1.1050 1.1707 1.2615 1.3421 1.3966 1.0468 0.9776 0.9339 0.9084 0.9036 0.9207 0.9715 1.0236 1.0867 1.1739 1.2500 1.3034
Table 2 Continued
12:: International Journal of Heterocyclic Chemistry, Vol. 8 No. 4, pp. 1-15 (Autumn 2018 )
/(g·cm–3)
x1 T/K=293.15 T/K=298.15 T/K=303.15 T/K=308.15 T/K=313.15 T/K=318.15 T/K=323.15
0.0000 0.0810 0.1600 0.2400 0.3500 0.4949 0.5600 0.6500 0.7400 0.8205 0.9399 1.0000 0.8067 0.8436 0.8786 0.9134 0.9600 1.0190 1.0440 1.0790 1.1120 1.1410 1.1830 2.2028 0.8027 0.8395 0.8747 0.9095 0.9560 1.0150 1.0400 1.0750 1.1080 1.1370 1.1780 1.1978 0.7984 0.8379 0.8729 0.9076 0.9538 1.0120 1.0380 1.0720 1.1040 1.1330 1.1730 1.1928 0.7941 0.8310 0.8662 0.9010 0.9476 1.0060 1.0320 1.0660 1.0990 1.1280 1.1680 1.1879 0.7898 0.8266 0.8619 0.8968 0.9433 1.0020 1.0270 1.0620 1.0950 1.1230 1.1630 1.1829 0.7852 0.8220 0.8573 0.8922 0.9388 0.9975 1.0230 1.0570 1.0900 1.1180 1.1580 1.1779 0.7806 0.8176 0.8528 0.8877 0.9343 0.9931 1.0180 1.0520 1.0850 1.1140 1.1540 1.1730
η /(mPa·s)
International Journal of Heterocyclic Chemistry, Vol. 8 No. 4, pp. 1-15 (Autumn 2018 ) :: 13
Table 2 Continued
Nitrobenzene + 2-Pentanol
/(g·cm–3)
x1 T/K=293.15 T/K=298.15 T/K=303.15 T/K=308.15 T/K=313.15 T/K=318.15 T/K=323.15
0.0000 0.0810 0.1601 0.2400 0.3500 0.4401 0.5600 0.6503 0.7402 0.8504 0.9404 1.0000 0.8093 0.8402 0.8706 0.9015 0.9444 0.9797 1.0270 1.0630 1.0990 1.1430 1.1790 1.2028 0.8053 0.8363 0.8667 0.8977 0.9405 0.9758 1.0230 1.0590 1.0940 1.1380 1.1740 1.1978 0.8012 0.8322 0.8627 0.8937 0.9366 0.9719 1.0190 1.0550 1.0900 1.1340 1.1690 1.1928 0.7970 0.8280 0.8585 0.8895 0.9325 0.9678 1.0150 1.0500 1.0860 1.1290 1.1650 1.1879 0.7927 0.8237 0.8543 0.8854 0.9283 0.9636 1.0110 1.0460 1.0810 1.1250 1.1600 1.1829 0.7884 0.8195 0.8501 0.8812 0.9242 0.9595 1.0070 1.0420 1.0770 1.1200 1.1550 1.1779 0.7840 0.8151 0.8458 0.8769 0.9199 0.9552 1.0020 1.0380 1.0730 1.1150 1.1500 1.1730
η /(mPa·s)
14:: International Journal of Heterocyclic Chemistry, Vol. 8 No. 4, pp. 1-15 (Autumn 2018 )
ax
1 is the mole fraction of Nitrobenzene in the (Nitrobenzene + 2-alkanol) solutions. Standard uncertainties u are u(T) =
0.01 K, u(x) = 0.0001, u(p) = 10 kPa, the combined expanded uncertainty Uc(ρ) = 2×10⁻⁴ g·cm-3 (0.95 level of
confidence) and for viscosity the relative combined expanded uncertainty Ur(η) = 0.02 (0.95 level of confidence).
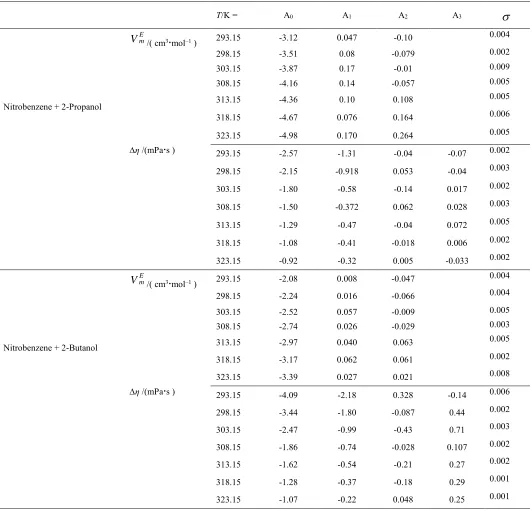
Table 3: Parameters Ak and Standard Deviations σ, for Binary mixtures at various temperatures
A3
A2
A1
A0
T/K =
0.004 -0.10
0.047 -3.12
293.15 VEm/( cm3·mol–1 )
Nitrobenzene + 2-Propanol
0.002 -0.079 0.08 -3.51 298.15 0.009 -0.01 0.17 -3.87 303.15 0.005 -0.057 0.14 -4.16 308.15 0.005 0.108 0.10 -4.36 313.15 0.006 0.164 0.076 -4.67 318.15 0.005 0.264 0.170 -4.98 323.15 0.002 -0.07 -0.04 -1.31 -2.57 293.15
∆η /(mPa·s )
0.003 -0.04 0.053 -0.918 -2.15 298.15 0.002 0.017 -0.14 -0.58 -1.80 303.15 0.003 0.028 0.062 -0.372 -1.50 308.15 0.005 0.072 -0.04 -0.47 -1.29 313.15 0.002 0.006 -0.018 -0.41 -1.08 318.15 0.002 -0.033 0.005 -0.32 -0.92 323.15 0.004 -0.047 0.008 -2.08 293.15 VEm/( cm3·mol–1 )
Nitrobenzene + 2-Butanol
0.004 -0.066 0.016 -2.24 298.15 0.005 -0.009 0.057 -2.52 303.15 0.003 -0.029 0.026 -2.74 308.15 0.005 0.063 0.040 -2.97 313.15 0.002 0.061 0.062 -3.17 318.15 0.008 0.021 0.027 -3.39 323.15 0.006 -0.14 0.328 -2.18 -4.09 293.15
∆η /(mPa·s )
International Journal of Heterocyclic Chemistry, Vol. 8 No. 4, pp. 1-15 (Autumn 2018 ) :: 15
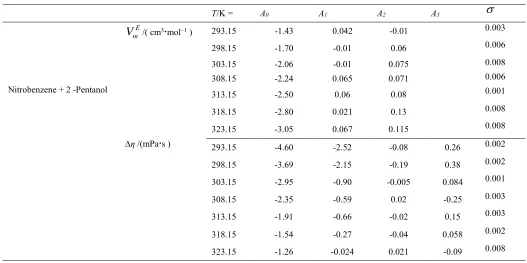
Table 3 Continued
TABLE 4 Optimized parameters of the Free-Volume theory along with average absolute deviation (AAD %)
Compound 3
10
B10 LV ADD (%)
Nitrobenzene 71.48 3.67 0.747 0.98
2-Propanol 391.43 3.05 0.041 3.1
2-Butanol 331.6 2.98 0. 031 2.01
2-Pentanol 246.94 2.49 0.022 1.4
A3
A2
A1
A0
T/K =
0.003 -0.01
0.042 -1.43
293.15
E m
V /( cm3·mol–1 )
Nitrobenzene + 2 -Pentanol
0.006 0.06
-0.01 -1.70
298.15
0.008 0.075
-0.01 -2.06
303.15
0.006 0.071
0.065 -2.24
308.15
0.001 0.08
0.06 -2.50
313.15
0.008 0.13
0.021 -2.80
318.15
0.008 0.115
0.067 -3.05
323.15
0.002 0.26
-0.08 -2.52
-4.60 293.15
∆η /(mPa·s )
0.002 0.38
-0.19 -2.15
-3.69 298.15
0.001 0.084
-0.005 -0.90
-2.95 303.15
0.003 -0.25
0.02 -0.59
-2.35 308.15
0.003 0.15
-0.02 -0.66
-1.91 313.15
0.002 0.058
-0.04 -0.27
-1.54 318.15
0.008 -0.09
0.021 -0.024