RESEARCH ARTICLE
Different evolution acceptance
instruments lead to different research findings
M. Elizabeth Barnes
1, Hayley M. Dunlop
1, Emily A. Holt
2, Yi Zheng
3and Sara E. Brownell
1*Abstract
Background: Despite widespread concern about the differential measurement of evolution acceptance among
researchers, no one has systematically explored how instrument choice can impact research results and conclusions in evolution education studies. In this study, we administered six evolution acceptance instruments in a single survey to students in undergraduate biology courses at universities in Arizona, Colorado, and Utah. We conducted separate analyses with the same students for the six different evolution acceptance instruments to understand how different results and conclusions may arise based on different evolution acceptance instruments used.
Results: We found statistically significant differences in levels of evolution acceptance across the three student populations when using a human evolution acceptance instrument, but not when using a microevolution accept-ance instrument. Further, significaccept-ance/effect sizes of variables associated with evolution acceptaccept-ance differed beyond sampling variation depending on the evolution acceptance instrument used. The results of analyses using different evolution acceptance instruments were most often dissimilar when examining the effect of evolution understanding and identifying as Protestant/Mormon on evolution acceptance.
Conclusions: We found that different instruments used to measure evolution acceptance sometimes led to different research results and conclusions. The extent to which variables predicted evolution acceptance was dependent on the instrument used to measure acceptance, which has the potential to explain over 30 years of conflicting research on the relationship between evolution acceptance and understanding. These results indicate that before researchers may be able to determine how to best improve evolution acceptance, the evolution education community may need to articulate a consistent definition of evolution acceptance and identify a singular valid and reliable instrument to quantify evolution acceptance so results can be compared across studies.
Keywords: Evolution acceptance, Evolution understanding, Religiosity, Nature of Science, Undergraduates, Survey instruments, MATE, GAENE
© The Author(s) 2019. This article is distributed under the terms of the Creative Commons Attribution 4.0 International License (http://creat iveco mmons .org/licen ses/by/4.0/), which permits unrestricted use, distribution, and reproduction in any medium, provided you give appropriate credit to the original author(s) and the source, provide a link to the Creative Commons license, and indicate if changes were made.
Introduction
Decades of research has resulted in little consensus on which factors are most important for student evolution acceptance (Barnes et al. 2017; Mead et al. 2018; Smith 2009a) and how to best increase evolution acceptance (Barnes and Brownell 2017; Mead et al. 2018). One expla-nation for this lack of consensus is that researchers use different instruments to measure evolution acceptance that were designed using different definitions of evolution
acceptance (Glaze and Goldston 2015; Lloyd-Strovas and Bernal 2012; Smith 2009a). In this study, we administered a survey containing multiple evolution acceptance instru-ments to undergraduate students in Arizona, Colorado, and Utah. We illustrate the similarities and differences in the results from each instrument and how the instrument choice can impact the results and conclusions of a study.
Background
Due to the low levels of evolution acceptance among members of the public (Gallup 2017; Pew 2013) and college students (Brem et al. 2003; Ingram and Nel-son 2006; Rice et al. 2010; Walter et al. 2013), research on how to increase evolution acceptance has become
Open Access
*Correspondence: [email protected]
1 School of Life Sciences, Biology Education Research Lab, Arizona State University, Tempe, AZ, USA
one of the predominant subfields of evolution edu-cation. Despite over 30 years of research on how to improve evolution acceptance, rates of acceptance in the United States have remained relatively unchanged (Gallup 2017). Further, although at least 300 articles have been published examining evolution acceptance, little consensus has emerged regarding the relation-ship between different variables and evolution accept-ance. While some studies have found large positive relationships between evolution acceptance and evolu-tion understanding (Rutledge and Warden 1999; Trani 2004), some studies report a weak relationship between acceptance and understanding (Athanasiou and Papa-dopoulou 2012; Cavallo et al. 2011; Deniz et al. 2008; Großschedl et al. 2014; Nadelson and Sinatra 2009), and other studies report no relationship between evolu-tion acceptance and understanding (Bishop and Ander-son 1990; Brem et al. 2003; Lawson 1983; Sinatra et al. 2003). Further, what best predicts evolution acceptance is variable across studies; religiosity, evolution under-standing, and Nature of Science (NOS) understanding have each been reported as the biggest predictors for evolution acceptance in different studies (Carter and Wiles 2014; Dunk et al. 2017; Glaze et al. 2014; Mead et al. 2018; Weisberg et al. 2018). This lack of over-all consensus on the relationships between evolution acceptance and other variables could be one reason why we have seen so little change in evolution accept-ance in the United States for 30 years. How can edu-cators determine the best methods for increasing evolution acceptance if the research community has not reached consensus on how variables relate to evolu-tion acceptance?
One explanation for these inconsistencies in evolution acceptance findings is that researchers measure evolu-tion acceptance differently and that this could lead to disparate results and conclusions. Prior to the publica-tion of peer-reviewed evolupublica-tion acceptance instruments, evolution education researchers used dozens of different evolution acceptance instruments that were usually con-structed for use in a single study (Bishop and Anderson 1990; Johnson and Peeples 1987; Lawson 1983; Sinatra et al. 2003). The Measure of the Theory of Acceptance of Evolution (MATE) was published in 1999 and it has slowly gained popularity in the evolution education com-munity to measure evolution acceptance (Rutledge and Warden 1999). More recently, the Inventory of Student Evolution Acceptance (I-SEA; Nadelson and Souther-land 2012) and the Generalized Acceptance of EvolutioN Exam (GAENE; Smith et al. 2016) have been published to measure evolution acceptance. The availability of dif-ferent instruments to measure evolution acceptance means that evolution education researchers have to
make a decision about the best way to measure evolution acceptance.
Evolution education researchers have expressed repeated concern about how evolution acceptance is measured (Glaze and Goldston 2015; Lloyd-Strovas and Bernal 2012; Sickel and Friedrichsen 2013; Smith 2009a). Dating back to more than 20 years ago, review articles have suggested problems with the measurement of evolu-tion acceptance. In Smith et al. (1995) the authors high-lighted that individuals with different levels of Nature of Science (NOS) understanding could be confused by the wording of questions in instruments meant to measure evolution acceptance, which could lead to inflated or even erroneous correlations between Nature of Science (NOS) understanding and evolution acceptance. In 2009, Smith et al. wrote a review article in which they also expressed concern that some instrument items meant to capture evolution acceptance may measure evolution understanding, which could lead to inflated correlations between evolution understanding and evolution accept-ance. When Lloyd-Strovas and Bernal (2012) reviewed the literature on undergraduate evolution education, they found it hard to detect patterns because the instruments used to measure evolution acceptance were so different that they claimed the studies were “not comparable.” In Sickel and Friedrichsen (2013) the authors raised con-cerns that instruments used to measure evolution accept-ance of the respondent include items about whether the respondent thinks that scientists accept evolution, which could lead to inflated rates of evolution acceptance in research findings. Nadelson and Southerland (2012) further expressed concern that many evolution accept-ance instruments do not disentangle the role of context (e.g. evolution occurring in humans or evolution occur-ring in plants) in evolution acceptance. However, despite the prevalence of these concerns, the evolution educa-tion community has not reached a consensus for how we should measure evolution acceptance and research-ers continue to use a variety of instruments to measure student evolution acceptance. Further, researchers often compare conclusions from studies that use different evo-lution acceptance instruments (Wiles and Alters 2011; Glaze and Goldston 2015). This practice implies that conclusions are comparable across studies using differ-ent evolution acceptance instrumdiffer-ents, but little prior research has determined whether using different evolu-tion acceptance instruments leads to the same conclu-sions about evolution acceptance (Romine et al. 2018; Sbeglia and Nehm 2018).
exploring the relationship between evolution acceptance and evolution understanding, we found that Bishop and Anderson (1990), Sinatra et al. (2003), and Hermann (2012) all used similar measures of evolution accept-ance in which students were asked the extent to which they believed/accepted evolution or thought evolution was true/credible. All three of these studies found no relationship between evolution acceptance and evolu-tion understanding. However, we found that in studies in which researchers used the Measure of Acceptance of the Theory of Evolution (MATE) to measure evolu-tion acceptance, researchers consistently found a posi-tive relationship between acceptance and understanding (Rutledge and Warden 2000; Trani 2004); no studies to our knowledge that use the MATE have ever reported an insignificant relationship between evolution accept-ance and understanding. However, these studies were conducted with different populations of students, so researchers cannot determine from these studies alone whether it was the evolution acceptance instruments used that led to the conflicting research findings.
There have been very few published studies that have used the I-SEA or the GAENE to measure evolution acceptance because they are fairly new. Nadelson and Hardy (2015) have used the I-SEA to show that introduc-tory undergraduate psychology students’ acceptance of microevolution, macroevolution, and human evolution are related to more trust in science and scientists, less conservative political orientations, and weaker religious commitment, similar to findings using other instruments (Dunk et al. 2017; Glaze and Goldston 2015). Using the I-SEA, other studies have shown that undergraduate students have higher acceptance of microevolution than macroevolution and human evolution (Nadelson and Hardy 2015; Nadelson and Southerland 2012; Schleith 2017). In one study, researchers showed that scores on the GAENE and MATE were strongly correlated among introductory undergraduate health sciences students (Metzger et al. 2018) and one study showed that GAENE scores increased among some high school students after evolution instruction (Pobiner et al. 2018). No peer-reviewed published study to our knowledge has reported the results of the relationship between evolution under-standing and acceptance using either the GAENE or I-SEA.
One goal of the current study was to explore whether inconsistent research conclusions about evolution under-standing and evolution acceptance could arise because of different instruments used to measure evolution accept-ance. However, we also explore whether research find-ings could be inconsistent when using different evolution acceptance instruments to examine relationships with
Nature of Science (NOS) understanding, religiosity, reli-gious affiliation, political affiliation, and race/ethnicity.
Research questions and methods
The overarching goal for the study was to compare research findings from different instruments that have been previously used to measure evolution acceptance. We administered six different multi-item instruments to measure evolution acceptance in a single survey to the same students and then compared the findings from each instrument using predefined criteria to determine what results and conclusions were different.
Our specific research questions were:
1. Do various instruments lead to different conclusions about the level of evolution acceptance among popu-lations?
2. Do various instruments lead to different results and conclusions about the relationships between student variables (e.g., evolution understanding, religion) and levels of evolution acceptance?
Survey and administration
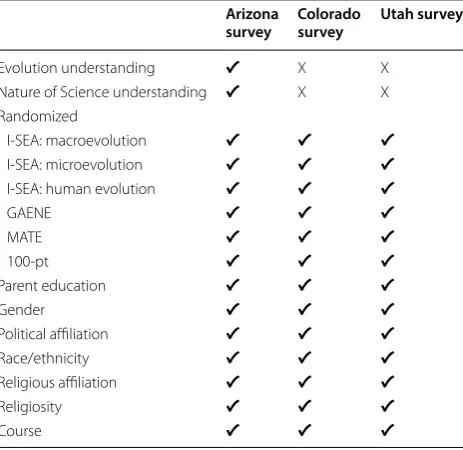
In the fall of 2017 and spring of 2018, we sent a sur-vey to ~ 2300 students from nine introductory biol-ogy courses at a research-intensive university in urban Arizona, ~ 190 students in two introductory biology courses at a comprehensive institution in rural Colorado, and ~ 200 students in four introductory biology courses at a primarily undergraduate institution in suburban Utah. Data were collected mid-semester. Students were offered a small amount of extra credit for completing the survey. We collected student evolution acceptance with six evo-lution acceptance instruments and also collected demo-graphic information from students. To ensure differences in results were not due to an instrument order effect, stu-dents were given the evolution acceptance instruments in a random order. Demographic questions were pre-sented at the end of the survey. For Arizona students, we also collected data on their evolution understanding and Nature of Science (NOS) understanding. See Table 1 for a list of data we collected for this study. The research study was approved by the Arizona and Colorado institutional review boards for all research in this manuscript, Proto-col Numbers 00007719 and 1131916-2, respectively.
Evolution acceptance instruments
behind the instrument’s construction, its unique features compared to other instruments, and its validity and reli-ability evidence.
Measure of Acceptance of the Theory of Evolution (MATE; Rutledge and Warden 1999)
The MATE is the most popular instrument used to measure evolution acceptance in the evolution educa-tion literature (Smith et al. 2016); we found 51 stud-ies published in academic journals that have used the MATE to measure evolution acceptance.
The MATE has 20-items and was originally designed to measure high school biology teachers’ evolution acceptance. Items on the MATE were reviewed and approved by a group of evolutionary biologists, sci-ence educators, and a philosopher of scisci-ence to estab-lish content validity (Rutledge and Warden 1999). The authors of the MATE reported that a factor analysis of their instrument revealed only one factor, and the authors deemed this single construct was evolution acceptance. However, more recent analyses have sug-gested the MATE is multi-dimensional (Metzger et al. 2018). The authors of the MATE reported acceptable reliability with high school biology teachers (Rutledge
and Warden 1999) and in a subsequent publication from Rutledge and Sadler (2007), the authors reported acceptable reliability of the MATE with college stu-dents. High reliability of the MATE has been confirmed by multiple subsequent studies (Barone et al. 2014; Manwaring et al. 2015; Nadelson and Sinatra 2009).
Rutledge and Warden (1999) did not provide an explicit definition of “evolution acceptance” for the basis of their instrument, but did cite Schwabb (1968) as justification for what they included in the MATE, in the following passage:
“because informed decisions of acceptance or rejec-tion of a scientific theory are based on evaluarejec-tions of substantive and syntactical elements of a domain, fundamental concepts of evolutionary theory and the nature of science were selected to be addressed by the MATE: the processes of evolution, the avail-able evidence of evolutionary change, the ability of evolutionary theory to explain phenomena, the evo-lution of humans, the age of the earth, the independ-ent validity of science as a way of knowing, and the current status of evolutionary theory within the sci-entific community.” (pg. 14)
Rutledge and Warden define what concepts are included in the definition of “evolution acceptance,” but do not define what is meant by “acceptance”. Based on the strongly agree-strongly disagree Likert-style response scale of the MATE, acceptance is implicitly defined as level of agreement with each of the concepts included in the MATE.
The MATE has been criticized for including questions that could measure evolution understanding, Nature of Science (NOS) understanding, religiosity, and percep-tions of scientists’ acceptance of evolution (Smith 2009a). If items on the MATE measure these constructs in addi-tion to evoluaddi-tion acceptance, then we may see inaccurate correlations between evolution acceptance and these constructs. For instance, one item on the MATE asks stu-dents if they agree that “the age of the earth is at least 4 billion years”; to be scored as an acceptor on this ques-tion, students would need to use their understanding of the age of Earth. A student could have an inaccurate understanding of the age of the Earth (e.g. that it is 2 bil-lion years old) and choose “disagree” even though they accept that the Earth is old and accept evolution. The use of the MATE is often justified by its prior prevalent use in the literature, even though many criticisms of this instru-ment have been published (Metzger et al. 2018; Nadelson and Southerland 2012; Romine et al. 2017; Smith et al. 2016).
Table 1 Data collected in the current study for each student population
A “✔” means that the data were collected for the indicated population and “X”
means that the data were not collected in that student population. Instruments are presented here in the same order as the survey administered to students. Evolution acceptance instruments were presented in a random order. Students were presented with the I-SEA macroevolution, microevolution, and human evolution instruments in that order in every survey
*GPA was collected from university registrar for Arizona students only Arizona
survey Colorado survey Utah survey
Evolution understanding ✔ X X Nature of Science understanding ✔ X X Randomized
I-SEA: macroevolution ✔ ✔ ✔
I-SEA: microevolution ✔ ✔ ✔
I-SEA: human evolution ✔ ✔ ✔
GAENE ✔ ✔ ✔
MATE ✔ ✔ ✔
100-pt ✔ ✔ ✔
Parent education ✔ ✔ ✔
Gender ✔ ✔ ✔
Political affiliation ✔ ✔ ✔
Race/ethnicity ✔ ✔ ✔
Religious affiliation ✔ ✔ ✔
Religiosity ✔ ✔ ✔
Inventory of Student Evolution Acceptance (I‑SEA: microevolution, macroevolution, and human evolution; Nadelson and Southerland 2012)
The I-SEA was published by Nadelson and Southerland in 2012 and we identified two studies published in the aca-demic literature (Nadelson and Southerland 2012; Nadel-son and Hardy 2015) and three dissertations/theses that have used the I-SEA to measure evolution acceptance.
The I-SEA is a 24-item Likert-style instrument devel-oped to measure evolution acceptance among high school and college students. The I-SEA was constructed to provide a new measure of acceptance that addressed what the authors considered two shortcomings of prior instruments used to measure evolution acceptance. First, they argued that other instruments conflated students’ evolution acceptance with student evolution understand-ing, so the I-SEA was designed to not conflate these. Second, other instruments did not disaggregate microev-olution from macroevmicroev-olution from human evmicroev-olution, so the I-SEA was developed with three distinct subscales of student acceptance of microevolution, macroevolution, and human evolution.
Nadelson and Southerland (2012) defined evolution as being comprised of three distinct contexts that are rel-evant for evolution acceptance: microevolution; defined as the results of evolution in the short term, macroevolu-tion; defined as the results of evolution in the long term, and human evolution; defined as the evolution of the human species specifically. They defined acceptance as “the examination of the validity of the knowledge sup-porting the construct, the plausibility of the construct for explaining phenomenon, persuasiveness of the construct and fruitfulness or productivity of the empirical support for the construct.” (pg. 1639)
The I-SEA definition of evolution acceptance is dif-ferent from other instruments in that it discriminates acceptance of different evolutionary contexts. Macroevo-lution and human evoMacroevo-lution tend to be in direct conflict with commonly held religious beliefs in the United States, but microevolution is not (Pobiner 2016; Scott 2005). Therefore, levels of evolution acceptance are often higher for microevolution than macroevolution and human evo-lution (Nadelson and Hardy 2015; Nadelson and Souther-land 2012) and relationships between predictor variables and evolution acceptance may change depending on the different subscale.
Exploratory and confirmatory factor analyses of the I-SEA have confirmed a three factor structure of micro-evolution, macromicro-evolution, and human evolution to the I-SEA and the three resulting subscales had high internal consistency coefficients of > .80. Further, content validity of the I-SEA was supported by a group of experienced biology teachers, science teacher educators, and college
biology faculty members who reviewed the items on the I-SEA (Nadelson and Southerland 2012). The authors of the I-SEA recommended that the instrument could be used as three separate instruments to measure accept-ance of evolution or as an aggregate single instrument. Because research findings may be different for differ-ent subscales on the I-SEA, we treat the I-SEA as three distinct instruments: I-SEA microevolution acceptance, I-SEA macroevolution acceptance, and I-SEA human evolution acceptance.
Generalized Acceptance of EvolutioN Evaluation (GAENE; Smith et al. 2016)
The GAENE was published in 2016 and we have iden-tified three studies (Metzger et al. 2018; Pobiner et al. 2018; Smith et al. 2016) published in academic journals that used the GAENE to measure evolution acceptance.
The GAENE is a 13-item Likert-style instrument origi-nally designed to measure high school and college stu-dents’ evolution acceptance. Items on the GAENE went through an iterative construction process, with two rounds of pilot testing with students, two rounds of vali-dation with science education experts, and two rounds of reliability, factor, and Rasch analyses, the second set of which showed acceptable reliability and validity of the GAENE with high school and college students (Smith et al. 2016).
The GAENE was constructed to provide a new measure of evolution acceptance that addressed what the authors identified as two major weaknesses of other instruments used to measure evolution acceptance. First, the authors of the GAENE built the instrument so that it would not conflate evolution understanding with evolution accept-ance, and second, it was built from an explicit definition of evolution acceptance while other instruments used to measure evolution acceptance often operate from an implicit definition of evolution acceptance (Smith et al. 2016). The authors explicitly define evolution acceptance as:
“The mental act or policy of deeming, positing, or postulating that the current theory of evolution is the best current available scientific explanation of the origin of new species from preexisting species.” (pg. 8)
in a public forum such as a school club, church group, or meeting of public school parents,” which is different from other evolution acceptance instruments in which students are asked how much they agree with the current claims of evolutionary theory.
100‑point instrument of self‑defined acceptance
We constructed an evolution acceptance instrument with the purpose of mimicking the ones used by Bishop and Anderson (1990), Sinatra et al. (2003), and Hermann (2012) described in the introduction. We found five stud-ies that used similar instruments to measure evolution acceptance. Our instrument was a composite score of three items in which students used a slider scale to indi-cate from 0 to 100 points: (1) “To what extent do you accept evolution?” (2) “To what extent do you believe evolution?” and (3) “To what extent do you think evolu-tion is true?” In the study by Sinatra et al. (2003), students placed an “X” on a horizontal number line to indicate the extent to which they thought evolution was credible and in Bishop and Anderson (1990) students were asked, “Do you believe the theory of evolution to be truthful?.” In Hermann (2012) students were asked “To what extent do you accept (believe) evolution?” None of these three studies found a significant relationship between evolu-tion understanding and acceptance. The instrument used in the current study was constructed with the purpose of mimicking an instrument like these that does not provide any definition of evolution acceptance and only relies on the student’s definition of evolution acceptance. This is the only instrument we use in this study that relies com-pletely on the respondents’ own definition of evolution acceptance; other instruments generally provide students with specific contexts about evolution acceptance with which to agree or disagree.
We conducted think-aloud interviews (Willis 2004) with 25 undergraduate students with these items from this instrument. We instructed students to read each question aloud, then explain what they perceive the question is asking, and then to walk us through their reasoning as they answer the question. Finally, we asked students if there was anything confusing about the ques-tions and if they had any suggesques-tions for how they could be improved. Interviews indicated that students did not misinterpret the questions and answered the questions in a manner we would expect given their reasoning (e.g., one student answered “100” to “to what extent do you think evolution is true?” because she thought the sci-entific evidence was strong for evolution while another student answered “7” because she thought there was evidence for some aspects of evolution but not others). No student found the questions confusing or in need of clarification. However, six out of 25 students did indicate
that the questions were repetitive and seemed to be ask-ing the same question. Inter-item correlation coeffi-cient ranges for items on this instrument were very high (r = .85–.89) and the reliability coefficient also very high (α = .95). Unlike the other evolution acceptance instru-ments used in this study, this instrument did not undergo formal evaluation by experts and was not published as a peer-reviewed paper dedicated to the instrument’s devel-opment. Nonetheless, it is similar to instruments used in other peer-reviewed studies published by leaders in the field of evolution education and these studies have been highly cited and thus fairly influential in the evolution education literature (Bishop and Anderson 1990; Sinatra et al. 2003).
Demographics and other predictor variables
We collected information on race/ethnicity, parent edu-cation level, political affiliation, religious affiliation from all students. Religiosity was also collected from all stu-dents and was defined as the extent which stustu-dents see religion as important to their identity and the extent to which they participate in religious activities. Those asso-ciated with a religious denomination and those who selected “nothing in particular” as their religious affili-ation were categorized based on their agreement on a 5-point Likert-scale from strongly disagree to strongly agree with the statements “I attend religious services reg-ularly” and “my religion or faith is an important part of my identity” (Cohen et al. 2008). Religiosity was treated as an ordinal variable in which atheists and agnostics were categorized at the lowest end.
To measure Arizona students’ Nature of Science (NOS) understanding, we used the Rutledge and Warden (2000) modified version of the Johnson and Peeples (1987) instrument. This 20-item instrument probes students about a wide range of characteristics of science, including but not limited to: the tentative nature of science (e.g., “A fact in science is a truth that can never be changed”), the scientific method (e.g., “The initial step of the scientific method is to test a hypothesis”), the techniques of sci-ence (e.g., “To make any determinations about historic occurrences in nature, there must be direct observa-tions”), and the limits of science (e.g., “Scientists must limit their investigations to the natural world”). Students’ scores were calculated by determining the number of items answered correctly (True-or-False response scale). We chose to use this instrument because it has been repeatedly used in the evolution education literature to measure Nature of Science (NOS) understanding and has shown large correlations with evolution acceptance in several studies (Dunk et al. 2017; Glaze et al. 2014; Rut-ledge and Warden 2000).
We also collected Arizona students’ cumulative end of semester college GPA from the university’s registrar.
Analyses and results
We wanted to compare research findings from different instruments when the student sample remained constant. Therefore, we only included data from students that pro-vided answers for all questions used in the analyses, so the sample would be exactly the same across the analyses using different instruments.1 This resulted in 742
com-plete responses from students in Arizona, 102 comcom-plete responses from students in Colorado, and 79 complete responses from students in Utah. We used SPSS version 25 for all analyses.
The religious background and political beliefs of stu-dents in Arizona, Colorado, and Utah were notably dif-ferent. Ninety-two percent of students who we surveyed in Utah identified as Mormon/LDS, while only 1–2% of students in Arizona and Colorado identified as Mor-mon/LDS. Further, students in Utah scored one standard deviation higher on the measure of religiosity compared to students in Arizona and Colorado (Table 2). Students in Utah were also more likely to identify as Republican (57%) compared to students in Arizona (16%) and Colo-rado (16%). Past research shows that the general Mormon population has some of the lowest evolution acceptance rates (Baker et al. 2018), so we would expect a priori that the Utah student population would be less accepting of evolution compared to students in Arizona and Colo-rado. Arizona and Colorado students scored similarly on mean religiosity (Table 2), which was surprising because Colorado is generally rated as a less religious state
Table 2 Demographic characteristics of three student populations
Arizona (n = 742) Colorado (n = 102) Utah (n = 79)
Politics
Republican 16.0% 15.7% 57.0%
Other affiliation 84.0% 76.5% 33.0%
Race/ethnicity
Black/African Am. 3.9% 3.9% 0%
Hispanic 22.4% 14.7% 1.3%
Asian 15.0% 2.0% .0%
White 52.3% 69.8% 86.1%
Other race/ethnicity 6.5% 17.6% 8.9%
Gender
Male 35.1% 26.7% 36.7%
Female 62.9% 73.3% 60.8%
Religion
Mormon/LDS 1.8% 1.0% 92.2%
Protestant 21.0% 33.3% .0%
Catholic 24.7% 21.6% .0%
Other religion 9.6% 4.9% .0%
No religion 42.2% 33.3% 7.6%
Religiosity on scale of 1–10: Mean (SD) 4.45 (3.59) 4.74 (3.27) 7.85 (3.29)
compared to Arizona (Pew 2016). However, the institu-tion sampled in Colorado was located in a rural part of Colorado, which could explain the similarity in Arizona and Colorado students’ religiosity scores. See Table 2 for a comparison of the demographics collected from all three student populations.
For ease of interpretation, all scores from evolution acceptance instruments were relativized by the maxi-mum scores so that scores from each instrument ranged from 0 to 1. From this point onwards, when we refer to instrument scores we are referring to the relativized scores. Internal consistency analyses revealed that all six evolution acceptance instruments had acceptable reli-ability (α = .84–.98). All alpha values for each evolution
acceptance instrument by student population can be found in the Additional file 1: Table S1.
Bivariate correlations of students’ scores on the six dif-ferent evolution acceptance instruments revealed that scores from the six different instruments were moder-ately to strongly correlated with one another in Arizona (r = .49–.83, p < .001), Colorado (r = .49–.82, p < .001),
and Utah (r = .36–.79, p < .001). Correlation coefficients
for each instrument by population of student can be found in the Additional file 1: Tables S2–S4.
Research question #1: do various instruments lead to different conclusions about the level of evolution acceptance among populations?
One research question that evolution education research-ers often explore is whether evolution acceptance diffresearch-ers across students in different contexts (Short and Hawley 2015). We examined whether different evolution accept-ance instruments lead to different conclusions about
levels of evolution acceptance among three undergradu-ate student populations.
The samples in Arizona, Colorado, and Utah did not meet the homogeneity of variance assumptions needed to run one-way ANOVA’s when exploring population level differences with the MATE (Levene’s statistic = 7.95,
p < .001), the GAENE (Levene’s statistic = 3.94, p = .02),
the I-SEA microevolution (Levene’s statistic = 4.92,
p = .007), or the 100-pt scale (Levene’s statistic = 11.18,
p < .001), according to Levene’s test. Therefore, to deter-mine if there were differences in evolution acceptance across the three student populations, we ran Welch’s robust tests of equality of means (Field 2009). Following Welch’s test, we then conducted Games-Howell post hoc tests that corrected for multiple comparisons (Field 2009) to identify which populations were statistically signifi-cantly different from one another. We conducted a sepa-rate test for each of the six different evolution acceptance instruments as the dependent variable with student pop-ulation (AZ, CO, or UT) as the predictor variable. We consider a conclusion using one instrument to be differ-ent from a conclusion using a differdiffer-ent instrumdiffer-ent when one instrument detects statistically significant differences between two populations and another instrument does not.
Welch’s test detected differences in mean evolu-tion acceptance scores across populaevolu-tions using all evolution acceptance instruments (Welch’s range (2, 920) = 14.61–22.02, p < . 01), except the I-SEA
micro-evolution instrument (Welch’s (2, 920) = .123, p = .88.)
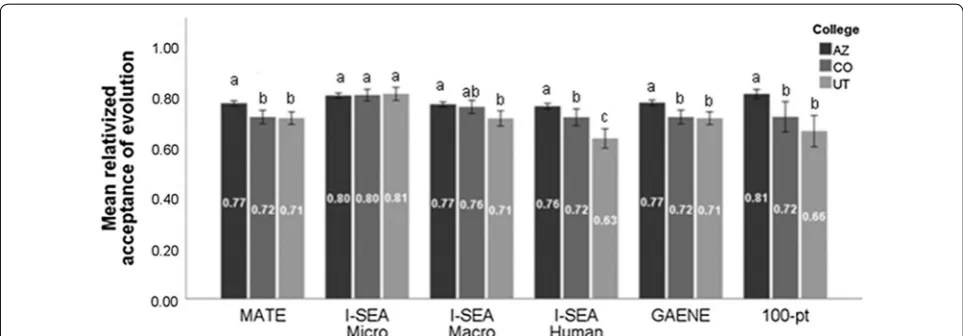
similar patterns (see Fig. 1). Games-Howell post hoc tests revealed that Arizona students scored higher than Utah students on evolution acceptance when using every instrument (p < .01), except for the I-SEA microevolution instrument (p = .88). When comparing Arizona and Colorado populations, the test revealed higher scores among students in Arizona when using the MATE (p = .001), the I-SEA human evolution instrument (p = .039), the GAENE (p < .001), and the 100-point instrument (p = .014) but not using the I-SEA microevolution instrument (p = .986) or the I-SEA macroevolution instrument (p = .754). When compar-ing Colorado and Utah students, the test only detected differences using scores from the I-SEA human instru-ment (p = .003), in which Colorado students scored higher. Figure 1 summarizes the results comparing mean levels of evolution acceptance across populations by evolution acceptance instrument.
Research question #1 discussion We found that most
evolution acceptance instruments, except the I-SEA microevolution and I-SEA macroevolution, showed that AZ had the highest evolution acceptance, so many of the instruments showed similar patterns. However, differences in evolution acceptance across populations were found with some evolution acceptance instru-ments but not others, indicating the results were incon-sistent with some instruments. This was most notable within the three subscales of the I-SEA. Differences in levels of evolution acceptance between populations were consistently found using the I-SEA human instru-ment, but not the I-SEA microevolution instruinstru-ment, which supports that there is higher variation in levels of acceptance of human evolution across different popula-tions of students than microevolution.
Students in Utah scored higher on religiosity, so we expected that there would be higher perceived conflict between evolution and these students’ religious beliefs compared to the students in Arizona and Colorado who were less religious on average. As Nadelson and South-erland (2012) argued when they created the I-SEA, reli-gious individuals may perceive more conflict between their religious beliefs and human evolution than mac-roevolution or micmac-roevolution and this may explain the difference we see in results from the I-SEA microevolu-tion and I-SEA human evolumicroevolu-tion instruments.
These results suggest that using the I-SEA subscales, and specifically separating the analyses by subscale, may give researchers a more nuanced understanding of the differences in evolution acceptance across pop-ulations. Further, if researchers use instruments for evolution acceptance that are more focused on micro-evolution, then researchers could report higher rates of evolution acceptance and could also miss differences
in overall evolution acceptance between populations of students. Further, if researchers do not inquire about human evolution acceptance with their instrument, they may not identify population level differences in evolution acceptance that would be apparent with a dif-ferent instrument that included questions about human evolution.
Research question # 2: do various instruments lead to different results and conclusions about relationships between student variables (e.g. evolution understanding, religion) and levels of evolution acceptance?
Another common aim of evolution education research is to identify what variables are related to evolution acceptance and what positively or negatively pre-dicts whether someone will be accepting of evolution. We examined whether researchers could get different results and come to different conclusions about what variables would predict evolution acceptance if they used different evolution acceptance instruments.
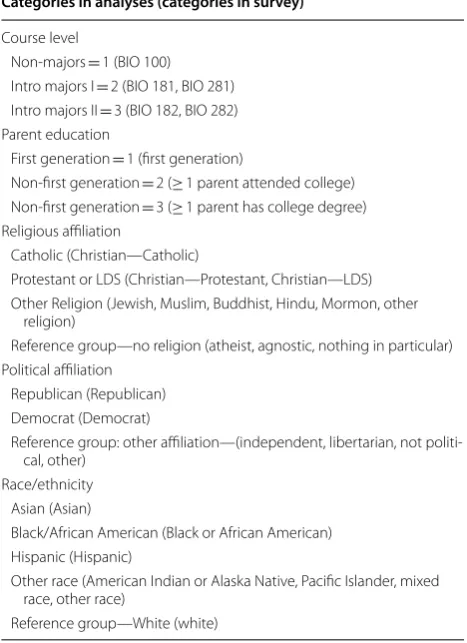
We restricted these analyses to students in Arizona for which we collected student evolution understanding and Nature of Science (NOS) understanding. We used linear regression analyses to explore whether variables predicted evolution acceptance differentially depending on the instrument used to measure evolution accept-ance. We inputted all predictor variables (evolution understanding, NOS understanding, GPA, course level, parent education level, religiosity, religious denomina-tion, political affiliation and race/ethnicity) into regres-sions with scores from each evolution acceptance instrument as a dependent variable (six regressions total). Table 3 illustrates how each variable was input-ted in the analyses.
is not statistically significantly related to acceptance, we deemed that this would be a different “conclusion” drawn based on different instruments used (Table 6).
Students had an average GPA of 3.3 (SD = .61), scored an average of 9 out of 13 on the understanding of evo-lution measure (SD = 2.14), and scored an average of 13 out of 20 on the Nature of Science (NOS) understanding measure (SD = 2.68).
Overall, the collective variables explained a statisti-cally significant amount of variation in evolution accept-ance from six models across all evolution acceptaccept-ance instruments (range of adjusted R2= .29–.42, p < .001). The variables explained 42% of the variation in MATE scores (F (16, 725) = 34.20, p < .001), thirty-five percent of the variation in I-SEA microevolution scores (F (16, 725) = 26.36, p < .001), thirty-one percent of the variation in macroevolution scores (F (16, 725) = 21.82, p < .001), thirty-five percent of the variation in I-SEA human evolution scores (F (16, 725) = 26.04, p < .001), twenty-nine percent of the variation in GAENE scores (F (16, 725) = 18.31, p < .001), and thirty-one percent of the variation in 100-pt evolution acceptance scores (F (16,
725) = 21.87, p < .001). All six full regression tables with r-squared values, F-statistics, standardized and unstand-ardized coefficients, standard errors, and t-statistics, can be found in the Additional file 1: Tables S5–S10.
Religiosity was the strongest predictor of evolution acceptance across all instruments (β range =− .29 to
− .25, p < .001), except for the I-SEA microevolution acceptance instrument where evolution understanding was the strongest predictor (β = .26, p < .001).
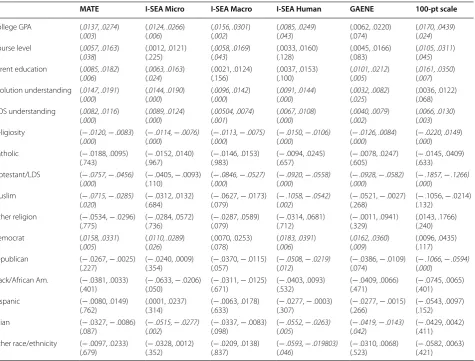
We found that the results across analyses were often different. We compared the confidence intervals of the unstandardized beta coefficients for each predictor vari-able across the six regression models. Non-overlapping confidence intervals from unstandardized beta coef-ficients indicated that the regression coefcoef-ficients for several predictor variables were different based on the evolution acceptance instrument used. We identified non-overlapping confidence intervals for the effect of parent education, evolution understanding, Nature of Science (NOS) understanding, religiosity, and identifying as Protestant or LDS, Muslim, Republican, Hispanic, or another race/ethnicity. All calculated confidence inter-vals and the p-values for coefficients can be found in Table 4. A summary of cases in which confidence inter-vals overlap and do not overlap can be found in Table 5.
Of particular note was the differential effect of evo-lution understanding and religious denomination across evolution acceptance instruments. Evolution understanding had a noticeably variable effect on evo-lution acceptance depending on the evoevo-lution accept-ance instrument used. Confidence intervals for the effect of evolution understanding on MATE scores and I-SEA microevolution scores were almost identical (CI = .015, .019), but confidence intervals for the effect of evolution understanding on I-SEA macro evolution scores (CI = .010, .014), I-SEA human evolution scores (CI = .009, .014), GAENE scores (CI = .003, .008), and 100-pt scores (CI = .004, .012) were lower, thus indicating that evolution understanding is a weaker predictor with these instruments. Additionally, the confidence interval for the effect of identifying as Prot-estant/LDS was lower for I-SEA microevolution scores (CI =− .040, − .009) than MATE scores (CI =− .076,
− .046), I-SEA macroevolution scores (CI =− .085,
− .053), I-SEA human evolution scores (CI =− .092,
− .056), and GAENE scores (CI =− .093, − .058). Addi-tionally, the effect of identifying as Protestant/LDS appeared to be particularly strong in predicting scores on the 100-pt scale (CI =− .186, − .127).
The differences in confidence intervals of regres-sion coefficients indicate different study “results”, with a “result” defined as the coefficient rendered by the analyses. This is different from the colloquial usage of
Table 3 Description of categorical and ordinal variables in the regression analyses
Categories in analyses (categories in survey)
Course level
Non-majors = 1 (BIO 100) Intro majors I = 2 (BIO 181, BIO 281) Intro majors II = 3 (BIO 182, BIO 282) Parent education
First generation = 1 (first generation)
Non-first generation = 2 (≥ 1 parent attended college) Non-first generation = 3 (≥ 1 parent has college degree) Religious affiliation
Catholic (Christian—Catholic)
Protestant or LDS (Christian—Protestant, Christian—LDS) Other Religion (Jewish, Muslim, Buddhist, Hindu, Mormon, other
religion)
Reference group—no religion (atheist, agnostic, nothing in particular) Political affiliation
Republican (Republican) Democrat (Democrat)
Reference group: other affiliation—(independent, libertarian, not politi-cal, other)
Race/ethnicity Asian (Asian)
Black/African American (Black or African American) Hispanic (Hispanic)
Other race (American Indian or Alaska Native, Pacific Islander, mixed race, other race)
the term “result” which suggests statistical significance. We consider differences in statistical significance across models more specifically as differences in conclusions
rendered from the different results (coefficients). Would we have come to different conclusions about what vari-ables are statistically significantly related to evolution acceptance, based on different evolution acceptance instruments? To answer this, we look to whether vari-ables were deemed as statistically significant (p < .05) in each regression model.
Whether variables were statistically significant was dif-ferent for difdif-ferent evolution acceptance instruments; some variables were significant and positive predictors across all instruments, some variables were significant but negative predictors of acceptance across all instru-ments, and finally some variables were significant predic-tors of acceptance with some instruments but not others. The directionality of the relationships between predictor
variables and acceptance was constant across all models; variables were never significant positive predictors in one model and then significant negative predictors in other models. See Table 6 for a summary of which variables were statistically significant across evolution acceptance instruments.
Religiosity was a statistically significant negative pre-dictor of evolution acceptance across all instruments. Nature of Science (NOS) understanding was a statistically significant positive predictor of evolution acceptance across all evolution acceptance instruments (Table 6).
GPA was a positive significant predictor of evolu-tion acceptance across almost all instruments, but GPA was not significant for GAENE scores. Evolution under-standing was a significant positive predictor of evolu-tion acceptance across all instruments except it was not a significant predictor of 100-pt scores. Identifying as Protestant or LDS was a significant negative predictor of
Table 4 Calculated confidence intervals and p-values for unstandardized beta coefficients from six regressions
Each column is a separate regression using a different evolution acceptance instrument as the dependent variable. Each row is a predictor variable that was inputted into each regression. Each cell contains the calculated confidence interval and below is the p value for that variable in that particular regression. Italicized cells indicate that the coefficient was statistically significant at p < .05
MATE I-SEA Micro I-SEA Macro I-SEA Human GAENE 100-pt scale
College GPA (.0137, .0274)
(.003) ((.0124, .0266.006) ) ((.002.0156, .0301) ) ((.0085, .0249.043) ) (.0062, .0220)(.074) ((.0170, .0439.024) ) Course level (.0057, .0163)
(.038) (.0012, .0121)(.225) ((.043.0058, .0169) ) (.0033, .0160)(.128) (.0045, .0166)(.083) ((.0105, .0311.045) ) Parent education (.0085, .0182)
(.006) ((.0063, .0163.024) ) (.0021, .0124)(.156) (.100)(.0037, .0153) ((.0101, .0212.005) ) ((.0161, .0350.007) ) Evolution understanding (.0147, .0191)
(.000) ((.0144, .0190.000) ) ((.000.0096, .0142) ) ((.0091, .0144.000) ) ((.0032, .0082.025) ) (.0036, .0122)(.068) NOS understanding (.0082, .0116)
(.000) (
.0089, .0124) (.000) (
.00504, .0074) (.001) (
.0067, .0108)
(.000) (
.0040, .0079) (.002) (
.0066, .0130) (.003) Religiosity (− .0120, − .0083)
(.000) ((−.000 .0114, ) − .0076) ((−.000 .0113, ) − .0075) ((.000− .0150, ) − .0106) ((.000− .0126, .0084) ) ((−.000 .0220, .0149) ) Catholic (− .0188, .0095)
(.743) (.967)(− .0152, .0140) ((.983)− .0146, .0153) (.657)(− .0094, .0245) ((.605)− .0078, .0247) ((.633)− .0145, .0409) Protestant/LDS (− .0757, − .0456)
(.000) ((.110)− .0405, − .0093) (−
.0846, − .0527) (.000) (−
.0920, − .0558) (.000) (−
.0928, − .0582) (.000) (−
.1857, − .1266) (.000)
Muslim (− .0715, − .0285)
(.020) ((.684)− .0312, .0132) (.079)(− .0627, − .0173) ((−.002 .1058, ) − .0542) ((.268)− .0521, − .0027) ((.132)− .1056, − .0214) Other religion (− .0534, − .0296)
(.775) (.736)(− .0284, .0572) ((.079)− .0287, .0589) (.712)(− .0314, .0681) ((.329)− .0011, .0941) (.0143, .1766)(.240) Democrat (.0158, .0331)
(.005) (
.0110, .0289)
(.026) (.0070, .0253)(.078) (
.0183, .0391)
(.006) (
.0162, .0360)
(.009) (.0096, .0435)(.117) Republican (− .0267, − .0025)
(.227) ((.354)− .0240, .0009) ((.057)− .0370, − .0115) ((−.012 .0508, ) − .0219) (.074)(− .0386, − .0109) ((−.000 .1066, ) − .0594) Black/African Am. (− .0381, .0033)
(.401) ((.050)− .0633, − .0206) (.671)(− .0311, − .0125) (.532)(− .0403, .0093) ((.471)− .0409, .0066) ((.401)− .0745, .0065) Hispanic (− .0080, .0149)
(.762) (.314)(.0001, .0237) ((.633)− .0063, .0178) (.307)(− .0277, − .0003) ((.266)− .0277, − .0015) ((.152)− .0543, .0097) Asian (− .0327, − .0086)
(.087) ((−.002 .0515, ) − .0277) (.098)(− .0337, − .0083) ((−.005 .0552, ) − .0263) ((−.042 .0419, ) − .0143) ((.411)− .0429, .0042) Other race/ethnicity (− .0097, .0233)
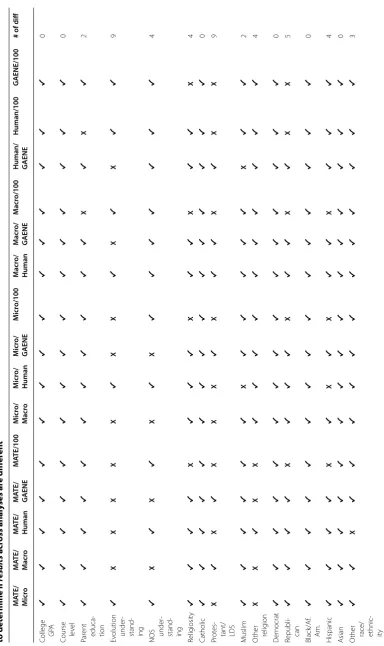
Table 5 E valua tion of confidenc e in ter vals of unstandar diz ed b eta c oefficien ts fr om pr edic tor v ariables acr oss ev olution ac ceptanc e instr umen ts used to det ermine if results acr oss analy ses ar e diff er en t Each c olumn sho w
s the c
ompar ison bet w een t w o ev olution ac ceptanc e instrumen ts
. Each r
ow is a pr
edic
tor v
ar
iable tha
t w
as included in ev
er
y r
eg
ression. Each c
ell indica
tes whether the c
onfidenc
e in
ter
vals of t
w o instrumen ts o ver lap . I
f the c
onfidenc e in ter vals o ver lap
, it is indica
ted with a
“ ✔ ”; a “ X” indica tes tha
t the t
w
o c
onfidenc
e in
ter
vals do not o
ver
lap and thus the beta c
oefficien ts ar e diff er en t fr
om one another bey
ond
sampling v
ar
iabilit
y.
The far r
igh
t c
olumn summar
iz
es the number of instanc
es wher
e c
onfidenc
e in
ter
vals do not o
ver
lap
. Not
e tha
t this is a c
onser
va
tiv
e appr
oach and those with o
ver lapped c onfidenc e in ter vals ma y
also be diff
er
en
t (S
chenker and G
en tleman 2001 ) M ATE/ M icr o M ATE/ M acr o M ATE/ Human M ATE/ GAENE M ATE/100 M icr o/ M acr o M icr o/ Human M icr o/ GAENE M icr o/100 M acr o/ Human M acr o/ GAENE M acr o/100 Human/ GAENE Human/100 GAENE/100 # of diff
College G
PA ✔ ✔ ✔ ✔ ✔ ✔ ✔ ✔ ✔ ✔ ✔ ✔ ✔ ✔ ✔ 0
Course le
vel ✔ ✔ ✔ ✔ ✔ ✔ ✔ ✔ ✔ ✔ ✔ ✔ ✔ ✔ ✔ 0 Par
ent educa
-tion ✔ ✔ ✔ ✔ ✔ ✔ ✔ ✔ ✔ ✔ ✔ X ✔ X ✔ 2 Ev
olution under
-stand -ing ✔ X X X X X ✔ X X ✔ X ✔ X ✔ ✔ 9
NOS under
-stand -ing ✔ X ✔ X ✔ X ✔ X ✔ ✔ ✔ ✔ ✔ ✔ ✔ 4 Relig iosit y ✔ ✔ ✔ ✔ X ✔ ✔ ✔ X ✔ ✔ X ✔ ✔ X 4 Catholic ✔ ✔ ✔ ✔ ✔ ✔ ✔ ✔ ✔ ✔ ✔ ✔ ✔ ✔ ✔ 0 Pr ot es -tant/ LDS X ✔ X ✔ X X X ✔ X ✔ ✔ X ✔ X X 9 M uslim ✔ ✔ ✔ ✔ ✔ ✔ X ✔ ✔ ✔ ✔ ✔ X ✔ ✔ 2 O
ther relig
ion X X ✔ X X ✔ ✔ ✔ ✔ ✔ ✔ ✔ ✔ ✔ ✔ 4 D emocrat ✔ ✔ ✔ ✔ ✔ ✔ ✔ ✔ ✔ ✔ ✔ ✔ ✔ ✔ ✔ 0 Republi -can ✔ ✔ ✔ ✔ X ✔ ✔ ✔ X ✔ ✔ X ✔ X X 5 Black/A f. Am. ✔ ✔ ✔ ✔ ✔ ✔ ✔ ✔ ✔ ✔ ✔ ✔ ✔ ✔ ✔ 0 H ispanic ✔ ✔ ✔ ✔ X ✔ X ✔ X ✔ ✔ X ✔ ✔ ✔ 4 A sian ✔ ✔ ✔ ✔ ✔ ✔ ✔ ✔ ✔ ✔ ✔ ✔ ✔ ✔ ✔ 0 O
ther race/ ethnic
evolution acceptance for almost all instruments except the I-SEA microevolution instrument (Table 6).
Identifying as a race/ethnicity in the other race/ethnic-ity category was a negative significant predictor of scores from the I-SEA human evolution acceptance instrument, but no other instrument. Identifying as Catholic, other religion, Black/African American, or Hispanic was not a significant predictor of evolution acceptance scores for any evolution acceptance instrument (Table 6).
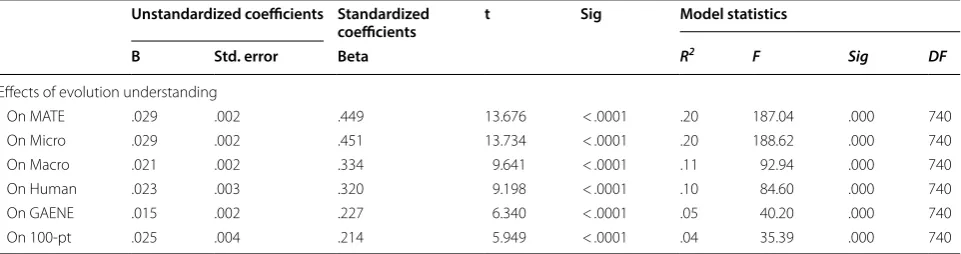
Because the effect of evolution understanding on evo-lution acceptance has been a topic of contention in the evolution education literature, and the observation that the beta coefficients were different across instruments for this variable, we decided to explore the extent to which evolution understanding scores could independently explain evolution acceptance scores across evolution acceptance instruments. We conducted simple linear regressions using evolution understanding as the sole predictor variable for each evolution acceptance instru-ment. Evolution understanding alone was a statistically significant predictor of evolution acceptance across all instruments (F range = 35.39–188.62, p < .001), but the amount of variance in evolution acceptance that could be explained by evolution understanding ranged from 4 to 20% across evolution acceptance instruments. See Table 7 for a summary of the results for these regres-sions looking at the independent effect of understanding
evolution on evolution acceptance across evolution acceptance instruments.
Research question #2 discussion Research results
and conclusions exploring relationships between vari-ables and evolution acceptance differed depending on the instrument used to measure evolution acceptance. First, the coefficients for many predictor variables dif-fered depending on the evolution acceptance instrument, most notably for evolution understanding and identify-ing as a Protestant/LDS. Further, whether college GPA, course level, parent education, evolution understand-ing, identifying as a Protestant/LDS, Muslim, Democrat, Republican, or Asian and other race/ethnicity predicted evolution acceptance was different depending on the evo-lution acceptance instrument used. Similar to what has been reported in the literature, we saw that the strength and statistical significance of the relationship between evolution understanding and evolution acceptance was variable across instruments. Why does evolution under-standing predict evolution acceptance differentially according to these different instruments?
First, many researchers use the MATE intending to measure only evolution acceptance, but the MATE has items that require understanding of evolution. So, a stu-dent categorized as fully “accepting evolution,” according to the MATE, needs to have an accurate understanding of evolution, which could have led to stronger relationships
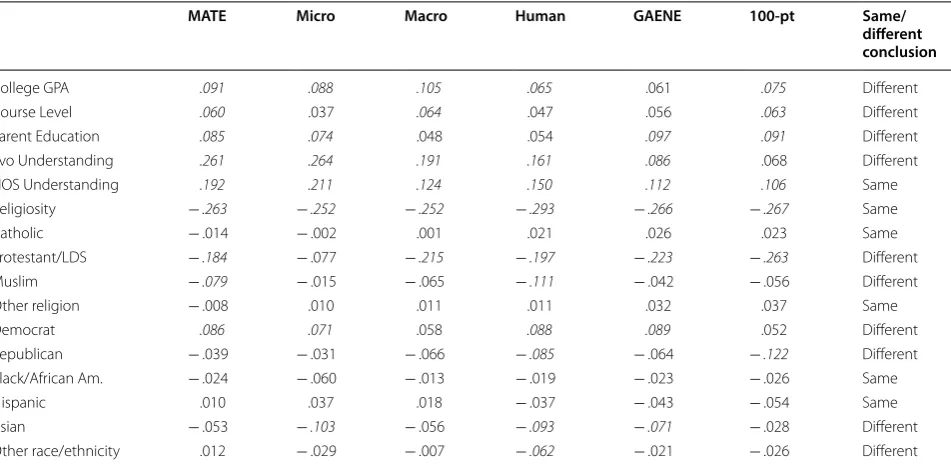
Table 6 Summary of the statistical significance of predictor variables across linear regressions used to determine if conclusions were different across analyses
Middle columns are standardized regression coefficients for six regressions. Each row is a predictor variable included in each regression model. Variables that were statistically significant at p < .05 are italicized. Far right column summarizes whether conclusions were different across models (“same” indicates that the variable was always statistically significant or was always not significant, “different” indicates that the variable was statistically significant in some models but not others)
MATE Micro Macro Human GAENE 100-pt Same/
different conclusion
College GPA .091 .088 .105 .065 .061 .075 Different Course Level .060 .037 .064 .047 .056 .063 Different Parent Education .085 .074 .048 .054 .097 .091 Different Evo Understanding .261 .264 .191 .161 .086 .068 Different NOS Understanding .192 .211 .124 .150 .112 .106 Same Religiosity −.263 −.252 −.252 −.293 −.266 −.267 Same Catholic − .014 − .002 .001 .021 .026 .023 Same Protestant/LDS −.184 − .077 −.215 −.197 −.223 −.263 Different Muslim −.079 − .015 − .065 −.111 − .042 − .056 Different Other religion − .008 .010 .011 .011 .032 .037 Same
Democrat .086 .071 .058 .088 .089 .052 Different
between understanding and accepting evolution. Our results revealed that evolution understanding had among the strongest coefficients when we used the MATE to measure evolution acceptance.
However, we found that evolution understanding had similar beta coefficients for I-SEA microevolu-tion scores. The I-SEA was designed to avoid quesmicroevolu-tions that measure evolution understanding, so the rela-tionship between evolution understanding scores and scores seen on the I-SEA microevolution instrument is likely not due to the same conflation issues that may be occurring with the MATE (Nadelson and South-erland 2012; Smith et al. 2016). However, many peo-ple do not see conflict between their religious beliefs and microevolution (Scott 2005). Therefore, evolution understanding may be more strongly related to I-SEA microevolution scores because a higher understand-ing is able to impact acceptance more strongly in the absence of a belief/identity barrier. Indeed, we found that evolution understanding was more predictive of I-SEA microevolution scores than I-SEA macroevolu-tion and human evolumacroevolu-tion scores. This reasoning aligns with prior research that shows that understanding is more related to acceptance of a topic when an iden-tity barrier is not present (Kahan and Stanovich 2016; Weisberg et al. 2018).
For the I-SEA macroevolution, I-SEA human evolu-tion, and GAENE, our results indicate that evolution understanding is a significant, but weaker, predictor of evolution acceptance. Further, when controlling for other variables, evolution understanding was not at all predictive of 100-pt acceptance scores. But how do these results compare with the findings from prior evo-lution education literature?
The results of this study have the potential to explain the contradictory findings we have seen in the evolution
education literature over the last 30 years. In fact, the results we found here are strikingly similar to the findings we have seen in the literature with regards to evolution understanding. Sinatra et al. (2003), Bishop and Anderson (1990), and Hermann (2012) who used instruments similar to the 100-point instrument, found no relationship between evolution acceptance and evolution understanding, similar to our results in this study. However, researchers who have used the MATE to measure evolution acceptance have often found large significant relationships between acceptance and evolu-tion understanding (Rutledge and Warden 2000; Trani 2004), which is also similar to what we found in this study. Our study, which examines these instruments in the same student population, suggests that different patterns noted in these prior studies may not just be an artifact of different study populations.
Future research
There were several limitations to this study that war-rant future research. This study was restricted to exploring the differences in measurement of evolution acceptance, but researchers studying evolution edu-cation also use very different instruments to measure evolution understanding and Nature of Science (NOS) understanding. We measured these predictor vari-ables with instruments that have been used in several other studies, but results could be different if we used different instruments. For instance, research find-ings may differ if we had used the Conceptual Inven-tory of Natural Selection (CINS) (Anderson et al. 2002) or the Measure of Understanding of Macroevolution (MUM) (Nadelson and Southerland 2009) to measure evolution understanding instead of the EALS because understanding of natural selection may be related to evolution acceptance differently than understanding
Table 7 Summary of simple linear regressions exploring the independent effect of evolution understanding on evolution acceptance across evolution acceptance instruments
Each row contains the results from a linear regression with scores from a different evolution acceptance instrument as the dependent variable, indicated by the row heading. Each coefficient statistic indicates the extent to which evolution understanding scores independently predicted evolution acceptance scores. Each adjusted
R2 value indicates the amount of variance in evolution acceptance scores that can be explained by evolution understanding scores alone
Unstandardized coefficients Standardized
coefficients t Sig Model statistics
B Std. error Beta R2 F Sig DF
Effects of evolution understanding
of macroevolution (Nadelson and Southerland 2010). Additionally, research findings could have been differ-ent if we used the Views of Nature of Science (VNOS) instrument (Abd-El-Khalick et al. 2001) or the Evo-lution and Nature of Science (ENOS) instrument to measure student Nature of Science (NOS) understand-ing. Future research should explore how differential measurement of other constructs other than evolution acceptance may lead to different research findings.
We reported the results from multi-item evolution acceptance instruments in this manuscript. Single item instruments, such as those used by the Gallup or Pew polls (Gallup 2017; Pew 2013), have been used in evolu-tion educaevolu-tion studies that are published in high impact journals (Miller et al. 2006; Weisberg et al. 2018) and are often widely cited as statistics for the US public’s evolution acceptance. An analysis of different single item instruments and how they may lead to different research findings would be of value to the field in future studies.
We treated Likert scale scores as interval data. Although this is a common practice in the analyses of Likert scale data, we recognize that from a measure-ment theory perspective this assumption may not stand (Hambleton et al. 1991).
Finally, we explored how multi-item evolution accept-ance instruments operate in three different undergrad-uate student populations and the differences we found are likely dependent on the specific populations from which we sampled. Future studies should confirm that differences in instruments, particularly those measur-ing acceptance of microevolution, macroevolution, and human evolution are present in other populations of students.
Discussion and conclusion
Evolution education researchers have many different options to measure evolution acceptance, yet this study highlights that the choice of the instrument used to measure evolution acceptance can influence the results and conclusions of a study. We found that whether and how much a variable predicted evolution acceptance was dependent on the instrument used to measure evolution acceptance. Further, we also found that in some cases, and particularly when examining the sub-scales of the I-SEA, whether a researcher would find differences in levels of evolution acceptance across populations of stu-dents was dependent on the evolution acceptance instru-ment used. These findings highlight that the diversity of instruments used to measure evolution acceptance could be an underlying reason for conflicting results in the evolution education literature because people are
comparing studies that used different evolution accept-ance instruments.
Our study was not designed to identify the “best” instrument to measure evolution acceptance, so we can-not give a recommendation for what we think research-ers should use. However, this study does highlight the need for the evolution education community to be more specific about what is meant by “acceptance of evolution” and to take steps to improve the alignment of their research questions with their evolution accept-ance instrument. Some of these instruments use specific items to elicit student acceptance of evolution, whereas some instruments ask broad questions that allow stu-dents to use their own definitions of what it means to accept evolution. The underlying issue may be that there are many different definitions of acceptance of evolution (Smith 2009a, b; Smith et al. 1995, 2016). If different evo-lution acceptance instruments were built using different definitions of evolution acceptance, then these instru-ments were built to measure different constructs, even if researchers all use the term “evolution acceptance.” Does evolution acceptance only include microevolution or does evolution acceptance also include macroevolution and human evolution (Nadelson and Southerland 2012)? To what extent does someone need to understand evolu-tion and the Nature of Science (NOS) to accept evoluevolu-tion (Rutledge and Warden 1999)? To what extent does some-one need to advocate for evolution to accept evolution (Smith et al. 2016)? Is it enough to simply let respond-ents define evolution for themselves in surveys or do the researchers need to define evolution for the respondent (Bishop and Anderson 1990; Sinatra et al. 2003)? Our study provides empirical evidence that it is important for researchers to be thoughtful about what the evolu-tion educaevolu-tion community actually wants to measure when they measure evolution acceptance. Different instruments will measure different aspects of evolution acceptance and may then influence the conclusions that researchers will draw.