Simulation of a seed opener using the discrete element method
(DEM)
Qun Gao
1, Ying Chen
2*, Haibo Zhou
1*, Mohammoad. Almin Sadek
2(1. College of Mechanical Engineering, Jiamusi University, Jiamusi, Heilongjiang Province, China; 2. Department of Biosystems Engineering, University of Manitoba, Winnipeg, Manitoba, Canada.)
Abstract: Soil disturbance and draft force are important soil dynamic properties and performance indicators for a seed opener. In this study, a model was developed to simulate soil dynamic properties of a hoe type seed opener using PFC, a modelling tool which employed the discrete element method (DEM). To validate the model, a paired-row hoe opener was tested in a sandy loam soil at a target working depth of 40 mm and a travel speed of 7 km/h. Soil disturbance characteristics (maximum soil surface roughness and soil cover depth) and draft force of the opener were measured. The model results agreed well with the test results, with relative errors under 10%. The validated model was used to compare the soil dynamic properties among a single-row opener (without wings), a side-band opener (with one wing), and a paired-row opener (with two wings). The results showed that the single-row opener produced a 34% smoother soil surface, 29% more soil cover for seeds, and 48% lower draft force, when compared to the other two winged hoe openers. Further simulations were performed to examine the soil dynamic properties as affected by the wing angle () and face angle () of opener. Varying the of an opener from 0 to 43°made significant differences in the resultant soil dynamic properties, whereas the had little effect. To improve a winged opener, one should select a of 5º and a of 50º for the soil condition studied.
Keywords: Soil, disturbance, force, hoe, opener, DEM, PFC
Citation: Gao, Q., Y. Chen, H. Zhou, and M. A. Sadek. 2015. Simulation of a seed opener using the discrete element method (DEM). Agric Eng Int: CIGR Journal, 17(3): 72-82.
1 Introduction
1Openers are the major components of seeding
equipment. Common types of openers include hoes,
sweeps, discs, and shovels. In Western Canada, hoe type
openers are popular due to their high precision of seeding
depth (Darmora and Pandey, 1995; Doan et al., 2005).
During a field operation, openers interact with soil, and
the interaction can be characterised by dynamic
properties, such as soil disturbance and draft force.
Commercially available hoe openers often throw too
much soil (Hasimu and Chen, 2014), resulting in high soil
surface roughness and insufficient soil to cover seeds.
High soil surface roughness can cause damage to the
combine header during the harvest. Also, higher soil
Received date: 2015-02-07 Accepted date:2015-07-13 *Corresponding author: Y. Chen. Department of Biosystems Engineering, University of Manitoba, Winnipeg, Manitoba, Canada. Email: [email protected]
roughness may imply higher draft force requirement.
Insufficient soil cover depth has adverse effects on the
crop emergence and yield. Draft force has a direct effect
on power requirements of the seeders. Higher draft force
of an opener means that higher tractor power is required
for seeding operation.
Soil disturbance and draft force are affected by several
factors, such as geometry of opener, working depth, and
travel speed of opener. Working depth is often preset
based on the type of crop. Travel speed is often set as
high as possible (such as 10 km/h) in Western Canada
due to the large acreages. Furthermore, effects of depth
and speed have been well documents for soil engaging
tools (e.g. Rahman et al., 2005; Chen et al., 2013b;
Hasimu and Chen, 2014). The only factor that can be
likely varied is the opener geometry. The geometry of a
hoe opener varies from single-row, side-band, to
paired-row openers. A single-row opener features a
centre of the opener. A side-band opener features an
additional wing. It delivers a row of seeds and a row
granular fertilizer as well. A paired-row opener features
two additional wings and delivers a row of fertilizer in the
middle and two rows of seeds on the sides. These three
different hoe openers were expected to have different
characteristics in terms of soil dynamic properties. In
addition to the variation of opener types, a given type of
hoe opener may have different rake angles. Comparisons
between various openers would reflect the effects of the
geometrical parameters, which is essential for selecting
and designing of hoe openers.
To study dynamic properties of opener, this study took
modelling approach because of several factors. Firstly,
hoe openers have various geometrical parameters; tests of
each parameter require fabrications of many prototypes
and would be very time consuming. Secondly, seeding
operation concerns only a thin layer of soil (typically
around 50 mm), and it is difficult to characterise this
small domain in a field condition, due to the highly
non-homogeneity of fields where soil surface roughness
can be as high as 50 mm. Modelling approach allows for
investigating different combinations of tool geometrical
parameters and minimising the variations of results.
PFC3D (the Particle Flow Code in Three Dimensions),
was used to model soil-opener interaction in this study.
PFC3D employed the Discrete Element Method (DEM) to
simulate dynamic behaviours of material. PFC3D has been
recognised as an effective tool to simulate soil-tool
interaction in agriculture. In developing a soil-subsoiler
model, van der Linde (2007) reported that PFC3D could
simulate the vibration motion of subsoiler during its
operation in soil. Tamás et al. (2013) developed a
soil-sweep model using PFC3D to predict draft forces and
soil loosening defined by soil porosity changes. PFC3D
was used to simulate soil-blade interaction (Mak, et al.,
2012) and soil-sweep interaction (Mak and Chen, 2014),
aiming to calibrate model parameters through comparing
draft forces simulated and those predicted using the
Universal Earthmoving Equation (UEE) (McKyes, 1985).
In a soil-tool model, Sadek and Chen (2014) performed
sensitivity analysis of model parameters and monitored
the thrown-soil resulting from a simple tool. Chen et al.
(2013a) simulated soil surface and furrow characteristics,
but they did not simulate soil surface roughness and soil
cover depth which were the focus of this study.
Although significant amount of PFC3D simulations has
been devoted to monitor soil cutting forces and calibrate
model parameters, there was limited information on soil
disturbance. Also, none of the existing simulations dealt
with hoe openers and effects of opener geometrical
parameters. The objectives of this study were to: (1)
develop a soil-opener model using PFC3D to simulate soil
dynamic properties of a hoe opener, (2) validate the
model using tests from a sandy loam soil, and (3) use the
model to simulate soil dynamic properties as affected by
the opener geometry.
2 Methodology
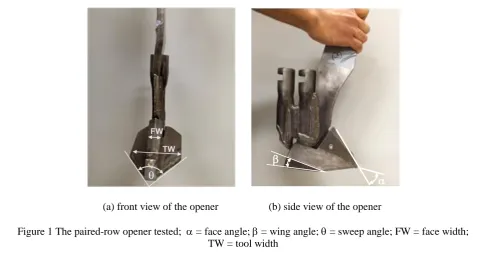
2.1 Description of the opener
The hoe opener tested in this study was a paired-row
opener (Figure 1) featuring a narrow cutting face, two
wings and an edge-on curved shank. The paired-row
opener delivered granular fertiliser at the centre and seeds
on the sides. Fertilizer and seed tubes were positioned
behind the shank. The main geometrical parameters of the
opener are summarised in Table 1. As labelled in Figures
1a and 1b, the face angle () and wing angle () were
2.2 Laboratory tests
2.2.1 Testing facility and soil condition
To serve the purpose of model validation, the opener
shown in Figure 1 was tested in a soil bin at the Soil
Dynamic and Machinery Lab, University of Manitoba,
Canada. The soil bin was 10 m long and 1.0 m wide. The
soil texture was sandy loam (70% sand, 16% silt, and 14%
clay). The soil preparation procedure included spraying
water, tilling, levelling, and compacting. The initial soil
moisture content was 23% (dry basis) and dry bulk
density was 1300 kg/m3, measured using the soil core and
oven-dry method. For details of the soil bin facility and
soil preparation, the reader is referred to Hasimu and
Chen (2014).The opener was tested at a target working
depth of 40 mm and a travel speed of 7 km/h. The test
was replicated three times.
2.2.2 Measurements
During a test run, draft force was measured using a
plate dynamometer installed between the carriage and the opener’s toolbar (Hasimu and Chen, 2014). As the opener
travelled, the soil dislodged by the opener and formed a
soil surface profile featuring a central “valley” and two side “mounds” (Figure 2a). Such a soil surface profile
was characterised with the parameters shown in Figure 2b:
depth of the valley (H) (the distance from the bottom of
the valley to the original soil surface), the height of soil
mounds (h) (the distance from the very top of the mound
to the original soil surface). The sum of h and H reflect
the maximum surface roughness after the seeding.
𝑅 = ℎ + 𝐻 (1)
Where, R is the maximum soil surface roughness, mm; h
is mound height of soil surface profile, mm; H is valley
depth of soil surface profile, mm.
Another important variable is soil cover depth (Ds),
also named as backfill soil depth, which refers to the
depth of the loose soil above the furrow bottom,
reflecting amount of loose soil on top of seeds. These
characteristics can be visualised in Figure 2b using the
soil surface profile (top curve), furrow profile (bottom
curve), relative to the seed (dot), and the original soil (a) front view of the opener (b) side view of the opener
Figure 1 The paired-row opener tested; = face angle; = wing angle; = sweep angle; FW = face width; TW = tool width
Table 1 Geometrical parameters of the paired-row opener
Opener geometry
Face angle ,º
Wing angle, º
Sweep angle, º
Face width, mm
Opener total width, mm
Value 43 18 53 25 127
surface. Assuming seeds are placed to the very bottom of
the furrow, the soil cover depth was obtained using the
following equation:
𝐷𝑠= 𝐷 − 𝐻 (2)
Where, Ds is soil cover depth, mm; D is opener working
depth, mm.
It is important to note that the opener working depth (D)
is not necessary the actual soil cover depth. Typically,
larger Ds and smaller R correspond to better performance
of an opener, under the same D.
2.3 Model development
PFC3D was used for the model development. The
model development included constructing a soil-opener
model, validating the model using the test results, and
applying the model to different opener geometries.
2.3.1 Soil-opener model
Model openers with various geometries were first
constructed using CAD (Inventor) drawing, and then
imported into PFC3D. An example of the model opener is
shown in Figure 3a. It was a simplified version of the real
opener mentioned above. However, the general
geometrical parameters listed in Table 2 were the same as
the real opener. Soil particles were represented by 10 mm
(diameter) spherical particles. A model soil bin (1.0 m
long and 0.8 m wide) was used to confine soil particles
(Figure 3b). First, the bin was filled with sufficient
numbers of particles, and the program was cycled to
allow for the particles to settle properly (maximum
unbalance force of particle contacts reached 1x10⁻³ N).
Then, particles above the set soil surface were removed to
form a levelled soil surface so that the working depth of
opener could be controlled precisely to the desired
working depth. The final depth of the particle assembly
was 0.1 m, containing approximately 96,000 particles.
Different colours were used for particles in the bottom
layer (green), in the top layer (blue), and near the centre
of the opener path (turquoise) for better visualisation of
soil particle flow. Given the known number of model soil
particles and the volume of the model soil bin, the
particle density was determined to be 2179 kg/m3, so that
the bulk density of the domain matched the actual soil
bulk density used in the tests (1300 kg/m3). For
simulations, the model opener was run in the model soil
bin at a speed of 7 km/h and a working depth of 41 mm as
in the tests.
(a) soil surface after the opener passage (b) definitions of the characteristics of soil profile
Figure 2 Soil surface profile; H is the depth of the valley; h is the height of soil mound; D is the opener working depth; Ds is the soil cover depth
Mound Mound
Valley
Soil surface H
h
D Ds
Bonds were added between soil particles to mimic
the cohesive behaviour of agricultural soil. This was done
using the parallel bond model (PBM) implemented in
PFC3D (Potyondy and Cundall, 2004) with a bond radius
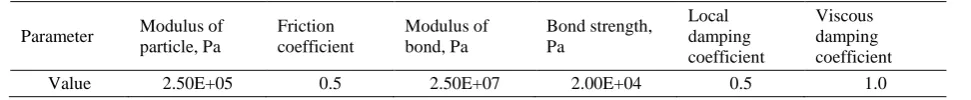
multiplier of 0.5. The particle parameters of the PBM
have been calibrated by Sadek and Chen (2014) for the
soil used in the tests of this study, and those parameters
are listed in Table 2.
2.3.2 Monitoring of soil dynamic properties
The draft force of opener was the total force on the
opener along the travel direction (y direction in this case),
which is a ready-to-use feature of PFC3D. Figure 4a
shows a typical curve of draft force monitored over the
travel distance from y=0 to y=1 m (the total length of the
model soil bin). Between approximately 0.2 and 0.8 m
along the soil bin, the force was in a steady state, and the
average force over the stable section (from 0.3 to 0.7 m)
was taken as the draft force of the opener.
PFC3D did not have a ready-to-use feature for
monitoring soil disturbance characteristics. In this study,
monitoring was done through examining soil
cross-sections. Like in the real tests, a “valley and mounds” surface profile was formed after the passage of
the model opener (Figure 4b). One could see some soil
back fill in the furrow. These phenomena reflected well
what have been observed in the real tests. PFC3D allows
the user to obtain the coordinates of any location on the
cross-section. Using those coordinates, one was able to
obtain the values of H and h, defined in the same way as
in the tests. These variables were monitored in five
cross-sections (y=0.3, 0.4, 0.5, 0.6, and 0.7 m) within the
stable section of the soil in. The average of those five
values was presented. Then the variables, R and Ds, were
determined using Equations (1) and (2).
(a) draft force-distance curve
(b) soil cross-section showing the surface profile
Figure 4 Snapshots of simulations; the particle assembly
was 0.8 m wide and 0.1 m high
0 50 100 150 200
0.0 0.5 1.0
D
raft fo
rc
e
/N
Opener travel distance/m
(a) model opener (b) model soil assembly
Figure 3 Soil-opener model; y is the opener travel direction
Table 2 Parameters of model particles (Sadek and Chen, 2014)
Parameter Modulus of particle, Pa
Friction coefficient
Modulus of bond, Pa
Bond strength, Pa
Local damping coefficient
Viscous damping coefficient
2.3.3 Model validation
The soil-opener model was run to simulate the draft
force and soil disturbance characteristics; each run took
about five hours. The simulated results were compared
with those measured in the tests.
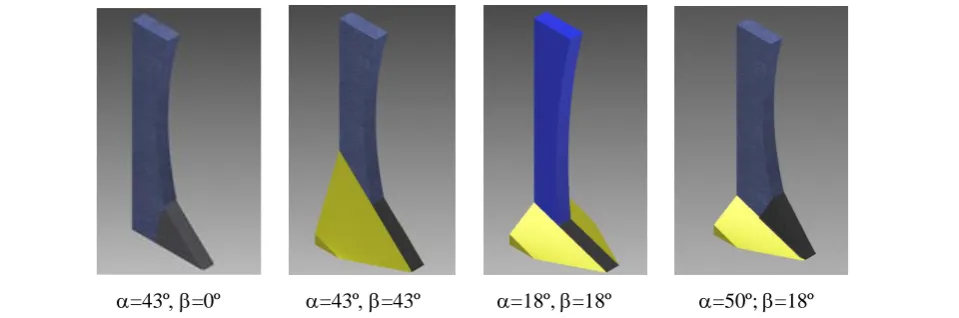
2.3.4 Model applications
Three sets of applications were performed using the
validated soil-opener model. The application I was to use
the model to compare a paired-row opener, a side-band
opener, and a single-row opener. The 3D drawing of the
paired-row opener had a of 18º and a of 43º. Based
on this drawing, the side-band opener was formed by
removing one of the wings, and the single-row opener by
removing two wings, and other dimensions were
remained unchanged. The application II was to use the
model to examine effects of ranging from 0º to 43º,
while keeping the being constant, 43º. The application
III was to examine effects of ranging from 18º to 90º,
while keeping the being constant, 18º. Table 3
summarises these three applications, and Figure 5 shows
some examples of the openers used in the simulations. All
simulations were done at a travel speed of 7 km/h.
Table 3 Summary of the model applications
Case Type of
opener[1] Face angle (º
Wing angle (º Application I SR, SB, PR 43 18
Application II PR 43 0, 10, 18, 30, 43
Application III PR 18, 30, 43, 50, 60, 70, 80, 90 18
Note: [1] SR, SB, and PR stand for single-row, side-band, and paired-row openers respectively.
3 Results and discussions
3.1 Test results and model validation
The average actual working depth of the opener in
the tests was 41 mm that was close to the target depth, 40
mm. The simulation was also run also at the 41mm depth,
so that simulations and measurements were comparable.
The agreement between simulations and measurements
was assessed using the relative error defined as:
RE =|M−S|M 100% (3)
Where, RE = relative error, %; M = measured value; S =
simulated value.
The soil cover depth simulated was 18 mm which
matched exactly the measured value (Table 4). The
average of the maximum surface roughness from the tests
was 46 mm; that simulated was slightly lower. The
simulation produced an average draft force of 131 N,
which was slightly higher than the measured force. The
discrepancyies between the tests and simulations could be
caused by the inaccuracy of the measurements. Overall,
simulated and measured dynamic properties were
comparable. The maximum RE between simulations and
measurements was 9%. Relative error below 20% is
considered to be good agreement (Assefa and Chen,
=43º=0º =43º=43º =18º,=18º =50º;=18º
2008). This demonstrated that the soil-opener model was
suitable for simulations of the soil dynamic properties.
Table 4 Comparison of average values simulated and measured for the paired-row openerworking at 41
mm depth
Variable
Maximum roughness (R), mm
Depth of soil cover (Ds), mm
Draft Force (F), N
Measurement 46 18 121
Simulation 42 18 131
Relative error (%) 9 0 8
3.2 Model applications
3.2.1 Application I -comparison of opener types
Through visual observations during simulations, one
found obvious differences in the resultant soil surface
profiles between opener types under the same working
depth. This is illustrated by the snapshots of the soil
cross-sections (Figure 6). The single-row opener created
smaller valley and mounds (Figure 6a) as compared with
the other two openers. The soil mounds of the side-band
opener were non-symmetric, i.e. the heights of the two
soil mounds were different (Figure 6b). The higher
mound was the result of the wing side of the opener, and
the lower mound was the result of non-wing side. The
soil surface profile of the paired-row opener was
symmetric (Figure 6c) as that of the single-row opener,
and the former opener produced greater valley and
mounds.
(a) single-row opener
(b) side-band opener
(c) paired-row opener
Figure 6 Screenshots of soil cross-sections from
simulations of different types of openers; colours show
different soil layers and the centre zone of the tool path
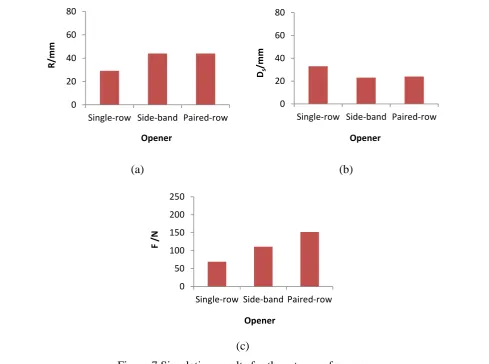
Simulated values of soil dynamic properties were
compared among the three openers. The values of R were
averaged over the two mounds on two sides of opener.
The results showed that the paired-row opener caused the
roughest soil surface, as indicated by the highest R value;
the single-row opener caused the least; and the side-band
opener was intermediate (Figure 7a). These differences
may be attributable to the differences in the total working
width of the opener. Soil disturbance (including soil
roughness) is more pronounced for a wider tool (McKyes,
1985), and such effects of tool working width on soil
disturbance and soil movement have been documented in
the past (e.g. Chen and Ren, 2002; Rahman et al., 2005).
Hasimu and Chen (2014) reported a similar finding where
a non-winged hoe opener disturbed less soil, as compared
with a winged hoe opener. The trend of Ds was the
reverse of that of R (Figure 7b), meaning that the
single-row opener had the best seed coverage, and the
paired-row opener had the least seed coverage, under the
same working depth. Draft force requirement was the
least for the single-row opener, followed by the side-band
opener, and then the paired-row opener (Figure 7c). This
is consistent with the finding from Hasimu and Chen
(2014) who found that a non-winged hoe required lower
draft force than a winged hoe opener. Since tractor power
requirement is proportional to the draft force under the
same travel speed, the results imply that lower tractor
power will be required by the single-row opener.
Based on the simulation results, the opener
performance can be ranked as
single-row<side-band<paired-row, considering all
variables (R, Ds, and F) studied. The results can also be
interpreted to examine the impact of wing, giving the
facts: all three openers had the same face width and ;
the single-row opener had no wings; the side-band opener
had one wing; and the paired-row opener had two wings.
Adding a wing to a single-row opener resulted in
significantly changes in the resultant soil dynamic
properties, and adding two wings resulted in even more
in 29 mm, 33 mm, and 69 N for R, Ds, and F respectively.
Adding one wing increased the R by 22%, decreased the
Ds by 10%, and increased the F by 61%; adding two
wings increased the R by 51%, decreased the Ds by 27%,
and increased the F by 120%. Wings are designed for a
wide seed spread. However, one should be noted the
disadvantage of using winged openers, such as rougher
surface, less soil covering seeds, and more tractor power
requirement. These pieces of information are very
important for the selection of type of opener.
3.2.2 Application II - effects of wing angles of paired-row
opener
Variation of draft force (F) with the had an
increasing trend (Figure 8a). At the zero , the F of the
paired-row opener was 69 N. As the was increased, the
F increased in a non-linear fashion. From 0 to 10º angle,
the F increased by 106%; the next increment of (from 10
to 18º) resulted in only 7% increase in F; then, every 10º
increase in gave an approximately 16% greater F; the F
at the greatest (43º) was 204 N. The results imply that
higher will require higher tractor power. For example,
the tractor power required to operate the openers with a
43º rake angle will be three times the tractor power
required to operate the openers with a 0º rake angle.
As the was increased, the opener produced
increased soil surface roughness (R), represented by the
increasing line in Figure 8b, and decreased soil cover
depth (Ds), represented by the decreasing line in the same
figure. Based on these results, the design point of the
should be the intersection of the two lines, and the
intersection was located at a of approximately 5º. Using
a larger , one will expect a higher R and a lower Ds,
which is not desirable. At the 5º rake angle, the draft
force was also in the low range.
(a)
(b)
(c)
Figure 7 Simulation results for three types of opener
0 20 40 60 80
Single-row Side-band Paired-row
R
/m
m
Opener
0 20 40 60 80
Single-row Side-band Paired-row Ds
/m
m
Opener
0 50 100 150 200 250
Single-row Side-band Paired-row
F /
N
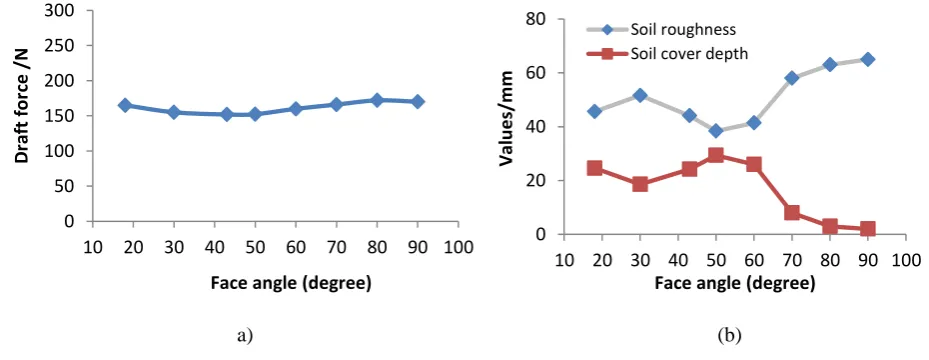
3.2.3 Application III - effects of face angles of paired-row
opener
The simulated force curve was relatively constant
over the entire range of (18º to 90º) (Figure 9a), when
compared to the simulated force curve over the . This
means that had less impact on the F of the opener. This
may be explained by the narrow width (25 mm) of the
face, relatively to the width of the wing (127 mm). The
narrow face would contribute less to the soil cutting and
therefore to the F of the opener. The lowest F was
observed between 43° and 50º face angles, and a 13%
higher F was observed at the 80º. This difference in F
could be substantial in the case of using a larger airseeder
having a large number of openers.
Effects of on R and Ds showed a mix of increasing
and decreasing trends (Figure 9b), and the reasons were
unknown. From small to larger , initially the two
curves were departing, then approaching, and finally
departing again from each other. The most favourable
performance of the opener was at = 50º where R was
minimum (38 mm) and Ds was maximum (29 mm). In
contrasting, the most undesired was 90º. Considering
all the dynamic properties (R, Ds, and F), the most
appropriate for the opener is 50º.
(a) (b)
Figure 8 Simulation results for different wing angles of the paired-row opener at a constant rake angle of 43º
0 50 100 150 200 250
0 10 20 30 40 50
F/N
Wing angle (degree)
0 20 40 60 80
0 10 20 30 40 50
R
an
d
Ds
/m
m
Wing angle (degree) R
Ds
a) (b)
Figure 9 Simulation results for different face angles of the paired-row opener at a constant wing angle of 18º
0 50 100 150 200 250 300
10 20 30 40 50 60 70 80 90 100
D
raf
t
for
ce
/
N
Face angle (degree)
0 20 40 60 80
10 20 30 40 50 60 70 80 90 100
Val
u
e
s/m
m
Face angle (degree) Soil roughness
From the aforementioned effects of both and ,
one should not try to vary the to manipulate the draft
force. Instead, reducing the is an effective way to
reduce the draft force of a hoe opener. Different impacts
of these two angles may have implications in using the
Universal Earthmoving Equation (UEE) in the traditional
soil dynamic theory (McKyes, 1985). In the UEE, the
draft force of a tool is proportional to the rake angle of
the tool. This theory refers to a simple tool, i.e. a blade.
The definition of the rake angle of a blade is straight
forward. However, the rake angle of a paired-row opener
is hard to define. A paired-row opener consists of a face
and wings. The question is which angle, or , is more
logical to be taken as the rake angle. Based on the more
dominant features of the found in this study, one should
take the of the opener as the rake angle of tool when
applying the UEE.
4 Conclusions
In this study, a soil-opener model was developed
using PFC3D, a DEM software. The model was able to
simulate the soil dynamic properties (maximum soil
surface roughness, soil cover depth, and draft force) of a
hoe opener. The model was validated with test results
from a sandy loam soil, and the model was used to
examine effects of opener geometrical parameters on the
soil dynamic properties. The following conclusions were
drawn.
The soil-opener model was suitable to simulate soil
dynamic properties (soil surface roughness, cover
depth, and draft force), as indicated with the low
errors (less than 10%) relatively to test results.
As compared with the single-row opener without
wings, the side-band opener and the paired-row
opener increased the soil surface roughness,
decreased the soil cover depth, and increased the
draft force.
Higher wing angle resulted in greater soil surface
roughness and draft force, and smaller soil cover
depth.
There was little effect of face angle on the soil
dynamic properties.
The most appropriate design parameters were 5º for
the wing angle and 50º for the face angle, based on
the simulation results.
The modelling approach proposed in this study can
be used to evaluate the performance of any seed openers,
and guide the design and improvement of any other soil
engaging tools to minimise their soil disturbance and
power requirement. The limitations of this study include
that the model was validated only for one type of opener
(paired-row) and one type of soil (sandy loam), and the
opener geometry was varied only on the wing and face
angles. Further research should be carried out on more
soil types and opener geometrical parameters.
Acknowledgements
This work was supported by the Natural Sciences
and Engineering Research Council of Canada (NSERC),
the National Natural Science Foundation of China
(51175188), Jiamusi University postgraduate technology
innovation project (LZZ2014_010), and Science and
Technology Innovation Team Building Project
(Cxtd-2013-01).
References
Assefa, B., and Y. Chen. 2008. Simulation of the lateral movement of NO3-N in soils following liquid manure injection.
Canadian Biosystems Engineering, 50(2): 17-26.
Chen, Y., L.J.Munkholm, and T. Nyord. 2013a. A discrete element model for soil-sweep interaction in three different soils. Soil & Tillage Research, 126(1): 34-41.
Chen, Y., L. J. Munkholmb, and T. Nyord. 2013b. Selection of design parameters for a slurry injection tool.Transactions of the ASABE, 56(5): 1653-1663.
Chen, Y., and X. Ren. 2002. High performance tool for liquid manure injection. Soil & Tillage Research, 67(1): 75-83. Darmora, D.P., and K. P. Pandey. 1995. Evaluation of performance
of furrow openers of combined seed and fertiliser drills. Soil & Tillage Research, 34(2): 127–139.
Hasimu, A., and Y. Chen. 2014. Soil disturbance and draft force of selected seed openers. Soil & Tillage Research, 140(7): 48-54.
Mak, J., and Y. Chen. 2014. Simulation of draft forces of a sweep in a loamy sand soil using the discrete element method. Canadian Biosystems Engineering, 56(2): 1-7.
Mak, J., Y. Chen, and M. A. Sadek. 2012. Determining parameters of a discrete element model for soil–tool interaction. Soil & Tillage Research, 118(1): 117–122.
McKyes, E. 1985. Soil Cutting and Tillage. New York, USA: Elsevier.
Potyondy, D.O., and P. A. Cundall. 2004. A bond-particle model for rock. International Journal of Rock Mechanics & Mining Science, 41(8): 1392-1364.
Rahman, S., Y. Chen, and D. Lobb. 2005. Soil movement resulting from sweep type manure injection tools. Biosystems Engineering, 91(3): 379-392.
Sadek, M.A., and Y. Chen. 2014. Microproperties calibration of discrete element models for soil-tool interaction. ASABE/CSBE Paper No. 1911030. St Joseph, MI, USA: ASABE.
Tamás K., I. J. Jóri, and A. M. Mouazen. 2013. Modelling soil– sweep interaction with discrete element method. Soil & Tillage Research, 134(11): 223–231.