The Effect of Performance on Israeli Equity Fund Flows
Ofer Arbaa1, Eva Varon2 & Uri Benzion3 1
Department of Economics and Management, Ruppin Academic Center, Emek Hefer, Israel 2 Graduate Masters in Finance, London Business School, London, UK
3
Department of Economics, Ben Gurion University (Retired) Beer-Sheva, Israel
Correspondence: Ofer Arbaa, Ruppin Academic Center, Department of Economics and Management, Emek Hefer, Israel
Received: September 13, 2017 Accepted: October 16, 2017 Online Published: October 25, 2017
doi:10.5430/afr.v6n4p272 URL: https://doi.org/10.5430/afr.v6n4p272
Abstract
This paper examines the influence of past performance on Israeli equity mutual funds' net flows between January 2004 and July 2014, using the most recommended and reliable two-cluster regression methodology. Apparently, Israeli investors are more sensitive to risk adjusted returns than absolute returns and the most recent performance seems to be more influential on fund flows than on longer-term past performance. Moreover, investors flock to the latest winners and do not leave the funds with the poorest performance. The effect of past performance seems to be more salient on flows of advertised funds than of those with no advertisement. The results in Israel augment the scant work on mutual fund flows outside the US and add support to a growing body of literature documenting irrational investor behavior worldwide.
Keywords: Cluster robust standard errors, Israeli equity funds, Overweighing, Convexity, Sharpe ratio, Jensen's alpha
1. Introduction
This article investigates the effect of past performance on money flows to Israeli equity mutual funds between 2004 and July 2014. So far, no research has investigated this topic. Most of the recent research in Israel are on provident funds (Steinberg and Porath, 2013; Arbaa and Benzion, 2016; Arbaa and Varon, 2017) and there is minor financial research on mutual fund performance using Israeli data (Abudy, Barel and Wohl, 2016). In addition to analyzing the influence of several performance measures on equity fund flows, our research is the first to check evidence of overweighing of recent observations and convexity in Israel. We furthermore investigate if advertising is an important factor to fund flows, and whether it changes the performance-flow relationship for equity funds. To address this issue, we separate our data into two datasets of advertisement and non-advertisement observations.
We aim to expand the limited research on relatively small and risky developing markets since most of the literature covers the US fund industry, which do not directly apply to other countries due to being larger, older and more developed than in other countries (Ferreira, Keswani, Miguel and Ramos, 2013). Over the past decade, the Israeli mutual fund industry experienced a series of reforms, in which the government liberalized the market, enforced transparency and the flow of public information. Therefore, the total assets managed by Israeli mutual funds more than doubled rising from NIS 101 billion in 2004 to NIS 262 billion by the end of 2014. However, growth in the Israeli mutual fund industry arose mainly from the bond funds, whereas the domestic equity mutual funds stayed small and stable in volume (NIS 9.5 billion in 2004 and NIS 8.7 billion in 2014). Therefore, it is an ideal representative for small-scale markets.
errors for possible dependence in residuals and many others use inappropriate measures. This is an important gap in the literature since most of the prior studies rely on methods that produce misspecified test statistics and hence incorrect estimates.
In our analysis, we simulated the panel data with both types of dependence, cross sectional and time series, individually and jointly and compared it with the results of the White standard errors, which is robust to heteroscedasticity but assumes that all observations are independent from one another. We found evidence of both cross sectional and time series dependence in our data set. Therefore, we use two-way cluster robust standard errors to achieve results that are more objective.
2. Literature Review and Hypothesis Development
The influence of fund performance on fund flows has been examined in many studies, which indicate that net flows into a fund are higher when the prior performance of the fund is higher (Barber et al., 2005; Del Guercio and Tkac, 2008; Steinberg and Porath, 2013). Indeed, a fund with good past performance signals to investors that the good performance will persist (Jain and Wu, 2000). Steinberg and Porath (2013) examined the short-term relationship between Israeli provident fund yields and investments between 2003 and 2010. They found that there is a short-term positive momentum between provident fund yields and flows and investors engage in short-term yield chasing. Brborovic and Posedel (2014) studied the small and relatively illiquid equity market in Croatia. They showed that a combination of present and past performance influenced the fund flows. In addition, several researchers have noted the overweighing of recent information in the capital markets, which might imply that recent performance is more important than long-term performance in shaping investor decisions (Arow, 1982; De Bondt and Thaler, 1985; Levy and Levy, 2003).
Patel, Zeckhauser, and Hendricks (1992) and Kane, Snatini, and Aber (1991) reported that previous fund performance adjusted for risk appears to be associated with net inflows into mutual funds. However, Sirri and Tufano (1992) found that raw returns, which are not adjusted for risk appear to drive fund growth. They suggested that "naive retail trend chasers" are even more responsive to the "noisier" measure of unadjusted performance. Recent research by Huang, Wei, and Yan (2012) and Barber et al. (2016) established that investors take into account Jensen’s alpha estimates when allocating capital to mutual funds and that most are sensitive to a fund’s alpha. Moreover, literature suggests that the relationship between fund flows and returns tends to be convex (non-linear); positive returns garner more inflows than the outflows lost due to negative returns (Chevalier and Ellison, 1997; Sirri and Tufano, 1998, Ferreira et al., 2012). Ferreira et al. (2012) analyzed the relationship between flows and performance in a group of 28 countries (excluding Israel) and found a convex relationship worldwide between these two factors, with higher convexity in less developed countries.
Based on the aforementioned literature on performance, we checked whether the following assumptions are true for Israeli equity mutual funds:
H1: The higher the past performance of a fund, the higher its net inflows.
H2: The more recent the performance of a fund, higher the impact on its net flows.
H3: Risk-adjusted past returns influence net inflows more than raw returns.
H4: There is a non-linear relationship between past performance and fund flows.
We also considered the effect of other factors such as the fund expenses (Carhart, 1997: Sirri and Tufano 1998), fund size (Barber et al. 2005; Chen et al. 2004; Chevalier and Ellison 1997; Huang et al. 2007; Zhao 2005), net flows into the fund in previous periods (Jain and Wu 2000), aggregate flows into the fund’s investment category (Del Guercio and Tkac 2002; Huang et al. 2007; Kempf and Ruenzi 2008; Sirri and Tufano 1998). In line with the literature, we found that fund fees and asset size negatively influence cumulative fund flows, while net flows from previous periods have a positive effect. On the other hand, we did not have statistically significant results to conclude that investment category flows have any influence on equity fund flows in Israel.
Sirri and Tufano (1998) defined performance as the greatest influence of investment decisions, in the presence of significant advertisement (or low search costs). Furthermore, Gallaher, Kaniel and Starks (2015) conclude that family advertising could enhance flow-performance sensitivity for highly performing funds. Therefore, we added another dimension to our analysis and tested whether the fund family's advertising might affect the relation between individual fund performance and investor demand with the following hypothesis:
3. Sample
To test our hypotheses, we used a sample of 123 Israeli equity mutual funds that existed in Israel as of December 2003, with a sample period from January 2004 to July 2014. We obtained the dataset for the identified sample and the chosen period from "PREDICTA" (a private market data provider), the Bank of Israel ("BI") and the Tel Aviv Stock Exchange ("TASE"). The "PREDICTA" database contains monthly data on the performance and other characteristics of mutual funds, yielding on average 13,517 monthly observations on equity fund flows, returns, managed assets, Sharpe ratios, Jensen's alphas, management & other fiduciary fees, The Tel Aviv Stock Exchange (TASE) website contains information about the equity funds' categorical net flows. Finally, information about the fund family advertisements come from "Yifat Hon Disk", which distributes information about the capital market through a site of the same name. Our data are free of survivor bias because they include all known funds as of December 2003, the beginning of our sample period.
3.1 Definitions of the Variables
Flows. The vast majority of the current literature measures the percentage of flows rather than the dollar amount of net flows. Given that we are discussing Israeli funds, we will refer to the national currency, the new Israeli shekel (NIS). The measure of the "percentage flows" is based on the assumption that larger funds tend to have larger net NIS flows. However, the correlation between NIS flows and fund size for Israeli funds is negative and significant, which indicates that the larger funds are actually receiving smaller NIS net flows. In addition, "controlling for a potential size effect in a multiple regression format, rather than by scaling the flows, preserves this information for analysis" (Del Guercio and Tkac, 2002, p.535). Consequently, we focused on NIS flows (FLOWS), defined as the change in total assets in excess of appreciation. As in Zheng (1999), we calculated the FLOWS over the period t – 1 to t using the formula:
FLOWS i,t = [ TNAi,t − (1 + RETURNi,t)*TNAi,t−1 ]-MASSETi,t (1)
where:
FLOWSi,t: net flows of fund i at month t,
TNAi,t: the total assets of fund i at the end of month t,
RETURNi,t :the fund’s return during month t,
MASSETi,: additional assets from mergers and acquisitions for fund i during month t, yielding the net new investments by investors.
We calculated the three months' CUMULATIVE FLOWS of fund i at each month by adding the net flows from month t to month t+2
Fund performance and risk. To study the effect of performance on fund flows, we used the following measures:
1. RETURN represents the fund’s net return of last month, of last three months or of cumulative past twelve months. To account for the risk factor of simple return in the regressions, we used the standard deviation of the funfds’ monthly net returns in the past 36 months (SD), in line with Sirri and Tufano (1998).
2. SHARPEt-3 and SHARPEt-12. In line with Zhao (2008), the Sharpe ratio of a fund (Sharpe, 1966) is the ratio between its excess return (return minus risk-free return) and the standard deviation of the excess return (risk adjusted performance) in the preceding three months (or twelve months) for each month t.
3. JENSENt-3 and JENSENt-12. Similar to Zhao (2005); and Abudy et al. (2016), we use a two factor model for Jensen's alpha. For this purpose we compute the fund’s excess return over the average return of the Israeli bond and stock markets in the preceding three months (or twelve months) for each month t. The General Bonds Index includes all the government bonds and corporate bonds traded on the exchange. TA-125-The index consists of the 125 shares with the highest market capitalization that are included in the TA-35 and TA-90 indices (Formerly - TA-100).
4. LOWPERF, MIDPERF and HIGHPERF. We checked convexity in line with Sirri and Tufano (1998) and Zhao (2005), and measured fund performance as its fractional performance rank (RANK), which represents the percentile of its return relative to other equity funds. To apply a piecewise linear regression to test any non-linearity in the relationship between flow and performance (convexity), we created three performance range variables, defined as follows:
LOWPERF = min [RANKi, t, 0.2] (2.1)
HIGHPERF = min [RANKi,t-LOWPERF-MIDPERF, 0.2] (2.3)
LOWPERF represents the bottom performance quintile, MIDPERF represents the middle three performance quintiles, and HIGHPERF represents the top performance quintile.
Fees. This factor includes management and fiduciary commissions. Fees of each month t is on a yearly basis as a percentage of the net assets at the end of month t.
Basic Control Factors.
Fund size (TNA). This factor represents the net fund assets in NIS millions at the end of month t-1.
Flows from previous periods. We calculated this factor in quarterly lags from month t-1 to t-3 and in the same way as our dependent variable (FLOWS).
Investment category net flows. They represent the net flows of all equity funds from the previous month (t-1) as in Sirri and Tufano (1998). However, we used monthly data, whereas data of Sirri and Tufano (1998) is on quarterly basis.
3.2 Summary Statistics
Table 1 summarizes the data collected for the entire equity mutual fund sample and displays separately observations of funds with advertisement and those with no advertisement. We provide data on quarterly net fund flows, net asset size (TNA), return of last month, return of last three months and last twelve months, Jensen’s alpha and Sharpe Ratio of last three months and last twelve months, management fees as a percentage of TNA and last month's category net flows.
In Panel A of Table 1, we compute and report the medians of fund characteristics and their interquartile ranges, which equal the difference between the first and third quartiles. According to Panel A, funds have a median asset size of NIS 34.1 million, monthly return of 1.03%, quarterly return of 2.95% (same period Sharpe ratio is 0.35 and Alpha Jensen is -0.40) and yearly return of 14.26% (Sharpe ratio is 0.75 and Alpha Jensen is -1.42). In addition, funds tend to have quarterly outflows of NIS 0.33 million and have an annual management fee ratio of 2.75%. Outflows are consistent with the funds' negative three-month Jensen’s alpha (JENSEN3), which shows that Israeli equity funds underperformed the market over the previous three months. We also display the means and standard deviations of the fund characteristics in Panel B of Table 1. Using means generates the same qualitative results except for the category flows.
Table 1. Summary statistics of 123 Israeli equity mutual funds, 2004-2014
Without Advertisement With Advertisement
Total
Funds
Panel A: Median (interquartile range 3rd quartile-1st quartile)
-0.34(4.88) -0.31(4.56)
-0.33(4.71) QuarterFlows (NIS mn)
1.24(5.56) 0.82(6.79)
1.03(6.33) Return t-1 (%)
30.90(53.45) 37.20(62.70)
34.10(58.30) TNA (NIS mn)
2.72(0.71) 2.85(0.49)
2.75(0.49) Fees (%)
35.00(507) -16.00(484)
22.50(463) CategoryFlows (NIS mn)
3.50(11.68) 2.47(14.16)
2.95(12.97) Return t-3 (%)
0.43(1.73) 0.30(1.84)
0.35(1.80) Sharpe t-3 (%)
-0.31(3.90) -0.45(4.24)
-0.40(4.07) Jensen t-3 (%)
17.40(24.25) 11.69(32.09)
14.26(27.34) Return t-12 (%)
1.00(1.56) 0.58(1.97)
0.75(1.85) Sharpe t-12 (%)
-0.94(9.29) -1.80(10.32)
Without Advertisement With Advertisement
Total
Funds
Panel B: Mean (standard deviation)
-0.95(15.55) -1.25(18.79)
-1.13(17.57) QuarterFlows (NIS mn)
0.95(5.40) 0.37(6.45)
0.63(6.05) Return t-1 (%)
54.06(68.86) 63.67(83.76)
59.67(78.04) TNA (NIS mn)
2.64(0.62) 2.66(0.54)
2.68(0.67) Fees (%)
1.36(460.06) -20.28(393.69)
-20.72(427.48) CategoryFlows (NIS mn)
3.17(11.23) 1.62(13.37)
2.26(12.55) Return t-3 (%)
0.38(1.27) 0.29(1.24)
0.33(1.25) Sharpe t-3 (%)
-0.42(4.92) -0.81(5.20)
-0.64(5.09) Jensen t-3 (%)
16.87(28.67) 10.32(33.19)
13.01(31.57) Return t-12 (%)
0.87(1.62) 0.55(1.49)
0.68(1.55) Sharpe t-12 (%)
-0.95(11.46) -3.04(12.49)
-2.17(12.11) Jensen t-12 (%)
In the 2nd and 3rd columns of Table 1, we compare advertised funds to funds without advertisement. The table indicates that advertised funds, both on a mean and median level, have significantly lower returns, Sharpe ratios and alphas. Despite advertised funds' significant underperformance relative to other funds, their quarterly net flows are not significantly lower than funds without advertisement. Moreover, whereas category flows of funds without advertisement are positive, category flows of advertised funds are negative prior to advertisement. The results seem to imply that there is a tendency to advertise underperforming funds in Israel rather than those funds with relatively successful performance and that fund families use advertisement to increase their cash flows.
4. Methodology
We used the full sample of 123 equity funds to estimate the following two-way cluster robust standard errors regressions, which account for the fact that observations from the same fund along time and between funds at one point in time are not independent relative to one another. Our goal was to investigate and compare the effect of different forms of performance measures of various time spans on quarterly net fund flows, taking into account other standard and basic control factors. To accomplish this goal, we created the following two models:
Model 1 (Return):
FLOWSi,t = αi+ β1RETURNi,(t-1)or(t-3) + β2RETURNi, t-12 + β3SDi,t-36+ β4FEES1i,t
+ β5TNA,t-1+ β6CUMFLOWSi,t-3+ β7CATEGORYFLOWSt-1+ Ɛi,t (3)
Model 2 (Sharpe/Jensen):
FLOWSi,t =αi+ β1PERFORMANCEi,t-3 + β2PERFORMANCEi, t-12 + β3FEES1i,t+
β4TNA,t-1 + β5CUMFLOWSi,t-3+ β6CATEGORYFLOWSt-1+ Ɛi,t (4)
where all of the factors are as described earlier in "Definitions of the Variables" and Ɛi,t is the error term. FLOWSi,t (the dependent variable) is defined as cumulative net flows of the subsequent three months and represents the investors' short-term behavior. We cluster standard errors using the techniques of Petersen (2009) and Thompson (2011) to address time-series and cross-sectional correlation of the regression errors, as well as heteroscedasticity. The panel regressions of Model 1 and Model 2 show the sensitivity of the flows to different performance -risk measures of changing periods.
We considered the well-documented non-linear relationship between fund performance and flows in a separate regression model by showing performance in percentile ranks, following Zhao (2005) and Sirri and Tufano (1998). We chose the last month's raw return and Sharpe Ratio of the last three months to check convexity because they display the strongest relation with fund flows according to Model 1 and Model 2. The comprehensive models for Convexity after controlling for other factors is as follows
Model 3 (Return):
FLOWSi,t =αi+ β1HIGHRETi,t-1+ β2MIDRETi,t-1+ β3LOWRETi,t-1+ β4 RETURNi,t-12+
β5SDi,t-36+ β6FEES1i,t+ β7TNA,t-1+ β8CUMFLOWSi,t-3+ β9CATEGORYFLOWSt-1+ Ɛi,t (5)
Model 4 (Sharpe):
FLOWSi,t= αi+ β1HIGHSHARPEi,t-1+ β2MIDSHARPEi,t-1+ β3LOWSHARPEi,t-1+ β4SHARPi,t-12+
β5FEES1i,t+ β6TNA,t-1+ β7CUMFLOWSi,t-3+ β8CATEGORYFLOWSt-1+ Ɛi,t (6)
where all of the standard and basic control variables are as in Model 1 & Model 2 and Ɛi,t is the error term.
5. Results and Discussion
5.1 Two-way Cluster Robust Standard Errors & Other Methods
The below table shows the differences in results of various approaches to address cross sectional and time series dependence. The following approaches; White standard errors (1980) and one-way cluster robust standard errors by firm and/or time are common in financial research. However, White standard errors solve the problem of heteroscedasticity and assume that observations are uncorrelated and one-way cluster robust standard errors address only one of two dependencies but not both (Petersen 2009). We compare these common methods to the two-way cluster robust standard errors (CL-2), which is robust to both time series and cross sectional correlation. Petersen suggests that clustering standard errors by both firm and time might be necessary in finance, when the standard errors clustered by firm and by time are much larger than the White standard errors. In Table 2, we give evidence of both firm and time effect in our data. We show the magnitude of two-way cluster robust errors and of one-way standard errors clustered by firm or by time relative to white standard errors in parenthesis in Table 2. All of our independent variables, except for asset size (TNAt-1), have standard errors clustered by firm (Column II) or by time (Column III), which are around two to three times larger than White standard errors (Column I). In addition, Column IV points out even more significant differences between White standard errors and two-way cluster robust errors.
Table 2. Standard Error Results of CL-2 vs ClusterFirm, ClusterTime and White
Column I Column II Column III Column IV Column V Column VI CL-2/ CL-2/ CL-2 Cluster Time Cluster Firm White
Standard Errors ClusterF ClusterT
2.3 1.1 0.09 (×3.0) 0.04 (×1.3) 0.08 (×2.7) 0.03 CUMFLOWS t-3 1.0 2.0 0.48 (×2.5) 0.45 (×2.4) 0.24 (×1.3) 0.19 SHARPEt-3 1.2 1.5 0.49 (×3.3) 0.40 (×2.7) 0.32 (×2.1) 0.15 SHARPEt-12 1.5 1.0 0.74 (×1.7) 0.51 (×1.2) 0.69 (×1.6) 0.44 FEESt-1 0.9 1.5 0.01 (×1.2) 0.01 (×1.4) 0.01 (×0.8) 0.01 TNA t-1 1.1 1.9 0.00 (×3.7) 0.00 (×3.3) 0.00 (×1.9) 0.00 CATEG.FLOWS t-1 (NIS million)
1.7 1.0 2.22 (×1.9) 1.31 (×1.1) 2.14 (×1.8) 1.19 Intercept
errors is in parenthesis. Columns V and VI show the downward bias of one-way standard errors clustered by firm or by time relative to two-way robust standard errors, respectively.
Moreover, we prefer CL-2 to other cluster robust methods because they are much more sensitive to the number of firms and periods. According to Petersen, clustering by two dimensions produces less biased standard errors and the bias is not significant. On the other hand, standard errors clustered by only one dimension are biased downward, whereby the magnitude of the bias depends widely upon the number of clusters and the resulting confidence intervals are too small (Petersen, 2008). Table 2 shows the extent of downward bias in one-way cluster robust standard errors compared to two-way cluster robust standard errors in Column VI and VII.
5.2 Performance- Flow Relationship of Israeli Equity Funds
5.2.1 Influence of Performance on Three Months' Flows
Table 3 presents the estimation results of 123 equity funds for all of the independent variables in two panels. As mentioned earlier in methodology section, we used four regressions, which differ from each other by their performance measure. Panel 1 show results of regressions 1 & 2 according to last one month's and last three month's absolute returns together with those of last twelve months (RETUNt-1& RETUNt-12, RETUNt-3& RETUNt-12). Panel 2 summarizes the results of regression 3 according to last three months' and twelve months' Sharpe ratios (SHARPEt-3, SHARPEt-12) and regression 4 based on last three months' Jensen's alpha estimate (JENSENt-3)
(
Note 1). Hence, in Table 3, we test evidence of overweighing of recent observations according to simple past returns (Panel 1) and risk adjusted returns (Panel 2). Moreover, comparisons across panels enable us to observe the relative importance of risk adjusted returns against raw returns for different periods. In order to compare the effects of raw return to risk adjusted returns on fund flows, we calculate the flow increase from one standard deviation increase in raw return and risk-adjusted returns. Second, we check the flow increase from a 1% increase in the means for the same purpose.Table 3. Determinants of flows into Israeli equity funds
RETURN
Panel 1
0.33(.000)*** RETURNt-1
0.08(.039)** RETURNt-3
0.01(.769) 0.01(.797)
RETURNt- 12
0.13(.562) 0.14(.506)
SDt-36
- 1.66(.031)** - 1.69(.028)**
FEESt
- 0.05(.000)*** - 0.05(.000)***
TNA t-1
0.28(.001)*** 0.29(.001)***
CUMFLOWSt-3
0.00(.445) 0.00(.134)
CATEGORYFLOWS t-1 (NIS million)
5.04(.034)** 4.95(.038)**
Intercept
12,608 12,608
No of Observations
12% 13%
Overall R²*
JENSEN SHARPE
Panel 2
0.20(.014)*** 1.39(.003)***
PERFORMANCEt-3
0.11(.814) PERFORMANCEt-12
- 1.47(.052)** - 1.62(.028)**
FEESt
- 0.05(.000)*** - 0.05(.000)***
TNA t-1
0.28(.001)*** 0.27(.001)***
CUMFLOWSt-3
0.00(.728) 0.00(.168)
CATEGORYFLOWS t-1 (NIS million)
5.73(.010)*** 5.35(.016)**
Intercept
12,629 12,641
No of Observations
12% 12%
The coefficient estimates for each factor (variable) with p-values in parentheses. ***, ** and * indicate statistical significance at the 1%, 5% and 10% confidence levels, respectively. We ran the same regressions with six months' cumulative fund flows as the dependent variable. We reached the same conclusions with a higher R² of 17%.
As expected, almost all of the performance measures show positive and significant correlation with cumulative fund flows (except for RETUNt-12 and SHARPEt-12 with no significance). Hence, the results indicate that past performance is a major positive influence on investment decisions, confirming Hypothesis 1.
The strongest performance –flow relationship appears to be in last month's raw return (Panel 1) and Sharpe Ratio (Panel 2); where a one standard deviation increase is associated with around 2 million NIS and 1.75 million NIS of extra money going into these funds, respectively, at 1% significance
(
Note 2). This might imply that Israeli investors either purchase funds with better risk-adjusted return ratios and/or those that improve their most recent absolute returns. This finding is consistent with Steinberg and Porath (2013), which conclude that Israeli provident fund investors chase funds with high short-term returns. In addition to this, we find that equity fund investors are very sensitive to abnormal returns and invest more in leaders of Sharpe ratio. However, controlling for the time effect, risk-adjusted performance seems to exert a greater effect on flows into equity funds than simple returns. We find that 3 months' Sharpe ratio creates almost twice as many inflows as three months' raw return, consistent with Hypothesis 3. On the other hand, using standard deviation to compare risk adjusted return to absolute return underestimates the effect of Jensen's alpha on fund flows. This is due to the very high standard deviations observed in raw return, despite that the coefficient of last three months' Jensen's alpha is more than double that of the same period raw return. However, when we look to the percentage increase from the mean to compare them (second method), we find that Jensen's alpha is stronger than absolute return.Moreover, results of the two panels prove existence of overweighing of recent observations. In Panel 1 the coefficient of RETURNt-12 is insignificant pointing that, the last twelve months' unadjusted returns have no influence on fund flows. On the other hand, returns of last one month and three months have a significant impact on fund flows at 5% and 1% confidence levels respectively and the influence of last month's return is 4 times higher than that of three months as indicated by their coefficient estimates in Panel 1. We also see strong evidence of overweighing of recent observations in the Sharpe ratios of three months and twelve months in Panel 2. The influence of Sharpe ratio of three months on flows is very high and significant at 1% as opposed to no relation between flows and the Sharpe ratio of last twelve months. Hence, we can conclude that the more recent the equity yields are, the more positive the effect on flows, confirming Hypothesis 2.
When we check for other factors, we observe that Israeli equity fund investors appear to be sensitive to expenses, as shown by the significant coefficient estimates of management fees (FEESt). These findings are not surprising since Carhart (1997) showed that domestic funds with higher fees do not perform as well as domestic funds with lower fees and Sirri and Tufano (1998) documented the sensitivity of domestic fund investors to expenses.
We also find a strong autocorrelation between current net fund flows and those of previous periods (CUMFLOWS t-3) according to the significantly positive coefficient estimates we obtained for quarterly lagged flows (Ben-Raphael, Kandel, and Wohl, 2011; Del Guercio and Tkac, 2002). This is because investors tend to repeat their previous investment decisions, even if they are no longer optimal. Fund size (TNA t-1) adversely affects the rate of net flows to Israeli equity funds, which could indicate that funds reaching a certain size encounter difficulties functioning (Barber et al. 2005; Huang et al. 2007; Zhao 2005). Hence, all of our conclusions are in line with the existing literature except for category flows. We found no relation between fund category flows and cumulative fund flows of the subsequent three months although previous literature supports a positive association (Del Guercio and Tkac 2002; Huang et al. 2007; Kempf and Ruenzi 2008; Sirri and Tufano 1998). This could be due to the time (seasonal) gap between category flows and the individual fund flows. Investors move money into relatively safe fund categories during the autumn and into riskier fund categories during the spring. Therefore, flows to fund categories are strongly dependent on the season as well as on the relative riskiness of the categories (Kamstra, Kramer, Levi, and Wermers, 2015).
5.2.2 Convexity
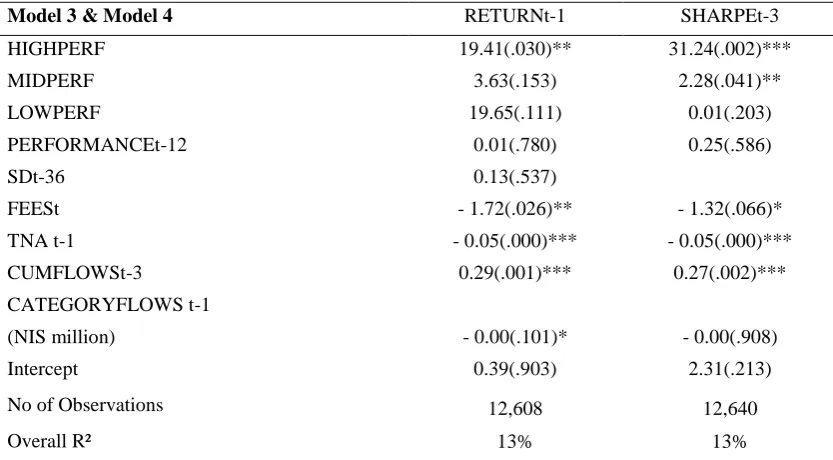
Table 4. Convex relation between fund performance and flows
SHARPEt-3 RETURNt-1
Model 3 & Model 4
31.24(.002)*** 19.41(.030)**
HIGHPERF
2.28(.041)** 3.63(.153)
MIDPERF
0.01(.203) 19.65(.111)
LOWPERF
0.25(.586) 0.01(.780)
PERFORMANCEt-12
0.13(.537) SDt-36
- 1.32(.066)* - 1.72(.026)**
FEESt
- 0.05(.000)*** - 0.05(.000)***
TNA t-1
0.27(.002)*** 0.29(.001)***
CUMFLOWSt-3
- 0.00(.908) - 0.00(.101)*
CATEGORYFLOWS t-1
(NIS million)
2.31(.213) 0.39(.903)
Intercept
12,640 12,608
No of Observations
13% 13%
Overall R²
The coefficient estimates for each factor (variable) with p-values in parentheses. ***, ** and * indicate statistical significance at the 1%, 5% and 10% confidence levels, respectively. We achieved the same results with six months' cumulative fund flows and the accompanying R²s rose to 17%.
Table 4 shows a significantly positive and convex relationship between both Sharpe-ratio-based and return based performance percentile ranks and flows. The estimates of LOWPERF ranges for both performance measures from the piecewise regression are statistically insignificant, implying that investors fail to flee from poor performers. On the other hand, we observe high investor sensitivity to good past performance in the top performance quintiles. It is important to note, however, funds with the highest Sharpe Ratios attract more inflows (1% significance) than those with the highest recent returns (5% significance). These results support the idea that Israeli equity fund investors chase funds with the highest returns, preferably risk adjusted, while they do not punish funds with the lowest performance. As a result, results of Model 3 & 4 suggest evidence of convexity (Hypothesis 4).
5.3 Performance- Flow Relationship of Advertised vs. Non-advertised Funds
5.3.1 Influence of Performance on Flowswith or without Advertisement
In Table 5, we separate our mutual funds into two groups: funds whose family groups advertise and those whose family group do not advertise. Our objective is to determine whether the effect of past performance on fund flows are different for funds that advertise than those that do not advertise. Since advertisements usually furnish past performance data and promote skills of the mutual fund managers, we would expect the advertised mutual funds to enjoy higher net flows from past returns. Therefore, we re-run the regressions of Model 1 & 2 on two sub-samples. We obtain 7509 monthly observations, whereby the fund's family group advertises and 5099 observations with no advertisement.
Table 5. Determinants of flows into advertising and non-advertising funds (three months' flows)
Group II: Funds not advertising Group I: Funds Advertising
RETURN RETURN MODEL 1 0.29(.003)*** 0.36(.000)*** RETURNt-1 0.08(.080)* 0.08(.047)** RETURNt-3 0.03(.196) 0.03(.145) 0.00(.954) 0.00(.883) RETURNt-12 0.27(.347) 0.28(.330) 0.05(.846) 0.07(.773) SD36 -1.56(.261) -1.59(.250) -1.73(.046)** -1.77(.041)** FEESt 0.06(.000)*** -0.06(.000)*** -0.04(.000)*** -0.04(.000)*** TNA t-1 0.12(.026)** 0.13(.012)*** 0.35(.000)*** 0.36(.000)*** CUMFLOWSt-3 0.00(.730) 0.00(.790) 0.00(.235) 0.00(.050)** CATEG.FLOWS t-1 (NIS million)
4.08(.275) 4.03(.279) 5.74(.073)* 5.65(.077)* Intercept 5099 5099 7509 7509
# of Observations
8% 9%
15% 16%
Overall R² (on 3 months' flows)
20% 22%
30% 31%
(on 6 months' flows)
GroupII: Funds not advertising Group I: Funds advertising
SHARPE SHARPE MODEL 2 1.22(.013)*** 1.55(.012)*** PERFORMANCEt-3 0.68(.128) -0.20(.753) PERFORMANCEt-12 -1.65(.222) -1.68(.056)** FEESt -0.06(.000)*** -0.04(.000)*** TNA t-1 0.10(.033)** 0.34(.000)*** CUMFLOWSt-3 0.00(.809) 0.00(.099)* CATEG.FLOWS t-1 (NIS million)
5.24(.144) 5.65(.042)**
Intercept
5123 7518
# of Observations Overall R²
9% 15%
(on 3 months' flows)
21% 30%
(on 6 months' flows)
The coefficient estimates for each factor (variable) with p-values in parentheses. ***, ** and * indicate statistical significance at the 1%, 5% and 10% confidence levels, respectively. It is important to note that we could not use the methodology of Sirri and Tufano (1998) because past performance and advertising (interaction terms) have a high correlation (0.7-0.82). Hence, owing to multicollinearity concerns, these two factors cannot be included in the same regression.
Our empirical results in Table 5 show that indeed funds that benefit from advertising have fund flows that are significantly larger than those funds without advertising, confirming Hypothesis 5. To illustrate, advertised funds receive around 24% and 27% more cash flows than the funds that do not advertise as indicated by their RETURNt-1 and SHARPEt-3 coefficients, respectively. Our results support Sirri and Tufano (1998), that a combination of advertisement and good past performance should be more influential on investor decisions than performance alone.
Table 6. Performance of Israeli equity mutual funds before and after advertising
After advertisement Before advertisement
Mean Performance
0.36 0.40
one month Return (%)
1.37 1.62
three month Return (%)
0.27 0.29
Sharpe3 (%)
5.3.2 Convexity with or without Advertisement
In considering how advertising affects convexity, we analyze Sharpe-ratio-based performance percentile ranks and flows of funds in the presence and absence of advertising. In Table 7, we find that the nonlinear flow-performance relation also holds true at times of advertisement, with convexity at the upper end but much stronger than that observed when there is no advertisement.
Our results suggest that a fund family's advertisement decisions affect only net flows to the highest performing funds. Hence, inflows to performance leaders are much larger at times of advertisement than those of no advertisement. On the other hand advertisement does not seem to influence fund flows to medium and/or low performance groups. For example while there is no relationship between flows and past performance of advertised funds in the mid interquartile range, this relationship is positive and significant for funds of the same group not advertised.
Thus considering advertising expenditure as a strategic decision, the results imply that advertising matters only for the most successful funds in Israel. This might be due to the information content of advertising, which highlights the most successful equities and signals that their good past performance will persist. Advertising reduces search costs for investors and enable them to make more informed decisions. Sirri and Tufano (1998) and Huang, Wei and Yan (2007) made similar conclusions for US equity funds. According to Sirri and Tufano (1998), advertisements often promote the most recent high performing fund and funds with higher fees enjoy flows from high performance that are twice as large as those of their rivals.
Table 7. Convex relation between Sharpe ratio and flows
GroupII: Funds not advertising Group I: Funds advertising
Model 3 & Model 4
18.39(.063)* 39.65(.011)***
HIGHSHARPEt-3
3.62(.022)** 2.13(.104)
MIDSHARPE t-3
0.01(.276) 0.01(.447)
LOWSHARPE t-3
0.76(.050)** -0.02(.971)
SHARPEt-12
-1.38(.292) -1.34(.108)
FEESt
-0.06(.000)*** -0.05(.000)***
TNA t-1
0.10(.038)** 0.34(.000)***
CUMFLOWSt-3
0.00(.372) -0.00(.683)
CATEGORYFLOWS t-1 (NIS million)
2.34(.451) 2.63(.281)
Intercept
5,123 7,517
No of Observations
10% 16%
Overall R²
The coefficient estimates for each factor (variable) with p-values in parentheses. ***, ** and * indicate statistical significance at the 1%, 5% and 10% confidence levels, respectively. We achieved stronger results with six months' cumulative fund flows and the accompanying R²s rose to 27% and 21% for advertising and not advertising observations, respectively.
6. Conclusion
This paper sheds light on the short-term behavior of Israeli equity fund investors, as representative of small scale and developing markets. We attempt to make the first comprehensive study of past performance and other determinants of flows into Israeli equity funds, examining 123 funds between January 2004 and July 2014. We also test whether advertising can be used for increasing money flows into these funds.
flock to funds with the highest short-term yields and Sharpe ratios and are not sensitive to poor performers. This might possibly signify that investors expect good performance to persist and poorly performing funds to change their investment strategy. In addition, we document that Israeli investors consider Sharpe ratios and alphas more than raw returns in their investment decisions.
When we group our mutual fund sample into advertised and not advertised funds, we show that past performance affects flows of advertised funds more than other funds. We also show that the effect of advertisement on net flows is the highest for the best performing funds. Our finding is in line with Siri and Tufano (1998), who suggest that, with advertisement; past performance is a stronger tool to attract fund flows. This is because advertisement increases investor awareness about funds' past performance and reduce search costs for the investors. Therefore, it is not surprising to see advertised funds receiving more cash flows than other funds.
In Israel, mutual fund families of underperforming funds seem to use advertisement as a tool to increase their net fund flows. Moreover, advertisements do not signal future superior performance and advertised funds appear to perform worse than before after the advertisement.
The results are consistent with a growing body of literature documenting that cosmetic effects shape investor behavior. (Barber, Huang, and Odean, 2016; Sensoy, 2009; Ferreira, Keswani, Miguel Ramos, 2012). These investor behaviors are suboptimal, because mutual fund performance does not persist (e.g., Carhart, 1997; Fama and French, 2010).
References
Abudy, M., Barel, M., & Wohl, A. (2016). Performance of Israeli Mutual Funds: Equity and Bond Funds. Israel Economic Review, 13(1), 1-21
Arbaa, O., & Benzion, U. (2016). Asset Allocation or Active Management? Evidence from Israeli Provident Funds.
Accounting and Finance Research, 5(4), 105-114. DOI: https://doi.org/10.5430/afr.v5n4p105
Arbaa, O., & Varon, E. (2017). Do the Israeli Provident Funds have the Ability to Time the Bond and Stock Markets? An Analysis across Alternative Investments. Accounting and Finance Research, 6(2), 169-180. DOI: https://doi.org/10.5430/afr.v6n2p169
Barber, B., Odean, T., & Zheng, L. (2005). Out of sight, out of mind: The effects of expenses on mutual fund flows.
Journal of Business, 78(6), 2095–2120. https://doi.org/10.1086/497042
Barber, B.M., Huang, X., & Odean, T. (2016). Which Risk Factors Matter to Investors? Evidence from Mutual Fund Flows. The Review of Financial Studies, 29(10), 2600–2642. https://doi.org/10.1093/rfs/hhw054
Brborovic, D., Posedel, P. (2014). The Relation between Performance and Flows of Mutual Funds: Case of the Croatian Fund Market. Applied Mathematics, 5(19): 3067-3078. https://doi.org/10.4236/am.2014.519292
Carhart, M. (1997). On Persistence in Mutual Fund Performance. Journal of Finance, 52(1), 57–82. https://doi.org/10.1111/j.1540-6261.1997.tb03808.x
Chen, J., Hong, H., Huang, M., & Kubik, J. (2004). Does Fund Size Erode Mutual Fund Performance? The Role of Liquidity and Organization. American Economic Review, 94(5), 1276–1302. https://doi.org/10.2139/ssrn.372721
Chevalier, J., & Ellison, G. (1997). Risk Taking by Mutual Funds as a Response to Incentives. Journal of Political Economy, 105(6), 1167–1200. https://doi.org/10.1086/516389
De Bondt, W. F. M., & Thaler, R. (1985). Does the Stock Market Overreact? Journal of Finance, 40(3), 793–805. https://doi.org/10.1111/j.1540-6261.1985.tb05004.x
Del Guercio, D., & Tkac, P. (2002). The Determinants of the Flows of Funds of Managed Portfolios: Mutual Funds vs. Pension Funds. Journal of Financial and Quantitative Analysis, 37(4), 523–557. https://doi.org/10.2307/3595011
Del Guercio, D., & Tkac, P. (2008). Star Power: The Effect of Morningstar Ratings on Mutual Fund Flows. Journal of Financial and Quantitative Analysis, 43(4), 907–936. https://doi.org/10.1017/S0022109000014393
Elton, E.J., Gruber, M.J., & Busse, J. (2004). Are Investors Rational? Choices among Index Funds. Journal of Finance, 59(1), 261–288. https://doi.org/10.1111/j.1540-6261.2004.00633.x
Ferreira, M. A., Keswani, A., Miguel, A. F., & Ramos, S. B. (2012). The flow–performance relationship around the world. Journal of Banking and Finance, 36(6), 1759–1780. https://doi.org/10.1016/j.jbankfin.2012.01.019
Ferreira, M. A., Keswani, A., Miguel, A. F., & Ramos, S. B. (2013). The determinants of mutual fund performance: A cross-country study. Review of Finance, 17(2), 483–525. https://doi.org/10.1093/rof/rfs013
Gallaher, S. T., Kaniel, R., & Starks, L. T. (2015). Advertising and Mutual Funds: From Families to Individual Funds. CEPR Discussion Paper No. DP10329. https://ssrn.com/abstract=2554403
Huang, J., Wei, K.D., & Yan, H. (2007). Participation Costs and the Sensitivity of Fund Flows to past performance. Journal of Finance, 62(3), 1273–1311. https://doi.org/10.1111/j.1540-6261.2007.01236.x
Huang, J., Wei, K.D., & Yan, H. (2012). Investor Learning and Mutual Fund Flows (AFA 2012 Chicago Meetings Paper). http://dx.doi.org/10.2139/ssrn.972780.
Jain, P., & Wu, J. (2000). Truth in Mutual Fund Advertising: Evidence on Future Performance and Fund Flows.
Journal of Finance, 55(2), 937–958. https://doi.org/10.1111/0022-1082.00232
Kamstra, M.J., Kramer, L.A., Levi, M.D., & Wermers, R. (2015). Seasonal asset allocation: Evidence from mutual fund flows. Journal of Financial and Quantitative Analysis (Forthcoming). https://doi.org/10.2139/ssrn.1907904
Kane, A., Santini, D., & Aber, J.W. (1991). Lessons from the growth history of mutual funds. Working paper. Boston University, School of Management.
Kempf, A., & Ruenzi, S. (2008). Family Matters: Rankings within Fund Families and Fund Inflows. Journal of Business Finance and Accounting, 35(1-2), 177–199. https://doi.org/10.1111/j.1468-5957.2007.02062.x
Levy, H., & Levy, M. (2003). Overweighing recent observation: Experimental results and economic implications.
Experimental Business Research, 3(7), 155 – 183. https://doi.org/10.1007/b104929
Patel, J., Zeckhauser, R., & Hendricks, D. (1992). Investment Flows and Performance: Evidence from Mutual Funds, Cross Border Investments and New Issues. Working paper. Harvard University.
Petersen, M.A. (2009). Estimating Standard Errors in Finance Panel Data Sets: Comparing Approaches, Review of Financial Studies, 22(1), 435–480. https://doi.org/10.1093/rfs/hhn053
Sharpe, W.F. (1966). Mutual fund performance. Journal of Business, 39(1), 119 - 138. https://doi.org/10.1086/294846
Sirri, E., & Tufano, P. (1993). Buying and selling mutual funds: Flows, performance, fees, and services. Working Paper. Harvard Business School.
Sirri, E., & Tufano, P. (1998). Costly Search and Mutual Fund Flows. Journal of Finance, 53(5), 1589–1622. https://doi.org/10.1111/0022-1082.00066
Steinberg, N., & Porath, Y. (2013). Chasing Their Tails: Inflow Momentum and Yield Chasing among Provident Fund Investors in Israel. Israel Economic Review, 99(1), 71–106. https://ssrn.com/abstract=2271114
Thomson S. (2011). Simple formulas for standard errors that cluster by both firm and time. Journal of Financial Economics, 1(11), 1–10. https://doi.org/10.1016/j.jfineco.2010.08.016
Warther, V.A. (1995). Aggregate mutual fund flows and security returns. Journal of Financial Economics, 39(2-3), 209-235. https://doi.org/10.1016/0304-405X(95)00827-2
Zhao, X. (2005). Determinants of Flows into Retail Bond Funds. Financial Analysts Journal, 61(4), 47–59. https://doi.org/10.2469/faj.v61.n4.2742
Zhao, X. (2008). Determinants of Flows into Retail International Equity Funds. Journal of International Business Studies, 39(7), 1169–1177. https://doi.org/10.1057/palgrave.jibs.8400408
Zheng, L. (1999). Is Money Smart? A Study of Mutual Fund Investors’ Fund Selection Ability. Journal of Finance, 54(3), 901–93. https://doi.org/10.1111/0022-1082.00131
Notes
Note 1. Due to multicollinearity between JENSENt-3 and JENSENt-12 (twelve months' Jensen's alpha estimate), we exclude the latter from the regression