18
The Influence of Firm Specific Determinants on Financial Performance in the Power Industry
Mafumbate J2, Ndlovu N1*, Mafuka A2, Gavhure, P2 1Lupane State University (LSU), Bulawayo, Zimbabwe
2Midlands State University (MSU), Gweru, Zimbabwe *[email protected]
Abstract: This study concentrates on the impact of firm specific determinants on financial performance in the power industry. The firm specific determinants used in this study as independent variables were capital structure, firm size and liquidity whilst ROA, ROI and profitability were used as proxies of financial performance. Modigliani and Miller (1958) argue that capital structure has no impact on financial performance whilst the Trade-off theory suggests that the ideal capital structure that helps firm remain financially healthy is the trade-off between cost of leverage and the advantages of debt. Beyond that trade-off point, a firm will start making losses. The target population included 60 employees from all the 5 subsidiaries of the Holding company and researchers used 40 respondents as sample size to enhance reliability. A relationship was established between firm specific determinants and financial performance as measured by ROA, ROI and profitability. The results showed a negative but significant relationship between capital structure and financial performance and they support the pecking order theory which suggests that capital structure is a significant determinant of financial performance. Firm size and financial performance were also negatively related. However, a significant positive relationship was established between liquidity and financial performance. From the findings the researchers concluded that firm specific factors have a significant impact on financial performance. Researchers therefore recommend that ZESA holdings should use its internal funds such as retained earnings and more equity than debt when financing its activities so as to reduce leverage costs which lead to poor performance.
Keywords: Capital Structure, Firm Size, Return on Assets, Return on Investment, Financial Performance
1. Introduction
Given the dynamism that characterise today’s business environment, the corporate financial performance of any business, not only plays the role of increasing its market value, but also leads towards the growth and prosperity of the economy as a whole (Mehari and Aemiro, 2013). Financial performance is a key concept in today’s economic environment shaped by fast changes, stiff rivalry and globalization. The financial performance of a firm is represented by a firm’s profitability, return on assets, and return on investment, sales turnover, earnings per share and dividend growth amongst others. The prominence of financial performance has of late gained momentum and has enticed the attention, interests and comments from researchers, the public, management of corporate entities and financial gurus. Nonetheless, it has received little attention especially in developing economies as indicated by a plethora and unprecedented challenges that has seen many Zimbabwean companies going under judiciary management because of poor financial performance (Hawawini, Subramanian and Verdin, 2003).
19
endeavours to improve the struggling economy. In its financial statements for the year to December 2013 debt for the power generation and supply group amounted to US$774.7 million. What makes it more stressing is that the group had defaulted on principal and interest reimbursements on all foreign loans amounting to US$750.2 million. The financial statements indicated that some of the organizations’ debts have gone for almost two decades without being repaid and are long overdue (Financial Gazette, June 2014).
The utility and its subsidiaries has been incurring negative working capital for a long time, and this implies that the company does not have the ability to meet its current liabilities and long term liabilities as they fall due. The enormous ZESA obligation has resulted in a feeble statement of financial position, presenting a major challenge to the group which is unable to leverage on its balance sheet to raise funding to effectively maintain and restore its infrastructure. There is now a growing concern that the debt obligation could affect the utility’s financial soundness. The situation also presents a major challenge in attracting funding, for planned capital projects. This would be difficult as it portrays a low credit rating for the utility. A stronger ZESA would help anchor confidence in Zimbabwe’s power industry. The situation, however, has been exacerbated by government, the utility’s sole shareholder, whose coffers are almost empty. Government has not been able to bailout ZESA to facilitate the utility’s recovery. ZESA a strategic parastatal which government should ensure is operationally and financially sustainable has failed to end a run of operating losses and now needs more fiscal support than previously thought. However, there is a need to determine the causes for its underperformance and recommend solutions to improve its state. In literature there are however diverging views on the factors that determine financial performance. The study therefore seeks to establish the determinants of financial performance in the holding company.
Statement of the Problem: Previous literature has not yet come to a sound conclusion as to what factors determine financial performance. Hawawini, Subramanian and Verdin (2003) argue that external factors are major determinants of firm’s financial performance. However, Opler and Titman (1994) are of the view that firm specific internal factors are the major determinants of financial performance. The relationship between micro environmental factors and firm financial performance in the power industry still remains unclear. It is still not certain whether micro environmental factors such as capital structure, liquidity and firm size are indeed the determinants of financial performance of the power utility, otherwise financial performance is a function of other external variables. Neither theoretical nor empirical studies to date have clearly revealed the actual relationship.
Research Objectives:
To establish the relationship between capital structure and ROI.
To determine the impact of size of the firm on ROA.
To find out if liquidity affects profitability. Research Questions:
What is the impact of capital structure on ROI?
Does firm size affect ROA?
Is there a relationship between liquidity and profitability? Statements of Hypothesis:
H0: There is a negative relationship between capital structure and financial performance.
H1: There is a positive relationship between capital structure and financial performance.
H0: There is no positive relationship between size of the firm and financial performance.
H1: There is a positive relationship between size of the firm and financial performance.
H0: Liquidity has a negative relationship with financial performance.
H1: Liquidity has a positive relationship with financial performance.
2. Literature Review
20
shareholders, the perception of financial performance is solidly founded on the ability to distribute dividends for re-investments. Credit organizations and commercial partners are concerned with the solvency and the stability of the firm, its ability to repay advances when they fall due. Authors further argue that employees value job security. To them, financial performance is the firm’s ability to award them satisfactory wages. Finally the government considers that a firm which is able to meet its tax obligations is that which is financially performing well.
Firm Specific Determinants of Financial Performance: Hawawini, Subramanian and Verdin (2003) opine that financial performance is a function of multi variable determinants ranging from macro to micro environmental factors and this study centres on the firm specific determinants of financial performance. Internal factors that determine financial performance include among others, growth opportunities, capital structure, business risk, tangibility, firm size, corporate social responsibility and corporate governance (Muneer et al., 2017). To attain the objective of the study, researchers used capital structure, liquidity and firm size as determinants of financial performance.
Effects Capital Structure on financial performance: Capital structure is defined as how the business is financed, primarily the proportions of debt (leverage/gearing) and equity that a business uses to finance its assets, day to day actives and future growth (Jensen and Meckling, 1979; Iqbal et al., 2012). Nirajini and Priya (2013) define capital structure as how a firm is funded, thus it is a combination of both long term capital and short term liabilities. Nirajini and Priya (2013) did a research attempting to analyse the relationship between capital structure and financial performance during 2006 to 2010 financial years of listed trading companies in Sri Lanka. They extracted data from the annual reports of sample companies and used correlation and multiple regression analysis. The results revealed that there was a positive relationship between capital structure and financial performance. Maina and Kodongo, (2013) undertook a research to examine the relationship between capital structure and financial performance of firms listed at the Nairobi securities exchange. They used debt to equity ratio as one of the capital structure proxies used to measure leverage. The results showed that there was a negative but noteworthy relationship between debt to equity ratio and financial performance of firms listed at the Nairobi securities exchange. The results harmonize with the discoveries of Mwangi et al. (2014) who also attempted to find out the relationship between capital structure and financial performance. Authors found out that, there was a negative but significant relationship between debt to equity ratio and financial performance as measured by return on assets (ROA) and return on equity (ROE).
Effects of Firm Size on financial performance: The size of a firm is the volume and the diversity of production capacity and skill a firm holds or the amount and range of facilities a firm can offer concurrently to its consumers (Papadogonas, 2007). The size of a firm is a crucial aspect in defining the profitability of a firm in line with the concept of economies of scale found in the neo classical view of the firm. It suggests that items can be produced on much lower costs by bigger firms than with smaller firms. Amato and Burson (2007) argue that a positive relationship is expected between the size of the firm and financial performance. Papadognas (2007) conducted investigation on a sample of 3035 Greek manufacturing firms for the period 1995-1999 wanting to find out if there was a relationship between firm size and firm’s profitability. He used regression analysis which showed that for all size classes, firms’ profitability is positively influenced by firm size. Using a sample of 1020 Indian firms, Lee (2009) studied the relationship that firm size has with firms’ profitability in US publicly held firms. An analysis on a sample of more than 7000 firms was performed. The results indicated that firm size is vital in explaining profitability. However, this relationship was nonlinear meaning that gains in profitability were lower for larger firms. Amato and Burson (2007) tested size-profit relationship for firms operating in the financial services sector. The authors examined both linear and cubic form of the relationship. With the linear specification in firm size, the results revealed negative influence of firm size on its profitability. However, this influence wasn’t statistically significant.
21
Drake (2007) argue that a firm with high liquidity is considered to be financially strong nevertheless. The level of liquidity should be based on the ideal levels of liquidity of each and every company. This issue has been a subject of many theoretical and empirical studies. It should therefore be noted that although many scholars have researched on this issue diverging views have emerged. Liquidity however is important and necessary for company’s existence and Teruel and Solano (2007) support this idea using the results they obtained from the Spanish small to medium enterprises. They studied effects on working capital management on Spanish small to medium enterprises’ profitability and concluded that additional value can be created by reducing inventories and the number of day’s accounts outstanding. Shortening the cash conversion cycle can also be a means to improve firm’s profitability.
Working Capital Management: Block, Hirt and Short (2000) define working capital management as the administration of current assets and current liabilities of a firm. Working capital is also referred to as fluctuating capital of an organization because they change daily due to decisions by management. Working capital is made up of various components such as cash, inventories, receivables and payables. The success of a business is guaranteed by balancing the components of working capital (Gitman, 2009; Muneer et al., 2016). Filbeck and Krueger (2005) support this view when they argue that the success of a business depends on the ability of management to manage inventory, receivables and payables effectively. Horne and Wachowicz (2000) argue that keeping too much current assets can affect the profitability of the firm and keeping too little current assets may lead to failure in meeting the day to day needs of an organization.
Theoretical Literature: This segment discusses the various theories introduced by different scholars in trying to appreciate the determinants of financial performance. It also presents empirical findings from various scholars who carried out studies trying to validate the proposed theories.
Capital Structure Theories: Capital structure decision is one of the most important finance decisions a company has to undertake if a firm is to perform well in the industry. The relationship between capital structure and firms financial performance has been a confusing issue in the accounting and corporate finance literature since the invention of the Modigliani and Miller theorem in (1958).They are of the view that since under the perfect capital market there are no capital market frictions, taxes are neutral and if there is no bankrupt cost, then the value of the firm is independent of capital structure. From then a number of theories have been developed to give enlightenment on the relationship between capital structure of a firm and its financial performance. The theories developed are the Pecking order theory, Static Trade-off theory, signalling theory and agency cost theory among others. The decision made by a firm about its capital mix has major effects on its competitiveness in the industry it operates (Myers, 2001). Therefore, to maximize profits managers need to make right leverage decisions and companies should use an appropriate capital mix.
Modigliani-Miller Theorem: The capital structure theory was founded from the publications of Modigliani and miller in 1958 when they tried to explain the relationship between capital structure and financial performance. The theorem is an irrelevance proposition and argues that the value of the firm is not affected by how it is financed that is debt or equity. It offers circumstances in which financial performance is not affected by capital structure. Their study suggests that if firms are operating in a perfectly competitive market, firm’s financial performance will not be related to capital structure. Thus they were suggesting that there is no significant relationship between a firm’s capital structure and financial performance.
Trade-off Theory: The debate over the Modigliani - Miller theorem led to the invention of the trade-off theory model. The addition of tax to the first irrelevance proposition led to the observation of the benefits of debt as it saves earnings from taxes. The off theory suggests that the ideal capital structure is the trade-off between the costs of leverage (that is financial distress and agency costs) and the advantage of debt thus, the interest tax shields (Brigham and Houston, 2004).
22
Agency Cost Theory: The agency cost theory was initially developed by Berle & Means (1932) and they argued that the gap between ownership and control was increasing due to the decrease in equity ownership. This leads to managerspursuing their own interests instead of maximizing shareholders wealth.It is the duty of top managers to run the company in a way that shareholders wealth is maximized by increasing cash flows and profits (Chang-AikLeng, 2004; Muneer et al., 2013). However managers always act the exact opposite of what they are expected of, thus they do not always maximize returns to shareholders (Jensen & Meckling, 1976).
The Signalling Theory: Spence (1973) developed the signalling equilibrium theory and suggests that healthy firms can be distinguished from underperforming firms by the signals they send to capital markets. The pecking order theory suggests that firms that are healthy and profitable prefer using internal funds to finance its capital structure. However it does not explain the importance of sending quality signals to the capital market. This theory therefore explains the performance of a firm using the signals it sends to the market (Ross, 1977; Muneer et al., 2013). This is only effective if the bad firm cannot copy the good firm by sending the same signal again. Ross (1977) suggests that debt can be used as a costly signal to separate good firms from underperforming firms, and health firms use more debt that unhealthy firms. As suggested by Poitevin (1989) to single out potential rivalry of new firms entering the industry debt can likewise be utilized. Harris and Raviv (1985) contend that calling firm’s convertibles can be a kind of signal and Bhattacharya & Dittmar (1991) show that stocks repurchase is another sort of signal to represent firm value.
3. Methodology
Descriptive research design was employed as it allows the application of both the quantitative and qualitative data. The descriptive research design becomes more appropriate for this research because the study is quantitative in nature.Italso aids in finding solutions to the real causes of financial performance in ZESA holdings. The database was obtained from management, bulletins, audit reports on financial performance, annual reports and published financial statements of ZESA holdings from 2010 to 2014. The holding company constitutes of 5 subsidiaries. The questionnaires were completed by ZESA holding officials who occupied middle and top managerial positions. The researchers chose these respondents because they had information necessary for the study. Subsequently, they are believed to be financially literate and hence they are in a better position to understand the causes of the Power utility’s financial performance. Ghauri & Gronhaung (2005) suggest that one of the major advantages of questionnaires is that the respondents can complete the questionnaire at their free time when they are relaxed with no pressure hence it reduces the pressure given by interviews which most respondents do not want. However, a total of 40 closed ended questionnaires were retrieved for the final data analysis representing a response rate of 67 percent.
The study used both probability and non-probability sampling methods. Purposive sampling was used as a non-probability sampling method to choose the respondents because it enabled the researchers to focus on particular characteristics of a population that was of interest. Probability sampling was also used because it enabled the target population to be represented in the sample and it is more accurate than non-probability sampling techniques. Saunders et al (2009) suggests that if the study is using statistical analysis probability sampling is ideal in order to have generalizability for the results. The researchers used stratified random sampling. The population was divided into stratas (Finance managers, Commercial managers, Sales managers, and senior Accountants) and from the strata; individuals were randomly selected to be in the sample. Using stratified random sampling ensured that all groups concerned are fairly represented in the sample. It also increased the chances of getting more precise information about the variable under study. Hair et al. (2006) supports the use of stratified random sampling because it ensures that the population is truly represented unlike using simple random sampling.
23
of the holding company. Data was also analyzed using statistical tools such as Eviews 8 and Stata version 13. This ensured the accuracy of results got and hence the data was reliable
Model for Data Analysis: The data collected was analyzed using simple linear regression model because it is more accurate and produces more reliable results. A statistical analysis of data was done using the Microsoft excel and STATA version 13.The purpose of using STATA was to test if financial performance of the power utility measured by ROI and ROA relates to capital structure decisions, firm size and liquidity measured by questionnaires (Keller, 2005).
Model Specification: The study adopted a model by Ongori (2013) who sought to examine the determinants of financial performance of commercial banks in Kenya. The model was modified by dropping the unnecessary variables on this study.
The model took a linear regression form as follows:
Y =β0+β1x1t+β2x2t+β3x3t+μt
Z =β0+β1x1t+β2x2t+β3x3t+μt
W =β0+β1x1t+β2x2t+β3x3t+μt Where Y = financial performance measured by ROA
Z = financial performance measured by ROI W = financial performance measured by profitability
x1t= firm size
x2t= capital structure
x3t= liqudity β0= intercept
μt= error term
Dependent variables: The dependent variable in this study is financial performance. The study used Return on assets, Return on Investment and profitability as proxies for financial performance
Return on assets (ROA): ROA is a management ratio that measures profits against the assets used to generate revenue. It is considered a measure of efficiency as it measures revenue earned for every dollar invested in Assets. A firm with a good ROA means that it is translating its assets into profits effectively (Casteuble, 1997). It is calculated as follows
ROA = Net profit after tax /Total assets
Return on Investment (ROI): It is a performance measure used when evaluating the efficiency of an investment. It is a ratio that aids in decision making such as assert purchase decisions, approval and funding decisions for projects and programs of different types. The definition and formula of return on investment can be modified to suit the circumstances depending on what is included as returns and costs. For example to measure the profitability of a company the following formula can be used to calculate return on investment.
Return on Investment = Net profit after interest and tax Total Assets
Profitability: It is a measure of a firm’s ability to generate revenue as compared to the expenses it incurs. It is measured as below
Net profit margin = net income/net sales
Independent variables: Independent variables in this study are firm size, capital structure and liquidity and are explained below:
24
of sales (about 0.98), and therefore choosing any of them is a substitute to the other therefore for the purposes of this study total assets will be used as a measure of firm size
Liquidity: Liquidity is the ability of a firm to meet its short term obligations as and when they fall due (Horne and Wachowicz 2000).For a firm to run its day to day operations efficiently it should hold liquid assets. These include assets that can be easily converted into cash for example inventory and debtors. Cash is the most liquid assets of all. There are various ratios used to measure liquidity such as quick ratio and acid test ration but this research, uses the current ratio to measure liquidity. The ratio of current assets to current liabilities is the most suitable measure, as it truly reflects the firm's liquidity. It is a widely used ratio to reflect the firm's solvency. It is calculated as follows
Current ratio = current assets÷ current liabilities.
Capital Structure: It is defined as the financing mix of the business thus the proportions of debt to equity used to finance a firm’s operations (Fambozzi & Drake, 2007).it is calculated as follows
Capital structure = debt/ equity
4. Findings
Effect of liquidity on financial performance: The possible reasons why majority of the respondents agree that liquidity has an impact on financial performance is that there are many companies in Zimbabwe that went bankrupt and closed due to lack of liquidity, and for some it was failure in managing liquidity. A case can be got from TN holdings a Zimbabwean company that was promising to perform well but it grew too fast yet it had no funds to sustain its day to day operations. It later ended up in huge debt of which it failed to meet its debt obligations. Municipalities in Zimbabwe are failing to deliver proper service to communities due to lack of liquidity. This affirms the possible reason why the majority of the respondents said liquidity has an impact on the performance of the company. The results concur with the findings of Maina & Kondongo (2013) who studied the impact of liquidity on non-financial firms listed on Nairobi stock exchange. The findings from their results indicated that there was a significant positive relationship between liquidity and financial performance.
Effect of Firm Size on Financial Performance: However, 92% of respondents believe that firm size has an impact on profitability. They also argued that larger firms perform better than small companies due to advantages from economies of scale which lead to higher profits. Moreover, large companies have stronger negotiating power which enables them to get better financing options. Large firms usually diversify as a way of growth as in the case of ZESA holdings which diversified to telecommunication industry by opening a subsidiary company called Powertel.
Impact of Capital Structure on Financial Performance: The majority of the respondents showed that a firm’s financing option has no impact on financial performance. This concurred with the Modigliani-Miller irrelevance theorem of (1958) which states that a firm’s performance is not related to how it is financed. Subsequently 28 out of 36 respondents showed that capital structure has no impact on financial performance whilst 8 accepted that financial performance of ZESA holdings is affected by its capital structure. The possible reason why 78% of the respondents indicated that capital structure has no impact on financial performance is that what matters is not how the firm is financed but the strategies used by management to remain competitive in the market.
25
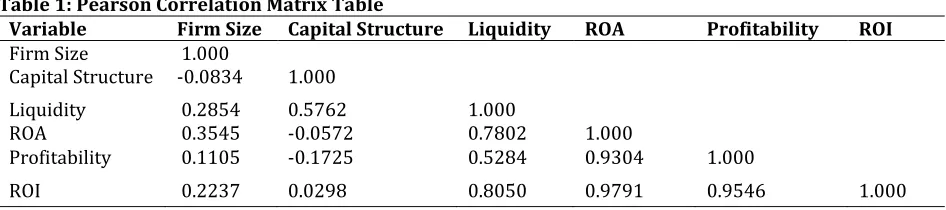
Table 1: Pearson Correlation Matrix TableVariable Firm Size Capital Structure Liquidity ROA Profitability ROI
Firm Size 1.000
Capital Structure -0.0834 1.000
Liquidity 0.2854 0.5762 1.000
ROA 0.3545 -0.0572 0.7802 1.000
Profitability 0.1105 -0.1725 0.5284 0.9304 1.000
ROI 0.2237 0.0298 0.8050 0.9791 0.9546 1.000 Source: Secondary Data Results
Indications from the table shows that liquidity positively correlate with ROA, profitability and ROI by 0.7802, 0.5284 and 0.8050 with the highest correlation being found between ROI and liquidity. Firm size positively correlate with ROA, profitability and ROI by 0.3546, 0.1105 and 0.2237 with the highest correlation being found between ROA and firm size. ROA and profitability are however negatively correlated with capital structure by -0.0572 and -0.1725 whilst capital structure positively correlates with ROI by 0.0298. The results show that an increase in capital structure leads to a decrease in financial performance because obligations to pay dividends and interests will rise also. An increase in liquidity and firm size increases the financial performance of the utility.
Regression Results: Regression Results as Measured by ROA; the equation shows 0.047 as the intercept or constant. It is the expected mean when all X variables are equal to zero. It further explains that a percentage increase in capital structure and firm size leads to a decrease in financial performance by 4.5% and 6.7% respectively. Whilst an increase in liquidity leads to an increase in financial performance by 2.5%.Regression Results as Measured by Profitability; the equation shows 0.266 as the intercept or constant. It is the expected mean when all X variables are equal to zero. It further explains that a percentage increase in capital structure and firm size leads to a decrease in financial performance by 5.9% and 35% respectively when measured by profitability. Whilst an increase in liquidity leads to an increase in financial performance by 2.8%. Regression Results as Measured by ROI; the equation indicated 1.3616 as the intercept or constant. It is the expected mean when all X variables are equal to zero. It further explains that a percentage increase in capital structure and firm size leads to a decrease in financial performance by 39% and 186% respectively when measured by ROI, whilst an increase in liquidity leads to an increase in financial performance by 23%.
Discussion of the Results-Capital Structure: The results show that capital structure has a negative and significant impact on the financial performance of ZESA holdings. The results are shown by negative regression coefficients of -0.0455496, -0.0597873, -0.3921915, t static of -84.12, -17.72, -22.16 and P values of 0.000 for ROA, Profitability and ROI. This means that an increase in capital structure leads to a decrease in financial performance. This study concurs with the trade-off theory which argues that as debt increases above the optimum level performance decreases because of distress costs which are paid out of profits. It also validates the null hypothesis which assumed a negative relationship between capital structure and financial performance. Theoretical literature has no conclusion on the relationship between capital structure and performance, the Trade-off theory suggests that profitable firms should borrow more so as to enjoy the benefits brought about by using debt. The pecking order theory argues that profitable firms do not need to borrow funds for financing but firstly use internal funds for financing thus it assumes firms prefer internal financing over external financing. The results from this study concurs with the views of Jensen (1976) who argues that higher levels of debt leave little or no funding for managers to use for investments which ultimately leads to poor performance.
26
This is consistent with the agency cost theory which states that if firms are highly leveraged lenders discourage investment in risky investments even if they are profitable because they want to make sure the firm does not default paying its debt obligation. This ultimately leads to highly leveraged firms underperforming.
Firm Size: The results from this study shows that firm size has a negative and significant relationship with performance of ZESA holdings with coefficients of -0.06731, -0.3584 and -1.866 measured by ROA, profitability and ROI respectively. The researchers therefore accept the null hypothesis which says there is a negative relationship between firm size and financial performance. This result concurs with what other theories of the firm suggest. They argue that large firms have a negative relationship with performance because they are controlled by managers who end up pursuing their own goals instead of maximizing profits. Therefore profit maximization might be replaced by their managerial utility maximization. ZESA is a large company and there exists separation of ownership from the shareholders as there are many managers running the utility and hence this might also be the reason why there is a negative relationship between the size of ZESA holdings and its performance. This is consistent with the studies of Gordard, Tavakoli & Wilson (2005) who studied the relationship between firm size and profitability in four European countries for the period of 1993-2001. Their results indicate that an increase in firm size leads to a decrease in profits.The results from the study contends the findings of Vijayakumar & Tamizhselvan (2010) that did a research in South India analyzing the impact of firm size on the profitability of manufacturing firms. The findings present a positive relationship between firm size and profitability.
Liquidity: The regression results show a significant positive relationship between the performance of ZESA holdings and liquidity with coefficients of 0.0251887, 0.0281544, 0.2399972 and t –statistic of 129.13, 23.17 and37.64 for ROA, profitability ROI respectively. The coefficients indicate that an increase in liquidity leads to an increase in financial performance. The possible reason for this positive relationship is that ZESA has been effectively managing its debtors. Failure to comply with their repayment conditions leads to disconnection of electricity and no funds would be tied up. It has also introduced a prepaid metering system in which one has to pay first before they are given electricity units; this has significantly improved the liquidity position of the firm. The results are consistent with the studies of Shama & Kumar (2011) who also found a positive relationship between liquidity and performance. This then means that if ZESA manages its liquidity well performance will increase. The researchers therefore accept the alternate hypothesis that there is a positive relationship between liquidity and financial performance.The results from this study on the impact of liquidity also oppose the findings of Mathuva (2009) who investigated the effect of working capital measured by cash conversion cycle on profitability. His findings show a significant negative relationship between cash conversion cycle and profitability.
5. Recommendations
From the discoveries and conclusion, the study suggests that there is requirement for ZESA holdings to expand their current assets in order to increase their liquidity as it was found that an expansion in current proportion unquestionably influence financial performance positively. The research further suggests that there is requirement for ZESA holdings to increase their operating cash flow, through lessening of their credit reimbursement period keeping in mind the end goal to decidedly impact their financial performance. The holding company should also reduce their debt to equity ratio as the results pointed out that an increase in capital structure negatively impact the financial performance of the utility. This should be done by financing its investments using retained earnings and equity so as to reduce the costs associated with debt. This will help improve the performance of the utility as no debt obligations will have to be paid yearly. With equity dividends may not be declared in times of low profits. This concurs with the pecking order theory which states that firms should use internal funds first as a way of financing so as to reduce costs associated with external financing. In concurrence, Brigham & Hoston (2004) on their empirical findings on the performance of Ethiopian companies, they found out that firms that used internal funds and equity were more profitable that those that used debt.
27
Therefore an increase in assets would be an expense as the assets will remain idle and will not be used to generate revenue. The firm is therefore advised to increase its capacity utilization so as to maximize revenue generated from already existing assets. If the assets are obsolete it is advised to dispose and buy new assets which are advanced and cost efficient. This will help increase generation of income in the firm. The firm should also retrench incompetent management and those pursuing personal interest it will ensure that revenue generated will be used for fulfilling the interests of the company only. The recommendation is consistent with what Goddard, Tavakoli & Wilson (2005) suggested when they investigated the impact of firm size on financial performance. They found out that as firms grow their performance declines. They therefore suggested that large firms should dispose assets that a lying idle so as to reduce costs associated with holding idle assets. They also suggested that firms should strive by all means to operate at full capacity thus improving profitability of the firm.
The study also found that as liquidity increased financial performance also increased. ZESA holdings should therefore engage in activities that increase liquidity in the firm such as reducing their cash conversion cycle; this will reduce the probability of the firm’s cash being tied up in inventory and debtors. They should put prepaid metering system to companies which are their maximum demand customers. These firms owe ZESA a lot of money and if they are put on prepaid metering they will have to purchase electricity first before consumption and hence liquidity will increase which will ultimately leads to higher levels of performance. These results concurs with the findings of Arnold (2008) who argues that firms that sell their good on cash basis perform better than those who offer credit as their money is always tied up in debtors.
Areas for further research: This study sought to establish the effects of micro environmental factors on the financial performance of ZESA holdings a monopoly in the electricity industry. The study recommends a further study on the effects of micro environmental factors of other companies in the power industry such as fuel companies and generator companies. Since there is no wide spread literature in Zimbabwe concerning firm specific determinants and financial performance in the power industry. Future studies can use other determinants for the same indicator and re assesse the relationships.
References
Amato, L. H. & Burson, T. E. (2007). The effects of firm size on profit rates in the financial services. Journal of Economics and Economic Education Research, 8(1), 67 – 81.
Arnold, G. (2008). Corporate Financial Management (4th Ed.). Essex: Prentice Hall.
Berle, A. A. & Means, G. C. (1932). The Modern Corporation and Private Property. New York: Macmillan. Bhattacharya, U. & Dittmar, A. (1991). Costless Versus Costly Signalling: Theory and Evidence from Share
Repurchases (Working Paper). Kelley School of Business: University of Indiana. Begg, F. & Rudiger, T. (2011). Monetary Economics. U.S.A: Macmillan Publishers.
Block, S. B., Hirt, G. H. & Short, J. D. (2000). Fundamentals of financial Management. USA: Dow Jones and company incorporated Chicopee.
Brigham, E. F. & Hoston (2004). Financial Management: Theory and Practice, 11th Edition. South-western College Publishers: New York.
Casteuble, T. (1997). What today’s association executives earn. Association Management, 49(4), 53- 61. Chang AikLeng, A. (2004). The impact of corporate governance practices on firms’ financial performance.
ASEAN Economic Bulletin, 21(3), 308-18.
Filbeck, G. & Krueger, T. M. (2005). An Analysis of Working Capital Management: Results Across industries. Mid-American Journal of Business, 20(2), 10-17.
Fambozzi, F. J. & Drake, P. P. (2007). Capital markets financial management and Investment Management, New York: John Wiley and sons.
Ghauri, P. & Gronhaug, K. (2005). Research Methods in Business Studies, 3rd ed.UK: Prentice Hall.
Goddard, J., Tavakoli, M. & Wilson, J. O. S. (2005). Determinants of profitability in European Manufacturing and services: evidence from a dynamic panel model. Applied Financial Economics, 15(18), 1269-1282. Gitman, L. A. (2009). Principles of Managerial Finance, 11thed. New York: Addison Wesley Inc.
Hair J., Black W., Babin B., Anderson, R. & Talham, R. (2006). Multivariate Data Analysis, 6th Ed. New Jersey: Pearson Prentice Hall.
28
Harris, M. & Raviv, A. (1991). The theory of capital structure. Journal of Finance, 46(1), 297-355.
Horne, J. & Wachowicz, J. (2000). Fundamentals of Financial Management, 11th ed. USA: Prentice Hall Int. Inc. Iqbal, S. M. J., Muneer, S., Jahanzeb, A. & Rehman, S. U. (2012). A Critical Review of Capital Structure Theories.
Information Management and Business Review, 4(11), 553-557
Jensen, M. & Meckling, W. (1976). Theory of the Firm: Managerial Behavior, Agency Costs and Ownership Structure. Journal of Financial Economics, 3, 305-60.
Keller, M. (2005). Analysing Discourse. An Approach from the Sociology of Knowledge, Forum Qualitative
Social Research, 6 (3). Available at:
http://www.qualitative-research.net/index.php/fqs/article/view/19/41.
Lee. J. (2009). Does Size Matter in Firm Performance? Evidence from US Public Firms, Int. J. of the Economics of Business, 16(2), 189–203.
Maina, L. & Kondongo, O. (2013). Capital Structure and Financial Performance in Kenya: Evidence from Firms Listed at the Nairobi Securities Exchange. Paper Presented at the Jomo Kenyatta University of Science and Technology Research Conference, Kenya.
Mathuva, D. M. (2009). The Influence of Working Capital Management Components on Corporate Profitability: A Survey on Kenyan Listed Firms. Research Journal of Business Management, 3, 1-11.
Mehari, D. & Aemiro, T. (2013). Firm specific factors that determine insurance companies’ performance in Ethiopia. European Scientific Journal, 9(10).
Modigliani, F. & Miller, M. H. (1958). The Cost of Capital, Corporate Finance and the Theory of Investment. American Economic Review, 48, 261-97.
Muneer, S., Bajuri, N. H. & Rehman, S. U. (2013). Moderating Effect of Agency Cost on the Relationship between Capital Structure, Dividend Policy and Organization Performance: A Brief Literature Review. Actual Problems of Economics, 11(149), 434-442
Muneer, S., Rehman, S. U. & Butt, B. Z. (2013). Dividend Signalling Power on Organizations' Future Earnings: A Brief Review of Dividend Theories. Actual Problems of Economics, 3(141), 380-387.
Muneer, S., Ahmad, R. A. & Ali, A. (2017). Impact of Financial Management Practices on SMEs Profitability with Moderating Role of Agency Cost. Information Management and Business Review, 9(1), 23-30
Muneer, S., Jahanzeb, A. & Suwandi (2016). Income diversification and performance: a comparison of commercial and Islamic banks of Pakistan. Abasyn Journal of Social Sciences, Special Issue, 471-485 Myers, S. C. (1984). The capital structure puzzle. The Journal of Finance, 39(3), 575-92.
Myers, S. C. (2001). Capital Structure. Journal of Economic Perspectives, 15(2), 81-102.
Mwangi. L. W., Makau, S. M. & Kosimbei, G. (2014). Relationship between capital structure and performance of non-financial companies listed in the Nairobi securities exchange, Kenya. Global Journal of Contemporary Research in Accounting, Auditing and Business Ethics, 1(2), 2311-3162.
Nirajini, A. & Priya, K. B. (2013). Impact of Capital Structure on Financial Performance of the Listed Trading Companies in Sri Lanka. International Journal of Scientific and Research Publications, 3(5), 1-9. Ongori, J. K., Iravo, M. & Munene, C. E. (2013). Factors Affecting Performance of Hotels and Restaurants in
Kenya: A Case of Kisii County. Interdisciplinary Journal of Contemporary Research in Business, 4(12), 897-928.
Opler & Titman. (1994). Financial Distress and Corporate Performance. The Journal of Finance, XLIX(3). Papadogonas, T. A. (2007). The financial performance of large and small firms: evidence from Greece. Int. J.
Financial Services Management, 2(½), 14–20.
Poitevin, M. (1989). Financial Signalling and the Deep-Pocket. The RAND Journal of Economics, 20(1), 26-40. Ross, S. A. (1977). The determination of financial structure: The Incentive-signalling approach bell. Journal of
Economics, 8, 2340.
Saunders, M., Lewis, P. & Thornhill, A. (2009). Research methods for business students, 5th ed. Harlow: Pearson Professional Ltd.
Sharma, A. K. & Kumar, S. (2011). Effect of Working Capital Management on Firm Profitability: Empirical Evidence from India. Global Business Review, 12(1), 159–173.
Spence, M. (1973). Job Market Signalling. The Quarterly Journal of Economics, 87(3), 35-374.
Teruel, P. & Solano, P. M. (2007). Effects of Working Capital Management on SME Profitability. International Journal of Managerial Finance, 3(2), 164-177.
Titman, S. & Wessels, R. (1988). The Determinants of Capital Structure Choice. Journal of Finance, 43(1), 1. Vijayakumar, A. & Tamizhselvan, P. (2010). Corporate Size and Profitability-An Empirical Analysis. Journal for