Amit Asati
Department of Chemistry, Sadhu Vaswani College Bairagarh, Bhopal, India Email: [email protected] Address for correspondence
Access this article online www.japer.in
Quantitative analysis method development and validation for
Irbesartan in bulk drug by Ultraviolet spectroscopy
INTRODUCTION
Irbesartan is in a group of drugs called angiotensin II
receptor antagonists. Irbesartan keeps blood vessels
from narrowing, which lowers blood pressure and
improves blood flow. Irbesartanis used to treat high
blood pressure (hypertension). Irbesartan is used for
the treatment of hypertension. It may be used alone or
in combination with other antihypertensive agents.
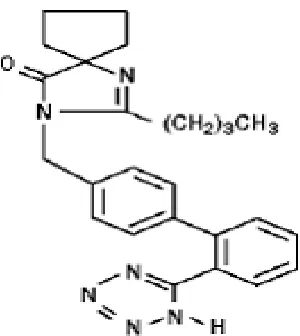
Irbesartan is a non-peptide compound, chemically
described as a
2-butyl-3-[p-(o-1H-tetrazol-5-ylphenyl)benzyl]-l ,3-diazaspiro[4.4]non-l -en-4-one.
Its empirical formula is C25H28N6O, and the structural formula is shown in Fig.1. Irbesartan is a white to
off-white crystalline powder with a molecular weight of
428.5. Irbesartan is slightly soluble in alcohol and
methylene chloride and practically insoluble in water
[1-4].
The objective is to develop ultraviolet spectroscopy
method and validate. Validation is the process of
generating experimental data that provides evidence
that the performance of an analytical method is
adequate for reliably assessing product quality [5-8].
The validation procedure has been performed by UV
spectroscopy. The method has been validated for
linearity, precision (system repeatability, method
repeatability, and method reproducibility), accuracy,
range [9-14]. Ultraviolet spectroscopy refers
to absorption spectroscopy in the ultraviolet spectral
region which ranges 200nm to 400nm. Compounds
which are colourless absorb radiation in this region. In
uv spectroscopy, only valance electrons absorb
energy, thereby the molecule undergoes transition
from ground state to exited state. This absorption is
characteristic and depends on the nature of electrons
present. Molecules containing π-electrons or
non-bonding electrons (n-electrons) can absorb the energy
in the form of ultraviolet to excite these electrons to
higher anti-bonding molecular orbital.
Medical options, several classes of drugs are used for
treatment of Hypertension. Actually now days cost of
medicines are too much high. There are two major
ways to reduce the cost of medicine.
1) By route of synthesis
2) By analysis cost
Here an attempt has been made to reduce the cost of
medicine by reducing the analysis cost and develop A simple, rapid and precise ultraviolet spectroscopy method was developed and validated for quantitative analysis of irbesartan in bulk drug. It is an angiotensin II receptor (AT1 subtype) antagonist. It is used for the treatment of hypertension. It shows maximum absorbance at 246 nm. Beer Lambert’s was obeyed in the concentration range of in the range of 5-30 µg/ml. The method was successfully validated in accordance to USP pharmacopeia and ICH guideline for accuracy, precision, rang and linearity. The linear regression analysis data for calibration plots showed good linear relationship and obtain correlation factor is greater than 0.999 for irbesartan. The % Recovery/Accuracy was within the range between 98% and 102%. The percentage RSD for precision was found to be less than 2%. Thus method was successfully applied for routine analysis of irbesartan in bulk samples.
Keywords: Accuracy, ICH guideline, Irbesartan, Precision, Validation, ultraviolet spectroscopy USP pharmacopeia.
ABSTRACT ABSTRACT ABSTRACT ABSTRACT Amit Asati2*, Anita Shinde1,
Suman Malik2, K. C. Asati
1Department of Chemistry I. E. H. E, Bhopal, India 2Department of Chemistry, Sadhu Vaswani College Bairagarh, Bhopal, India
such type of analytical method in which, there is
Minimum solvent consumption, reduced analysis time,
chemicals and reagents which are used in the method
are cheap and easily available. So the purpose of my
research works to develop the analytical method for
anti-hypertensive pharmaceutical drugs by ultraviolet
spectroscopy and validate these methods with the
guidance of United state Pharmacopeia (USP) and
International Conference on Harmonization (ICH).
MATERIALS AND METHODS
Chemicals and Reagents and
instrumentation:-Pure samples of irbesartan were obtained as gift. LC
grade Methanol was purchased from Merck Company
Mumbai.The analysis of the drug was carried out on a
shimadzu uv-2450 uv-vis spectrophotometer with
single beam mono chromator. Irbesartan shows
maximum absorbance at 246 nm. Beer Lambert’s was
obeyed in the concentration range of in the range of
5-30 µg/ml.
Standard solution Preparation:-
Stock A:-Accurately weigh and transfer 25mg of irbesartan working standard into a 100mL volumetric
flask, add about 70mL of diluent and sonicate to
dissolve it completely and make volume up to the
mark with the same.
5ppm solution: Take 1mL of the above A solution into a 50mL volumetric flask and dilute up to the mark
with diluent.
10ppm solution: Take 2mL of the above A solution into a 50mL volumetric flask and dilute up to the mark
with diluent.
15ppm solution: Take 3mL of the above A solution into a 50mL volumetric flask and dilute up to the mark
with diluent.
20ppm solution: Take 4mL of the above A solution into a 50mL volumetric flask and dilute up to the mark
with diluent.
25ppm solution: Take 5mL of the above A solution into a 50mL volumetric flask and dilute up to the mark
with diluent.
30ppm solution: Take 6mL of the above A solution into a 50mL volumetric flask and dilute up to the mark
with diluent.
Assay of irbesartan sample:- Accurately weigh and transfer equivalent to 25mg of irbesartan sample into
a 100mL volumetric flask, add about 70mL of diluent
and sonicate to dissolve it completely and make
volume up to the mark with the same. Further pipette
out 4mL of the above stock solution into a 50mL
volumetric flask and dilute up to the mark with
diluent. Obtain solution concentration was 20μg/ml.
absorbance of irbesartan was measured. Calculate %
Irbesartan by following formulae.
Calculation
(A-I)
Irbesartan (%) = --- X 1000 S X C
Where,
A = Absorbance of Irbesartan in sample
I = Intercept value obtained from linearity curve
S = Slop value obtained from linearity curve
C = Concentration of Irbesartan in sample (mg/ml)
Results and Discussion
Method validation: The objective of the method validation is to demonstrate that the method is
suitable for its intended purpose as it is stated in ICH
guidelines. The method was validated for linearity,
precision (repeatability and intermediate precision),
accuracy, specificity, stability and system suitability.
Linearity:- The linearity of an analytical procedure is its ability to elicit test results that are directly, or by a
well-defined mathematical transformation,
proportional to the concentration of analyte in sample
within a given range. It should be established initially
by visual examination of a plot of signals as a function
of analyte concentration of content. If there appears to
be a linear relationship, test results should be
established by appropriate statistical methods (e.g., by
calculation of a regression line by the method of least
squares). In some cases, to obtain linearity between
test data may have to be subjected to a mathematical
transformation. Data from the regression line itself
may be helpful for providing mathematical estimates
of the degree of linearity. The correlation coefficient,
y-intercept, slope of the regression line, and residual
sum of squares should be submitted.
Six standard solutions of Irbesartan were prepared
from three stocks in the range of 25% to 150 % of the
nominal concentration and taken absorbance once.
Linearity regression analysis demonstrated the
acceptability of the method for quantitative
determination of Irbesartan over the concentration
range of about 5ppm to 30ppm of the nominal
concentration. Linearity graph was shown in Fig.2 and
slope, intercept correlation factor and Regression
equation were shown in Table.1
Precision:-The precision of an analytical method is the degree of agreement among individual test results
when the method is applied repeatedly to multiple
samplings of a homogeneous sample. The precision of
an analytical method is usually expressed as the
standard deviation or relative standard deviation
(coefficient of variation) of a series of measurements.
Precision may be a measure of either the degree of
reproducibility or repeatability of the analytical
method under normal operating conditions. The ICH
documents recommend that repeatability should be
assessed using a minimum of nine determinations
covering the specified range for the procedure (i.e.,
three concentrations and three replicates of each
concentration, or a minimum of six determinations at
100% of the test concentration).
System Repeatability:- Standard solution is prepared at three difference concentration form different stock
solution 15ppm, 20ppm and 25ppm were analysed
and taken absorbance on triplicate and RSD of
absorbance at each level were calculated. The
percentage RSD of absorbance was less than 1.0%.
Result are presented in Table.2
Method repeatability:- Six preparation of Irbesartan sample was analyzed from sample preparation to final
results by the same analyst and the percentage RSD of
obtained results was less than 2% and obtained result
were within given range 100 ± 2. Result are presented
in Table.3
System Reproducibility:- Three Irbesartan sample are analysed by this method in duplicate preparation
and obtain result are in Table.4
Accuracy:- It is defined as the closeness of test results obtained by the method to the true value. It may often
be expressed as percent recovery by the assay of
known, added amounts of analyte. Accuracy is a
measure of the exactness of the analytical method. The
ICH documents recommend that accuracy be assessed
using a minimum of nine determinations over a
minimum of three concentration levels, covering the
specified range (i.e., three concentrations and three
replicates of each concentration). The three different
concentrations of Irbesartan standard solutions were
determined from three replicate analysis, using the
linear regression lines (linearity section). The
deviations of the obtained results (expressed as
percentage accuracy) were calculated from the true
values were presented in Table.5
The average deviations from true value are less than
2.0 %.
Range:- The range obtained from Linearity, Precision and Accuracy is summarized - ibesartan-5ppm to
30ppm (25% to 150% of nominal sample
concentration)
CONCLUSION
The method validation demonstrated that The Method
is selective, precise, linear, and accurate for over the
required concentration ranges of 5 to 30 ppm (25
to150 % of Irbesartan nominal sample concentration)
for quantitative analysis of irbesartan by UV
spectroscopy. So this method should be used in
routine for quantitative analysis of irbesartan.
ACKNOWLEDGEMENT
All authors are grateful for principal of sadhu vaswani
college, bairagarh Bhopal for providing research
to all faculty of this institute for giving all possible
facilitates encouragement. Finally thanks to our
family for giving moral support and confident.
Irbesartan Concentration(ppm) Irbesartan Area
5.04ppm 0.1699
10.01ppm 0.3315
15.04ppm 0.5014
20.17ppm 0.6655
25.02ppm 0.8387
30.08ppm 0.9966
Slope 33.1022
Intercept 0.0019
Correlation factor 0.9999
Table1: Linearity Data
System Repeatability
S No. Concentration(ppm) Absorbance
1
15.04
0.5032
2 0.5066
3 0.5029
RSD (%) 0.4
1
20.17
0.6737
2 0.6756
3 0.6737
RSD (%) 0.2
1
25.02
0.8387
2 0.8349
3 0.8276
RSD (%) 0.7
Table 2: System Repeatability data
Method Repeatability
Concentration (ppm) Absorbance % Irbesartan
20.18 0.6674 99.6
20.07 0.6632 99.6
20.21 0.6713 100.1
20.25 0.6728 100.1
20.04 0.6681 100.4
20.13 0.6682 100.0
Average 100.0
STDEV 0.318
%RSD 0.3
Table 3: Method Repeatability data
Method Reproducibility
S No. Concentration (ppm)
Absorb ance
% Irbesart
an
% Irbesartan Average
Sample-I
Pre-I 20.25 0.6711 100.0
99.8 Sample-I
Pre-II 20.31 0.6757 99.6 Sample-II
Pre-I 20.15 0.6694 100.2
100.0 Sample-II
Pre-II 20.34 0.6741 99.9 Sample-III
Pre-I 20.46 0.6788 100.0
99.9 Sample-III
Pre-II 20.25 0.6699 99.8
Table 4: Method Reproducibility data
Injection No Level
Concentration (ppm) Area
Calculated concentration
(ppm)
Accuracy (%)
1
75 % 15.04
0.5032 15.145 100.71
2 0.5066 15.248 101.39
3 0.5029 15.136 100.65
Average 0.5042 100.9
1 100
% 20.14
0.6737 20.296 100.61
2 0.6756 20.353 100.90
3 0.6737 20.296 100.61
Average 0.6743 100.7
1 125
% 25.02
0.8387 25.280 101.06
2 0.8349 25.166 100.60
3 0.8276 24.945 99.72
Average 0.8337 100.5
Table 5: Accuracy test data of Irbesartan
Fig 1: Irbesartan chemical Structure
Fig.3: Typical UV scan spectra of irbesartan 20ppm
REFERENCE
1. The Merck Index, An Encyclopedia of Chemicals,
Drugs and Biologicals, Thirteenth Edition, Merck &
Co. Inc., 2001, 13:3453.
2. P Palatini. The Journal of Clinical Hypertension.,
2005, 7, 96–101.
3. USP 32 <1225>: "Validation of Compendial
Methods".
4. Guidance for Industry – Analytical Procedures and
Method Validation (August-2000).
5. W.D. Snyder, L. Blumberg, in: P. Sandra, M.L. Lee
(Eds.), Proceedings of the 14th International
Symposium on Capillary Chromatography,
Baltimore, MD, May 1991, p. 28
6. WHO, Guidelines for Stability Testing of
Pharmaceutical Products Containing Well
Established Drug Substances in Conventional Dosage
Forms, in WHO Expert Committee
7. Willard Hobart. H., Merritt L.L., Dean John. A.,
Instrumental Methods of Analysis, 7th edition, CBS
Publishers, 580-610.
8. International Conference on Harmonization of
Technical Requirement for Registration of
Pharmaceuticals for Human use, ICH harmonized
tripartite Guideline, Validation of Analytical
procedures Text and methodology Q2 (R1), 2005.
9. R. Jenke, “Chromatographic Method Validation: A
review of Current Practices and Procedures. I.
General Concepts and Guidelines”, J. Liq. Chrom. and
Rel. Technol., vol. 19 (1996), pp. 719-736.
10. Albero, I., Rodenas, V., Garcia, S., and Sanchez,
Pedreno, C., “Determination of Irbesartan in the
presence of Hydrochlorothiazide by derivative
spectorphotometry”, J.Pharm.Biomed.Anal., 2004, 29
(1-2), pp. 229-305.
11. Vetuchi, C., Giannandrea, A. Carlucci, G., and Mazzeo,
P.”Determination of hydrochlorothiazide and
Irbesartan in Pharmaceuticals by fourth-order UV
derivative spectrophotometry,” Farmaco, 2005,
60(8), pp.665-670.
12. Gagigal E, Gonzalez L, Alonso RM, Jimenez RM.
Experimental design methodologies to optimise the
spectrofluorimetric determination of Losartan and
Valsartan in human urine. Talanta 2001;54:1121-33.
13. Wang L, Asgharnejad M. Second derivative UV
spectrometric determination of simvastatin in its
tablet dosage form. J Pharm Biomed Anal
2000;21:1243-1248.
14. Surekha A, Jain NK. Difference spectrophotometric
estimation of amlodipine besylate. Indian drugs
2000;37(7):351-353.
How to cite this article: Amit Asati2*, Anita Shinde1,
Suman Malik2, K. C. Asati; Quantitative analysis method development and validation for Irbesartan in bulk drug by Ultraviolet spectroscopy; J. Adv. Pharm. Edu. & Res. 2014: 4(1): 101-105.