A DATA MINING METHODOLOGY WITH PREPROCESSING STEPS
Vita Špe
č
kauskien
ė
, Ar
ū
nas Lukoševi
č
ius
Kaunas University of Technology, Biomedical Engineering Institute Studentų Str. 65, LT−51359 Kaunas, Lithuania
email: [email protected]
Abstract. This paper analyzes various problems that appear while performing data mining. The issues of data quality are discussed. The main focus is set on feature selection and its influence on classification results. Feature selection, or discovery of an optimal data set is a process of removing features from the data set that are not useful in decision making, and leaving the most useful ones. The influence of feature selection is analyzed for different classifi-cation algorithms. They are applied on two different (in constitution) data sets to solve three problems of medical do-main. Presented results show that there is no universal algorithm, whitch could help solving any problem, as well as each data set has its own optimal (sub)set suitable for the classification algorithm. Methodological recommendations to reach possibly optimal solution are given to perform clinical decision support.
Keywords: feature selection, optimal data set, data set quality, data mining, classification, clinical decision sup-port.
1. Introduction
The healthcare environment is unique for being rich in data quantity, but poor in getting the know-ledge out of them. However, there is a lack of applica-tions to make use of these data, although, there are a lot of data mining techniques and studies that show good results in knowledge discovery. Data mining itself is a process of discovering new, previously un-known knowledge from large data bases. Amongst all data mining techniques, classification is probably most widely used [13, 15]. However, there are a lot of factors that assure effective classification; most not-able of them is data quality. Data quality problems are incompleteness, redundancy, inconsistency, noise in data, etc [7, 9]. However, classification is performed on a certain data set, which has additional aspects of quality; they are feature selection [15], imbalanced data [6], data set size [4] etc.
These and other issues are very important if seeking for the highest algorithm performance. The operation when trying to arrange the data set before presenting it to a classification algorithm is called pre-processing. We made an analysis of articles and did a lot of experiments concerning data set quality and pre-processing. One of the most important quality factors is discovery of optimal data subset (ODS); thus, it is analyzed in this paper.
The aim of this paper is to evaluate the importance of data preprocessing and modify methodology
(pre-sented in [11]) with steps concerning feature selection, data set balance and analysis of missing values.
The rest of the paper is organized as follows: Sec-tion 2 provides a brief overview of feature selecSec-tion; Section 3 describes data sets and algorithms being used; Section 4 explains performed experiments and results; Section 5 presents a discussion and con-clusions.
2. Feature selection overview
RBFS method gives better performances than others. Analysis done in [5] compares expert judgment and Correlation-based Feature Selection (CFS) strategies. The CFS strategy outperformed expert judgment; however results of both approaches delivered more accurate predictions than that with full data set. Clas-sification of ophthalmological data [2] also showed that the decrease of classification parameters (from 14 to 3) noticeably increased accuracy (from 70% to 80%). However, contrary results are presented in [14], where neural network with one hidden layer was used to perform classification. The case of the influence of derivative parameters with preprocessed data attained greater error rate, but as stated by the authors the net-work should be evaluated on larger data sets.
These all studies in one or another way show that classification algorithms’ performance noticeably in-creases when using suitable data set. It is usually re-ferred to as optimal data (sub)set. However, none of the investigated studies emphasize on a particular question of how different algorithms react on different features forming the optimal data set. This is an interesting case to investigate, because different data sets might give different results. Feature selection not only gives higher results while performing classifi-cation, but also is useful in defining most important features. This outcome can reduce effort and increase classification speed. Most useful features help reduce costly examinations [3].
For feature selection in our experiments we consi-dered recommendations given in [15]. However, ex-pert judgment was not considered.
3. A description of data sets and classification algorithms
One data set used for experiments was collected during eye health screening examinations in Eye Clinic of Kaunas University of Medicine. The data set contains 1222 instances of 32 category attributes (1222×32 matrix). It contained missing values, but in these experiments we didn’t mind them. Attribute values in the data set were numerical (21) and nominal (11). Out of this data set we chose two (nominal) class attributes as investigative problems. The first problem contains categories with 348 instances of one factor, and 870 instances of another factor. Onward it is called problem A. The second problem contains cate-gories with 86 instances of one factor, and 1081 ins-tances of another factor. Onward it is called problem B.
Another data set used for experiments came from the Machine Learning Database Repository at the Uni-versity of California, Irvine [1]. We chose the dataset “Breast” that contains 569 instances of 31 category at-tributes (569x31 matrix). It contained missing values, but we didn’t mind them as well. All attribute values were numerical (30), except for the class attribute, which was nominal, containing categories with 212
instances of one factor and 357 with another factor. Onward it is called problem C.
In short, here we investigate two data sets: first data set with problems A and B and second data set with problem C. Total makes three real world medical problems with different data set characteristics de-scribed above. All the considered problems are two-dimensional. It is notable that of the problem B data set is highly imbalanced. Generally, the first data set is not reviewed carefully by the medical specialists, so we know that the data contain inaccuracies and other misprints that we didn’t consider in these experiments. Also, during the experiments, we didn’t consider the medical domain in both data sets.
In all experiments the data sets were used for trai-ning (66% of the data) and testing (34% of the data).
Classification was performed using Weka data mining environment [16]. For the evaluation of algo-rithms, the decisive parameters were sensitivity (%) and specificity (%). Those values came from the Clas-sifier output window provided in Weka. Best sensiti-vity (%) and specificity (%) results are such where both values are about the same (the gap between them is as small as possible).
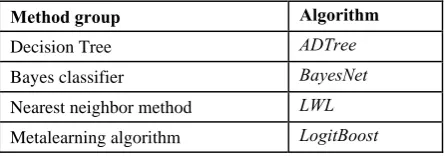
Classification algorithms were chosen out of the algorithms provided in data mining environment Weka. In Weka, all algorithms are divided into 6 me-thod groups according to their result representation. We separated 3 typical classification algorithms of each group, setting a total of 18 algorithms. We per-formed 11 methodological steps suggested in [11] to separate algorithms gaining highest classification re-sults (sensitivity and specificity values). According to these values we selected 4 algorithms that outperform other 12 algorithms. These 4 algorithms are listed in Table 1.
Table 1. Algorithms used for experiments
Method group Algorithm
Decision Tree ADTree
Bayes classifier BayesNet
Nearest neighbor method LWL Metalearning algorithm LogitBoost
Overall, feature selection is an iterative process. It is presented in Figure 1.
4. Experimental results
Figure 1. Schematic view of performed experiments
Table 2. Results produced with problem A. Here: ODS – optimal data set; FDS – full data set; Sens – sensitivity (%); Spec – specificity (%); Nr. of att. – the number of attributes
ODS FDS
Algorithm Sens Spec Nr. of att. Sens Spec Nr. of att.
ADTree 91 82 9 attributes 99 68
BayesNet 62 72 11 attributes 99 68
LWL 93 74 5 attributes 100 67
LogitBoost 89 83 6 attributes 85 83
31 attribute
For this problem the smallest difference between sensitivity and specificity, as well as highest result is achieved with algorithm LogitBoost. Comparing ODS and FDS, we can see that the differences between the results are quite significant and the importance of ODS is notable. Nonetheless, highest sensitivity and specificity is achieved with different ODS for all algo-rithms. Most of attributes are dissimilar in each ODS,
only 14 (out of 31) attributes are more or less impor-tant. We part those attributes into three groups: very important (if attribute appears in all algorithms), im-portant (if attribute appears in 2 or 3 algorithms) and sufficient (if attribute appears in only one algorithm). Attributes by importance are listed in Table 3.
Analogous to problems A results produced with problem B are presented in Table 4.
Table 3. Attribute importance in problems’ A data set. Here: numbers (e.g. 2, 3) refer to the attribute names in the data set; att. imp. – attribute importance: I – very important (4 attributes), II – important (4 attributes), III – sufficient (6 attributes), x – no attribute, other 17 attributes that apply in the full data set are insignificant
Att. imp. ADTree BayesNet LWL LogitBoost
I 2, 3, 5, 14 2, 3, 5, 14 2, 3, 5, 14 2, 3, 5, 14
II 4, 9, 10, 13 4, 10 9 9, 13
III 11 1, 6, 7, 8, 12 x x
14 att. 9 att. 11 att. 5 att. 6 att.
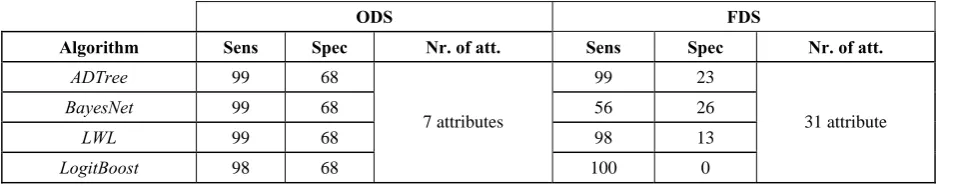
Table 4. Results produced with problem B (abbreviations are the same as in Table 2)
ODS FDS Algorithm Sens Spec Nr. of att. Sens Spec Nr. of att.
ADTree 99 68 99 23
BayesNet 99 68 56 26
LWL 99 68 98 13
LogitBoost 98 68
7 attributes
100 0
In the case of problem B, the algorithms give equal sensitivity and specificity. To reach highest perfor-mance (especially specificity), seven attributes were selected by the use of algorithms. It is worth pointing out, that all attributes used for solving problem A are different from those used for solving problem B. It means that for different problems a set of most suited attributes could be completely different (coming from completely different algorithms). Also, in problem B, the discovery of ODS is very important, as the results produced with the full data set are absolutely in-adequate.
In our previous research [12], we used the same attribute collection to analyze a problem analogous to problem B. For experiments (performed in [12]) the data set was well balanced and supervised (eliminating misprints and missing values in data). The decisive attributes coincide in both problems. The reached sen-sitivity and specificity was much higher in experi-ments presented in paper [12]. This also shows that data quality influences classification results, when using the same list of attributes.
Again, similar to problems’ A results produced with problem C are presented in Tables 5 and 6.
Table 5. Results produced with problem C (abbreviations are the same as in Table 2)
ODS FDS
Algorithm Sens Spec Nr. of att. Sens Spec Nr. of att.
ADTree 97 98 10 attributes 95 95
BayesNet 97 98 7 attributes 95 94
LWL 93 94 17 attributes 93 93
LogitBoost 96 98 7 attributes 96 97
30 attributes
Table 6. Attribute importance in problems’ C data set. Here: numbers (e.g. 2, 3) refer to the attribute names in the data set. Here att. imp. – attribute importance: I – very important (3 attributes), II – important (8 attributes), III – sufficient (9 attributes), x – no attribute, other 10 attributes that apply in full data set are insignificant
Att. imp. ADTree LWL Bayes. & Logit.
I 2, 14, 28 2, 14, 28 2, 14, 28
II 3, 11, 23, 25 3, 11, 16, 21, 22, 23, 24, 25 16, 21, 22, 24
III 4, 5, 6 9, 13, 17, 18, 19, 20 x
20 att. 10 att. 17 att. 7 att.
Sensitivity and specificity percentage of this prob-lem is much higher than in probprob-lems A and B. Here algorithms ADTree and BayesNet reached highest re-sults. Comparing ODS and FDS, we can see that the results of ODS are a little higher than those of FDS. Conversely, for problem C, the importance of ODS is not so notable. The highest sensitivity and specificity is achieved with different ODS for algorithms (it coin-cides only for algorithms LogitBoost and BayesNet). Most of attributes are different in each ODS, however, only 10 (out of 30) attributes are insignificant.
3. Discussion and conclusions
The overall sensitivity and specificity of problem C is higher and more reliable if training to perform clinical decision support. It is not surprising, because the data were gathered carefully with limited amount of missing values. The data set is well balanced and suited for solving a particular problem. Discovery of ODS is not so important in this problem. In contrary, the first data set is not specially prepared for classifi-cation, so we can see that it is essential to perform preprocessing and, as the first step, we recommend to perform feature selection followed by data set balance and analysis of missing values. Presented results lead
us to the conclusion that there is no universal data classification algorithm, whitch could help solving any problem, as well as each data set has its own op-timal (sub)set, which should be suited to the algorithm (if seeking for the maximum result). Each ODS has most and least important attributes. Without these attributes the results would significantly decline. However the discovery of ODS is more important if the primary results, achieved during the process of algorithms separation (methodological steps presented in [11]), are not sufficient (e. g. less than 50% in accu-racy, sensitivity or specificity). Also, feature selection could help discover other important problems, such as presence of missing values.
in the database and need to be enrolled in the classifi-cation process. If the supplement includes a few new examples, there is no need to perform stages one and two. However, if the supplement concerns major changes in the data set (e. g. changes data set balance), it is recommended to perform stages two and three.
New investigative problem requires performing all three stages. Most important is that all the stages can be programmed to perform automatically (there is no need to perform all stages with supervision of deve-loper).
Figure 2. Proposed methodology consisting of three stages
The proposed methodology allows flexibly and objectively to adapt data and algorithms and gain best solutions in clinical decision support.
Acknowledgment
The authors would like to acknowledge the support of the Lithuanian State Science and Studies Foundation for funding of the research project “Info Sveikata” (“Info Health”), reg. No. B-07019.
References
[1] A. Asuncion, D.J. Newman. UCI Machine Learning Repository. Irvine, CA: University of California, School of Information and Computer Science, 2007,
http://www.ics.uci.edu/~mlearn/MLRepository.html.
[2] J. Bernatavičienė, G. Dzemyda, O. Kurasova, V. Barzdžiukas, D. Buteikienė, A. Paunksnis. Rule In-duction For Ophthalmological Data Classification.
Proc. of 20thEURO Mini Conf. Continuous Optimiza-tion and Knowledge-Based Technologies EurOPT -2008, Neringa, Lithuania, May 20-23, 2008, 328-334. [3] C.V. Bratu, T. Muresan, R. Potolea. Improving
classification accuracy through feature selection. Proc.
of Int. Conf. on Intelligent Computer Communication
and Processing (ICCP), Cluj-Napoca, Romania Au-gust 28-30, 2008, 25-32.
[4] B. Brumen, M.B. Jurič, T. Welzer, I. Rozman, H. Jaakkola, A. Papadopoulos. Assessment of Classifi-cation Models with Small Amounts of Data. Informa-tica, 2007, Vol. 18 (3), 343-362.
[5] T.H. Cheng, C.P. Wei, V.S. Tseng. Feature Selection for Medical Data Mining: Comparisons of Expert Judgment and Automatic Approaches. Proc. of 19th
IEEE Int. Symposium on Computer-Based Medical SystemsCBMS 2006, Salt Lake City, Utah, USA, June 22-23, 2006, 165-170.
[6] Q. Gu, Z. Cai, L. Zhu, B. Huang. Data Mining on Imbalanced Data Sets. Int. Conf. on Advanced
Compu-ter Theory and Engineering ICACTE 2008, Phuket,
Thailand, Dec. 20-22, 2008, 1020-1024.
[7] L. Lei, N. Wu, P. Liu. Applying sensitivity analysis to missing data in classifiers. Proc. of Int. Conf. on
Services Systems and Services Management ICSSSM 2005, Chongqing, China, June 13-15, 2005, Vol.2, 1051-1056.
[8] S. Piramuthu. Evaluating feature selection methods for learning in data mining applications. European
Journal of Operational Research, 2004, Vol.156, Issue
2, 483-494.
[10] Z. Suraj, P. Delimata. Data Mining Exploration System for Feature Selection Tasks. Int. Conf. on
Hybrid Information Technolog ICHIT 2006, Jeju Is-land, Korea, November 9-11, 2006, 284-286.
[11] V. Špečkauskienė, A. Lukoševičius. Methodology of Adaptation of Data Mining Methods for Medical De-cision Support: Case Study. Electronics & Electrical
Engineering, 2009, No.2 (90), 28-33.
[12] V. Špečkauskienė, M. Špečkauskas, A.
Lukoševi-čius. Application of data mining techniques for diag-nosis of pseudoexfolistion syndrome. Int. Conf. on
Biomedical Engineering, Kaunas, Lithuania, 2008, 266-270.
[13] D. Taniar. Data Mining and Knowledge Discovery Technologies. Idea Group Publishing, 2007.
[14] P. Treigys, V. Šaltenis. Neural Network as an Oph-thalmologic Disease Classifier. Information Techno-logy and Control 2007, 36 (4), 365-371.
[15] J. Wang. Encyclopedia of Data Warehousing and Mining. Idea Group Inc (IGI), 2008, 878-882.
[16] I.H. Witten, E. Frank. Data Mining: Practical ma-chine learning tools and techniques, 2nd Edition.
Morgan Kaufmann, San Francisco, 2005.