R E S E A R C H
Open Access
Improving the calibration of phase
measuring deflectometry by a polynomial
representation of the display shape
Jonas Bartsch
1*, Michael Kalms
1and Ralf B. Bergmann
1,2Abstract
Background:Phase measuring deflectometry is a highly precise and full field metrology technique for specular surfaces based on the distortion of known reference patterns observed as a reflection at the surface under test. Typically, liquid crystal displays are employed to provide the required patterns. Due to a lack of research, these displays are used without sufficient calibration.
Methods:In this work, we present an enhanced calibration for phase measuring deflectometry, taking flatness deviations of the display surface into account. The display shape is modelled as a polynomial surface whose coefficients are determined by minimizing the retrace error in a global optimization procedure during calibration. This approach does not require any additional measurements or hardware. Improvements due to the enhanced calibration model are qualified experimentally using a flat and a spherical concave mirror.
Results and conclusion:The model-based parameterization of the display surface yields significant improvement on both samples. The peak to valley (PV) of measured deviations on the plane mirror are reduced by 67% to 0.55μm. Measuring the spherical sample without the display parameterization leads to a rather large shape
deviation of 33.40μm PV which is reduced by 94% to 1.98μm. The viability of our approach confirms the dominant role of flatness deviations of the display surface as an error source in absolute shape measurement using phase measuring deflectometry.
Keywords:Deflectometry, Absolute surface metrology, Displays
Introduction
The precise, contact-free and full-field measurement of reflecting surfaces still poses a challenge to modern metrology which is in most cases answered by employ-ing interferometric techniques. However, coherence-based techniques usually suffer from some fundamental difficulties, for example a high sensitivity to vibration, rendering their application within an industrial environ-ment a difficult task. Furthermore, the need for sophisti-cated components and specific optics leads to high costs. Deflectometry, in contrast, provides a robust and low-cost alternative. For a comparison of both techniques see e.g. [1–4]. Deflectometry measures the shape of specular sur-faces by tracing the reflection of a structured, incoherent
light source. It can be applied as a full-field measurement by using a camera as sensor, capturing reflected images from an extended, known reference pattern. Phase Meas-uring Deflectometry (PMD) employs multiple series of phase-shifted sinodial-patterns that provide a unique coding of the surface used to display them and allows to measure the geometry of the surface under test [5]. Typic-ally, commercially available liquid crystal displays (LCDs) with their high manufacturing quality [6], commonly employed as computer screens, are used as structured light source to provide the required patterns due to their ability to display user-defined patterns with good contrast at a sufficient frame rate. A detailed overview regarding the state of the art is given by Huang et al. [7].
In our preliminary investigations [8], we studied the errors introduced by non-ideal display properties asses-sing the shape of flat surfaces in a simulative approach. We modelled angle dependent emission characteristics,
© The Author(s). 2019Open AccessThis article is distributed under the terms of the Creative Commons Attribution 4.0 International License (http://creativecommons.org/licenses/by/4.0/), which permits unrestricted use, distribution, and reproduction in any medium, provided you give appropriate credit to the original author(s) and the source, provide a link to the Creative Commons license, and indicate if changes were made.
* Correspondence:[email protected]
1BIAS-Bremer Institut für angewandte Strahltechnik, Klagenfurter Str.5, 28359 Bremen, Germany
refraction at the cover glass, pixilation, limited color depth and shape deviations. We clearly identified flat-ness deviation of the display as the most significant error source in PMD that introduces low spatial frequency de-viations when assessing the global shape of the surface under test.
To account for this error source, we enhanced our calibration and evaluation procedures by introducing a polynomial model of the display shape. The correspond-ing coefficients are determined durcorrespond-ing the calibration procedure by minimizing the retrace error. Hence, this approach does not require any prior knowledge regard-ing the shape of the display surface. We present a quan-titative investigation of this approach using an optical flat and a spherical concave mirror as surfaces under test. For both samples, we achieve a decreased shape deviation with respect to its specifications.
Methods
Phase measuring Deflectometry (PMD)
Figure 1a shows the basic principle of deflectometry.
Patterns from a reference surface are observed by a cam-era as a reflection at the surface under test. Due to the shape of the specular surface, the recorded patterns are distorted, enabling assessment of shape information. Phase Measuring Deflectometry (PMD) employs series of phase-shifted sine-patterns, typically using a computer display as reference surface. This approach provides the observed position on the display for each individual camera pixel by applying the well-known phase shifting technique to the recorded images of fringe patterns seen as a reflection in the surface under test [9]. The process of capturing these fringe images and calculating the po-sitions on the display is therefore referred to as phase
measurement. System calibration provides the relative positions and orientations of the camera and display. Also, each camera pixel is assigned to a so-called vision ray, giving a geometric description of the inverse path of received light. This information is either given by a set of parameters describing all vision rays based on a photogrammetric approach or, as it is the case here, by a generic description providing independent vision ray information for each camera pixel [10].
The geometry of the surface under test is assessed by identifying surface positions and its local slopes leading to a valid path of light between each camera pixel, the corresponding position on the specular surface and the observed position on the display. However, there is an infinite amount of combinations of surface positions and its corresponding local slopes yielding such a valid path [11]. The process of identifying the correct combinations is referred to as regularization and requires additional information. There exists a variety of techniques for the assessment and utilization of such information to solve
this ambiguity [12, 13]. In this work, we approached
regularization by knowledge of a reference point on the surface, serving as a seed point for the reconstruction [14,15]. A distance sensor marks this reference point in space and the calibration procedure described below provides its absolute coordinates.
Figure 1b sketches the calibration procedure: A plane
calibration mirror replaces the surface under test. Phase measurements are performed for multiple tilted orienta-tions of the mirror, allowing to apply bundle adjustment to determine the relative positions and orientations of camera, display and all mirror poses used [16]. By additionally keeping the reading of the distance sensor constant while aligning the mirror, we assure each
Fig. 1a) Principle of Phase Measuring Deflectometry: A display shows a pattern which is observed by a camera as reflection at the surface under test, distorting the image. Displaying multiple phase-shifted sine pattern enables phase measurement to trace each camera ray to the display. b) Calibration procedure: A confocal white-light distance sensor marks a reference point in space which is on the surface of a plane calibration mirror. Phase measurements for multiple rotated orientations of the mirror around arbitrary axis through the reference point enable
mirror reorientation to be a rotation around an axis through a common point in space. Adding the know-ledge about the existence of this unknown common point as a constraint to the bundle adjustment allows to additionally determine the coordinates of this reference point during calibration. A calibration approach similar to ours, however, using a different approach for regularization is described in detail by Xiao et al. [17]. To measure an unknown sample with the calibrated system, the surface under test is placed considering the distance reading used during calibration, ensuring the systems reference point being an actual point on the surface. Initial values for surface locations are acquired by calculating the intersections of the vision rays from the camera with a plane through the reference point. Typically, one of the determined poses of the plane mirror used during calibration is utilized to provide this
reference plane. Additionally, phase measurement
provides knowledge about intersection points of camera vision rays with the display. This enables the calculation of gradients at each point of the currently assumed sur-face intersected by a vision ray. Unless assumed sursur-face points are actually true, the law of reflection, postulating equal angles of incidence and reflection, will not be sat-isfied. However, integration over the assessed gradients yields a more accurate surface description than the initial guess. This enables an iterative procedure of computing intersection points of vision rays with the currently assumed surface shape, calculating the corre-sponding gradients and integrating these to determine the true shape of the surface [18]. The reference point, known to be an actual point on the true surface and immediately providing valid gradient values, provides the starting point of each integration.
Distance measurements are performed using a con-focal white light sensor, enabling an accuracy of a few micrometers on specular surfaces tilted up to 5°. All other techniques known to the authors fail at this task since they either rely on normal incidence or diffuse scattering. Alternatively, since no absolute distance read-ings are required, a reference point can be marked in space by crossing two laser pointers [14]. This approach however cannot keep up with the accuracy of a confocal sensor and will introduce systematic, low spatial fre-quency shape deviations to the measurement.
The calibration procedure outlined above does not re-quire preliminary knowledge regarding the geometry of the setup beyond the mirror used for calibration being flat and all its poses sharing one common point in space. Relative positions and orientations of camera, display, reference point and mirror poses are determined solely based on recorded phase measurements. This allows to easily set up or adjust and calibrate a measurement system without the need for additional metrology
technique. The drawback of this approach is at the same time the reason for our investigations: The geometric calibration is already influenced by error sources affect-ing the deflectometric measurement and compensataffect-ing these errors by adequate models of the components of the setup is of particular importance. Alternatively, a deflectometry setup can be calibrated using external metrology systems like laser tracker and coordinate measurement machines as demonstrated by Huang et al. [19]. Such a calibration typically exhibits higher accuracy compared to our approach at the cost of highly in-creased effort and hardware requirements.
Display model
For a mathematical description of the display, we define a native coordinate system for its surface. Assuming a flat display and using its center as origin, it can be parameterized as
z xð ;yÞ ¼0 ∀ x ∈ −W
2 ;þ
W 2
;y ∈ −H
2;þ
H 2
ð1Þ
withWandHbeing the width and height of the display respectively. Coordinates in this native system are re-lated to those of equivalent native systems of camera and reference plane by homogeneous transformation matrices determined during calibration. Therefore, abso-lute coordinates of intersection points of vision rays with the display can be computed from measured and un-wrapped phase angles, providing (x,y)-coordinates in the display system due to their known relation to the employed wavelengths of the fringe patterns.
To leave the approximation of a flat display surface while assuming the shape to only vary slowly, Eq. (1) is modified by a bivariate polynomial, yielding
z xð;yÞ ¼XN
i>1
XN
j>1
cijxijj ∀ x∈ −W2;þW2
;y ∈ −H
2;þ
H
2
ð2Þ
Here, Nis the chosen maximum order of the
polyno-mial, cij are the coefficients. The later are initially un-known. Zeroth and first order terms of the polynomial are ignored on purpose since these represent offset and tilt of the display which is already assessed while deter-mining the homogeneous transformation matrix relating the display system to other system components. In our approach, the calibration is performed under the as-sumption of a flat display in the first step. Using these results as initial values we rerun the calculation using the display parameterization from Eq. (2) with the
coeffi-cients cij added as additional variables to the bundle
in the model. Despite these shortcomings and due to the dominant role of the shape deviation in comparison to other non-ideal display properties [8], our extended cali-bration model can still yield significant improvements regarding the accuracy of global shape measurement.
Results
The setup used in our investigations employs a camera
of type AVT Pike F210B with a resolution 1920 × 1080
pixels and an objective of type Kowa LM35SC with a
focal length of 35 mm. Our display, theNEC MD211G5,
is a grayscale-monitor designed for applications in medical diagnostics, providing better contrast and less angle-dependencies of emissions compared to common consumer displays. Distance measurements used to mark our reference point in space are performed using a
confocal white light sensor of type IFS2405–28 with
IFC2461controller, both manufactured bymicro-epsilon.
An optical flat with certified λ/20-flatness is used as
calibration mirror. Twenty-five phase measurements for varying mirror orientations are recorded to calibrate the system. The calibration is calculated using the flat display model given by Eq. (1) as well as with the poly-nomial model in Eq. (2) with a 7th order polypoly-nomial. Because display shape and location and orientation of the components of the setup are determined in a global optimization procedure, we yield overall different results for the setup geometry by calibrating with both model assumptions. For validation, both calibration results are applied to the phase measurement of one exemplary mirror orientation to compare yielded shape deviations
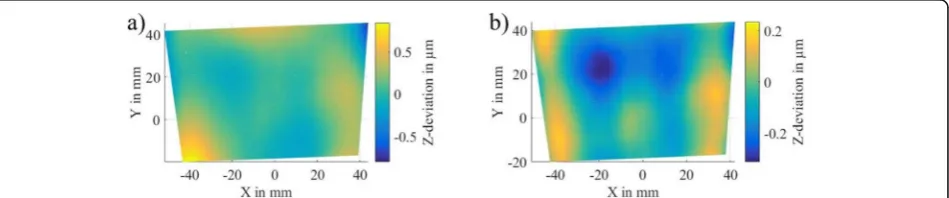
of the optical flat. Figure 2 shows the results. Assuming
an ideally flat display surface, see Fig.2a, leads to shape
deviations of 1.65μm peak to valley (PV) and 210 nm
root mean square (RMS). Application of the calibration result assuming a polynomial display surface reduced
the measured shape deviation to 0.55μm PV and 124
nm RMS as can be seen in Fig.2b.
The reduction of measured shape deviations on the flat mirror on its own is not sufficient for the validation
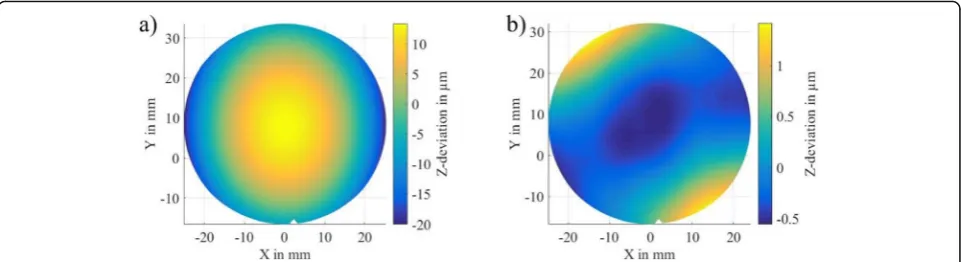
of improvements due to the polynomial display model because it is the working principle of the calibration to identify those system parameters which yield minimum retrace error under the assumption of a flat surface as specular object. Therefore, the resulting display shape is not necessarily related to the actual display but could instead just be caused by compensating the effects of various other error sources. To validate the improve-ment due to the polynomial display model, the experi-mental setup is additionally used for shape measurement of a spherical concave mirror with radius R = 203.2 mm while utilizing both calibration results for evaluation of measured phase data. The shape deviation of this sample is determined with respect to the specified surface shape.
The results are displayed in Fig. 3: Assuming a flat
dis-play surfaces yields the shape deviation shown in Fig.3a
with 33.40μm PV and 8.23μm RMS. Using the system
calibration taking display flatness deviations into
ac-count, shape deviation is reduced to 1.98μm PV and
0.46μm RMS. as shown in in Fig. 3b. The reduction of
measured shape deviation on this sample, which was not used for the determination of geometry parameters of the setup, states that the calibration using the polyno-mial display model in fact yields a more accurate result.
Further validation of our calibration approach is achieved by evaluation of the actual display shape determined in the calibration. This evaluation must be qualitatively in this work, because the surface shape of a display is influenced by temperature as well as gravity and physical stress. However, we have to assume con-stant display shape in calibration and all subsequent measurements and results can only be approximations.
Figure 4 shows the shape of the display surface
deter-mined by identifying the coefficients for the polynomial parameterization in Eq. (2) yielding minimum retrace
error. Each of the images of Fig. 4a to c represents the
full surface of the display which has a resolution of
2560 × 2048 pixel with pixelpitch 165μm. Black areas
correspond to display surface regions which were not ob-served during phase measurement. Color-coding marks
Fig. 2Measured shape deviations of the plane calibration mirror based ona) calibration assuming a plane display surface andb) using a polynomial display model of 7th order whose coefficients are determined during calibration. Both calibrations and shape evaluations were performed on the same phase measurement data. Measured shape deviation is reduced from a) PV = 1.65μm, RMS = 210 nm to b) PV = 0.55
the deviation in normal direction regarding an ideal plane.
Figure4a shows the entirety of the display shape
informa-tion yielded by the calibrainforma-tion. Phase values near the frame of the display are masked out in all measurements since these are prone to errors. This causes the display shape to be undetermined in these regions. Additionally, some areas near the corners were not observed by any of the 25 orientations of the plane calibration mirror used to determine the calibration. The calibrated display surface
exhibits a PV of 0.94 mm. Figure4b shows the observed
display surface area and corresponding shape information for the one exemplary orientation of the plane calibration
mirror used in Figure2. Display shape data is taken from
Fig. 4a, masked in accordance with the observed display
area and tilt- and offset-corrected by subtraction of the best-fit-plane. This yields a remaining shape deviation of PV = 0.32 mm. The white frame outlines the calibrated display surface area from all calibration measurements in Fig. 4a. Analogous to the representation in Fig. 4b, c shows the observed display surface area and shape for the
measurement of the spherical concave surface in Fig. 3.
The field of view of the camera is focused to a relatively small area on the display due to the reflection at the concave mirror. This display surface area exhibits a shape deviation of only 0.05 mm PV.
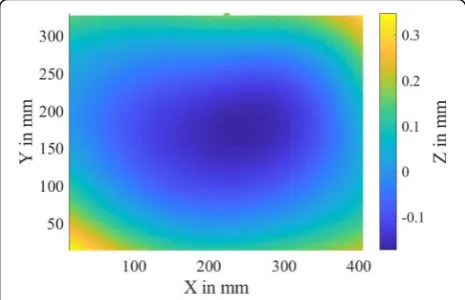
As a reference to the display shape determined by our calibration, we measured the shape of the display used in our experiments using a coordinate measurement Fig. 3Measured shape deviations of spherical concave mirror with radius R = 203.2 mm based ona) calibration assuming a plane display surface andb) using a polynomial display model of 7th order whose coefficients are determined during calibration. Both calibrations and shape evaluations were performed on the same phase measurement data. Measured shape deviation is reduced from PV = 33.40μm, RMS = 8.23μm in a) to PV = 1.98μm, RMS = 0.46μm inb) by application of the polynomial display model
machine of type Mitutoyo Crysta-Apex C. The results
are shown in Fig. 5. The PV of measured shape of 0.54
mm is smaller than the corresponding result from our
calibration in Fig. 4 but exhibits the same order of
magnitude. Distinct accordance of both results for the surface shape cannot be found. On one hand, we can assume this to be caused by in fact diverging surface shape of the display: During the tactile measurement, the display was turned off and lying on the table with its surface normal pointing upwards. In contrast, the display was in upright position during our experiments and also operating and thus generating heat. On the other hand, determination of the display shape during calibration is based on model assumptions that neglect further effects such as that of the cover glass or the area of confusion. Even though we must assume that the shape of the dis-play is not determined accurately during calibration, we find that we yield improved measurement accuracy by calibration using the polynomial display model, assum-edly caused by an overall improved calibration result.
Discussion
Flatness deviations found for our display by identifying model coefficients in a maximum likelihood approach
(see Fig. 4a) are not in strict accordance with those
de-termined using a coordinate measurement machine (see Fig.5) but are in the same order of magnitude. Since the shape of the display is in fact influenced by temperature and orientation, precise accordance cannot be expected.
Shape measurements using the enhanced system cali-bration yield significantly decreased deviations compared to those calculated based on the assumption of an ideally
flat display surface as can be seen in Figs.2 and 3. The
PV of measured shape deviation on the plane calibration
mirror is reduced by 67% to 0.55μm. While the
magni-tude of deviations is decreased, their general form re-mains mostly similar. In case of the spherical concave surface, the PV of measured deviations with respect to
the specified shape is reduced by 94% to 1.98μm. While
the form of the deviation resembles a paraboloid when being evaluated with the default calibration, application of the calibration containing the display parameterization yields deviation that can be described as freeform with some symmetries with respect to an axis through the center. Due to the concave shape of the object, the field of view of the camera is focused to a relatively small area on the display which only exhibits a flatness deviation of
about 50μm. However, we can assume the localization of
this surface area within the global coordinate system of the setup to be more accurate when a non-flat display is considered during calibration.
Comparing the best results of both surfaces under test,
shown in Figs. 2b and 3b, we find that the deviations
measured on the spherical surface are about 4 times higher than those measured on the plane calibration mirror. This seems plausible because curved surfaces are generally harder to measure using PMD since the circle of confusion of individual camera pixels on the display becomes distorted on reflection at the curved surface. On the other hand, we find the relative improvement of measured shape deviations due to the display calibration to be significantly larger for the spherical surface. Currently, we cannot explain this phenomenon and are planning to address this issue in future research.
The accuracy of the display shape calculated by minimizing the retrace error depends on quality and completeness of the models involved. E.g., we currently ignore the effects of refraction at the cover glass which also contributes to the retrace error affecting our cali-bration. The significant improvements due to the display calibration presented here confirm the dominant role of the display shape on systematic measurement errors in PMD found in our preliminary simulations [8].
Finally, assuming constant shape of the display surface over time implies another approximation because of thermally driven changes during operation. To limit this effect, all measurements presented here, including those used for the system calibration, were recorded within one session after a warmup-phase of about 2 h. We still expect a systematic error due to this effect which we cannot quantify yet. Compensating the effects of a non-constant display shape would require an alternative ap-proach were the display shape is perpetually monitored. This could be realized by introducing an additional photogrammetric measurement system directly observ-ing the display and independently recordobserv-ing the series of Fig. 5Shape of the display surface determined with a coordinate
fringe images, providing display shape data for every measurement of the PMD setup.
Conclusions
Assuming a plane display surface in PMD causes severe errors on absolute shape measurement. Introducing a simple polynomial model whose coefficients are deter-mined by minimizing the retrace error during calibration yields reasonable results for the display shape and significantly reduced systematic measurement errors. The viability of this approach confirms the finding of our preliminary simulations [8] which identified flatness deviations of the display as the major error source in PMD.
Acknowledgements
The authors would like to thank the German Research Foundation (DFG) for funding the project“Hochgenaue deflektometrische Formmessung unter Berücksichtigung der nicht-idealen Eigenschaften eines Displays als Referen-zebene”(MoniKal) under grant no. 298137953. We also thank Mr. Reiner Klat-tenhoff for the design and acquisition of the mechanics and mounts for our experimental setup.
Authors’contributions
JB: Conceived, designed and performed the experiments, analyzed the data and wrote the paper. MK: Accompanied the project professionally during the term and provided support in the analysis of the measurement results and assistance in creating the set-up for the experiments. RBB: Definition of re-search strategy, supervision of entire work, analysis of results, discussion and interpretation of results. All authors read and approved the final manuscript.
Funding
Declared at acknowledgements.
Availability of data and materials
The datasets generated during and/or analyzed during the current study are available from the corresponding author on reasonable request.
Competing interests
The authors declare that they have no competing interests.
Author details
1BIAS-Bremer Institut für angewandte Strahltechnik, Klagenfurter Str.5, 28359 Bremen, Germany.2University of Bremen, Faculty of Physics and Electrical Engineering, Otto-Hahn-Allee 1 and MAPEX Center for Materials and Processes, 28359 Bremen, Germany.
Received: 28 May 2019 Accepted: 15 August 2019
References
1. Faber, C., Olesch, E., Krobot, R., Häusler, G.: Deflectometry challenges
interferometry: the competition gets tougher! in: Proc. SPIE.8493, 84930R (2012) 2. Häusler, G., Faber, C., Olesch, E., Ettl, S.: Deflectometry vs. interferometry.
Proc. SPIE.8788, 87881C (2013)
3. von Kopylow, C., Bergmann, R.B.: In: Vollertsen, F. (ed.)“Optical Metrology”, in:“Micro Metal Forming”, pp. 392–404. Springer, Berlin (2013)
4. Bergmann, R.B., Burke, J., Falldorf, C.: Precision optical metrology without lasers. Proc. SPIE.9524, 952403-1-8, (2015)
5. Knauer, M.C., Kaminski, J., Häusler, G.: Phase measuring deflectometry: a new approach to measure specular free-form surfaces. in: Proc. SPIE.5457, 366– 377 (2004)
6. Fischer, M., Petz, M., Tutsch, R.: Evaluation of LCD monitors for deflectometric measurement systems. Proc. SPIE.7726, 77260V (2010) 7. Huang, L., Idir, M., Zuo, C., Asundi, A.: Review of phase measuring
deflectometry. Opt. Lasers Eng.107, 247–257 (2018)
8. Bartsch, J., Nüß, J.R., Prinzler, M.H.U., Kalms, M., Bergmann, R.B.: Effects of non-ideal display properties in phase measuring deflectometry: A model-based investigation. Proc. SPIE.10678, 106780Y (2018)
9. Werling, S., Mai, M., Heizmann, M., Beyerer, J.: Inspection of specular and partially specular surfaces. Metrol. and Meas. Sys.16(3), 415–431 (2009) 10. Bothe, T., Li, W., von Kopylow, C., Bergmann, R.B., Jüptner, W.P.: Vision ray
calibration for the quantitative geometric description of general imaging and projection optics in metrology. Applied Optics.49, 5851–5860 (2010) 11. Tutsch, R., Petz, M., Fischer, M.: Optical three-dimensional metrology with
structured illumination. Optical Engineering.50(10), 101507 (2011) 12. Balzer, J.: Regularisierung des Deflektometrieproblems–Grundlagen und
Anwendungen. Dissertation, Universität Karlsruhe (2008) 13. Werling, S.B.: Deflektometrie zur automatischen Sichtprüfung und
Rekonstruktion spiegelnder Oberflächen. Dissertation, KIT Scientific Publishing (2011)
14. Li, W., Sandner, M., Gesierich, A., Burke, J.: Absolute optical surface measurement with deflectometry. Proc. SPIE.8494, 84904G (2012) 15. Burke, J., Li, W., Heimsath, A., von Kopylow, C., Bergmann, R.B.: Qualifying
parabolic mirrors with deflectometry. J. Europ. Opt. Soc. Rap. Public.8, 13014 (2013)
16. Kumar, R.K., Ilie, A., Frahm, J., Pollefeys, M.: Simple calibration of non-overlapping cameras with a mirror. In: Proc. IEEE Conference on Computer Vision and Pattern Recognition, pp. 1–7 (2008)
17. Xiao, Y.-L., Li, S., Zhang, Q., Zhong, J., Su, X., You, Z.: Optical fringe-reflection deflectometry with bundle adjustment. Opt. Lasers Eng.105, 132–140 (2018) 18. Huang, L., Asundi, A.: Improvement of least-square integration method with
iterative compensations in fringe reflectometry. Appl. Opt.51, 7459–7456 (2012) 19. Huang, R., Su, P., Burge, J.H.: Deflectometry measurement of Daniel K.
Inouye Solar Telescope primary mirror. In: Proc. SPIE 9575, Optical Manufacturing and Testing XI, p. 957515 (2015)
Publisher’s Note