Information Technology and Control 2019/1/48
18
Clustering Over Multiple
Evolving Data Streams of the
Traffic Cyber-Physical Systems
ITC 1/48
Journal of Information Technology and Control
Vol. 48 / No. 1 / 2019 pp. 18-33
DOI 10.5755/j01.itc.48.1.18753
Clustering Over Multiple Evolving Data Streams of the Traffic Cyber-Physical Systems
Received 2017/08/03 Accepted after revision 2019/01/08
http://dx.doi.org/10.5755/j01.itc.48.1.18753
Corresponding author: [email protected]
Mingyue Cui, Hongzhao Liu, Wei Liu, Shuyi Li, Chongnian Qu
College of Mechanical and Electronical Engineering, Nanyang Normal University, Nanyang, Henan 473061, China; Oil Equipment Intelligent Control Engineering Laboratory of Henan Province, Nanyang, Henan 473061, China email: [email protected]
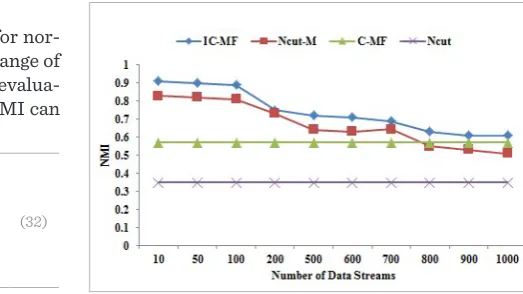
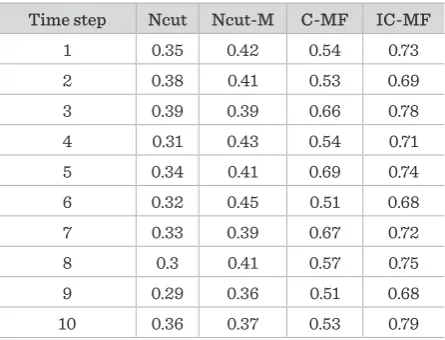
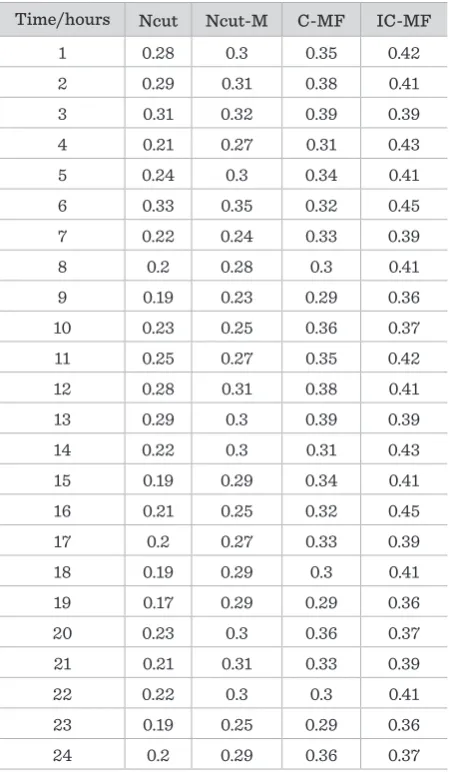
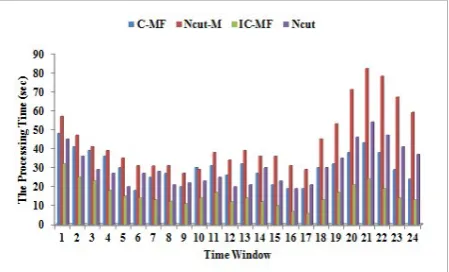
Extracting and retaining valuable information from multiple data streams of the traffic Cyber-Physical Systems (CPS) has been attracted an increasing amount of attentions by the related researchers. In this paper, the Incre-mental Clustering framework is proposed for multiple sensor data streams by low rank approximation Matrix Factorization (IC-MF), which can monitor the distribution of clusters over multiple sensor data streams based on their correlation. In the IC-MF, both the low-rank matrix approximation and matrix factorization-based clustering are applied, and IC-MF incorporates the historical results and the relationship between the nodes of the current step and previous step. To improve the accuracy of the increments, a low-rank approximation of the adjacency matrix is obtained at each time step, and makes IC-MF work directly in the low-rank subspace. The main idea of IC-MF is to make use of the similarity between two consecutive time steps to quickly update the approximating subspace. The performance and efficiency of the algorithm are demonstrated by traffic CPS ex-periments on the real and synthetic data sets. The experimental results show the effectiveness of the proposed algorithm for clustering multiple evolving data streams.
KEYWORDS: Cyber-Physical Systems (CPS), Sensor Data Streams, Incremental Clustering, Matrix Decom-position.
1. Introduction
The Cyber-Physical Systems (CPS) has been applied in a wide range of domains, such as traffic systems, energy and industrial automation, health and bio-medical agriculture, etc. So the CPS has become an active topic in data mining and machine
19
Information Technology and Control 2019/1/48
Traffic Cyber-Physical Systems are anticipated to achieve full coordination and optimization of traf-fic systems via the increased multiple sensor data streams between the transportation cyber systems and traffic physical systems [18]. In this paper, we will focuse on finding out interesting and useful knowl-edge by analyzing the correlation among multiple sensor data streams. In some cases, the correlation between sensor data streams reports unusual or ab-normal events; such a relationship change may imply fundamental changes of the monitored objects and possess high domain significance. Mining multiple sensor data streams is an area of research that at-tempts to extract useful information by analyzing the correlation among these multiple data streams [26]. The clustering is the most widely used to take data mining automatically. The similar data streams are put together into a group or the dissimilar ones are separated into different groups. By clustering mul-tiple sensor data streams dynamically, we observe the changes of cluster numbers and the members of each cluster, and then the useful information can be extracted to make decision or manage data in various applications. One of the challenges of sen-sor data streams is the dynamic nature. At different time-steps, the number of data streams (insertion and removal of sensor data streams) or the number of clusters structure (insertion and removal of clus-ters) might change. It is expected that the algorithm can discover the change over a series of time-steps to clustering multiple sensor data streams.
To discover the changes in the communities at each time-step, there exist some incremental and evolu-tionary clustering algorithms that are designed to handle dynamic data [3, 17, 24, 25]. However, sensor data streams require the incremental algorithms to handle not only reflecting the corresponding change among data streams. In the practical applications, the monitored processes generating time-stamped data may change drastically over time. This also requires the algorithm to be robust enough as a dramatical change happens from one time-step to the next. The clustering algorithm for multiple sensor data streams also can be used to identify data that deviate from his-torical patterns. Clustering at a particular time-step should be based on the associations between data streams at the time-step.
Graphs are used in a wide range of complex systems, such as traffic system, sensor network, social network, and so on, since they capture the general notion of an association between two entities [20, 23]. Matrix can be regarded as a common representation of a graph, such as a similarity matrix for a graph. The nodes of the graph are sensor data streams, and an edge is formed among each pair of nodes. The weight of each edge reflects the similarity at one time step between each pair of sensor data streams.
In this paper, the Incremental Clustering algorithm for multiple sensor data streams of traffic CPS is proposed based on low rank approximation Matrix Factorization (IC-MF), which can monitor the distri-bution of clusters over multiple sensor data streams based on their correlation. Comparing with cluster-ing directly the multiple data streams periodically, an efficient incremental clustering update is applied in this paper. This work is focusing more on multiple sensor data streams based on the correlation evolving over time. To improve the accuracy of the increments, a low-rank approximation of the adjacency matrix is used at each time-step. This algorithm acts directly on the low-rank subspace. The main idea of IC-MF is to apply the similarity between two consecutive time-steps to quickly update the approximating subspace. The rest of the paper is organized as follows. Related works are given in Section 2, which includes clus-tering data streams, matrix decom- position and its applications. Preliminaries and similarity in IC-MF are given in Section 3. The detailed procedures for mining multiple sensor data streams are presented in Section 4 and 5. Section 6 presents the experimental results and finally we conclude the paper with a sum-mary and discussion of the future work in Section 7.
2. Related Works
2.1. Clustering Data Streams
min-Information Technology and Control 2019/1/48
20
ing, such as clustering, classification, and so on. Clustering multiple data streams or grouping data streams is supposed to process at each time stamp. Various research works have been reported [2, 5, 6, 25]. Joint clustering framework of multiple networks includes an online component that periodically com-putes and stores detailed summary statistics and an off-line component which responds to a wide variety of inputs [5]. Beringer and Hullermeier discuss clus-tering over parallel data streams [2]. The Discrete Fourier transformation (DFT) is used to summarize the data streams, and an online version of the classi-cal K-means clustering algorithm is proposed. An in-cremental update mechanism was used to avoid the recalculation of DFT coefficients, and the data pro-cessing method that minimizes time was proposed in reference [18]. A COD (Clustering on Demand) framework was provided to dynamically clustering multiple data streams [9]. In [25], Yeh et al. proposed
the COMET-CORE framework for online clusters over
multiple evolving streams by correlations and events. DGClust (Distribute Grid Clusting) algorithm is applied in clustering distributed sensor data streams, which reduces both the dimensionality and the com-munication burdens [19]. The core of DGClust fo-cuses on online discretization of data, frequent state monitoring, and online partition clustering. For ex-ploring data correlation in sensor networks, α – local spatial clustering algorithm constructs a dominating set as the sensor network [16]. The data aggregation is based on the performance of the dominators in terms of their information description/ summarization. However, these methods are applied in clustering data streams over a period of time, and the correlation between data streams can change in that period. An incremental approach to clustering for data streams over time is a relatively new topic, such as incremen-tal spectral clustering, evolutionary clustering. Incre-mental algorithms on web data gain more and more attention [8] with the success of Google. Evolutionary clustering has been a relatively new topic and was first formulated by Chakrabarti et al. [3]. Evolutionary clustering simultaneously optimizes two potentially conflicting criteria, i.e., the clustering should fit the current data as much as possible, meanwhile it can not deviate dramatically from the historic context. It is important for the clustering algorithm to adapt to the recent changes in the evolving data. So Wang et
al. proposed ECKF (Evolutionary Clustering based on low rank Kernel matrix Factorization) framework for evolutionary clustering large-scale data based on low-rank kernel matrix factorization [24]. Chi et al. [4] stepped further to evolutionary spectral cluster-ing by incorporatcluster-ing temporal smoothness. In [17], an incremental approach is presented by extended stan-dard spectral clustering to handle evolving data. The exigent-system and the cluster labels are incremen-tally updated as data points are inserted/ deleted or similarity changes occur.
2.2. Matrix Factorization and Applications
Graphs are applied in a wide range, such as transpor-tation networks, sensor networks, social networks, and so on. The various problems are researched under graph mining. To find clusters in graphs is a new chal-lenge if the graph is evolving over time. The matrix is a usual representation of a graph. The relationships between matrix factorization and k-means clustering have been explored [9].
The SVD (Singular Value Decomposition) has been served as a building block for many important appli-cations, such as PCA (Principal Component Analysis) and LSI (Latent Semantic Indexing) [13]. SVD factor-izes a matrix with the general form of A ≈SVDT, where S is a unitary basis consisting of left-singular vectors of A, D is a unitary basis consisting of right-singular vectors of A, and V is a diagonal matrix with singu-lar values on the diagonal. In SVD, since matrices S and D are allowed to have negative eigenvalues, the projected data might have negative values in spite of the original data being positive. This can prevent the clustering results from be intuitively applied, such as documents or images that have a positive data input. Nonnegative Matrix Factorization (NMF) [6,15] is a linear and non-negative approximate data represen-tation technique. NMF focuses on the analysis of data matrices whose elements are nonnegative, a common occurrence in data sets derived from text and imag-es. The non-negative data matrix A is factorized into matrices F and G as A≈FGT, with the constraints that
Fx l y l z l l
line ∈ ∈ ∈
∃ : , ,
coll(x,y,z) + ∈HPyz x
− ∈HPyz x
x=y ∧ y=z y x≠ ∧ y=z
z
y≠ ∧ x∈[y,z]
coll(x,y,z) ∧ y≠ ∧z x∉[y,z] coll(x,y,z) ∧ y≠ ∧z x∈(−∞yz,y) coll(x,y,z) ∧ y≠ ∧z x∈(z,+∞yz)
¬
( )t ( )t ij
e E
( )t
i
s
( )tj
s
( )t ( )t
ij
W
( )t
ij
e
( )t n n
X
( )t ij
( )t ( )t i
s S
( )t ( )t j
s S
( )t
ij
( )t ( )t
ij W
( ) ( ) ( ) ( )
1 2
{ , , , }
t t t t
k
{1, , }
i k
( ) ( ) ( ) ( ) 1 2 1
{ , , , }
k
t t t t
i n
i
s s s
( )
1
k t i i
( )t
,
( )t ( )ti j
s s
S
( )t
ij
( )
( ) ( ) ( )
1 | |
{ , , t } i
t t t
i s s
( ) | t |
i
( )t
i
( )t
d×∃k and line l:Gx∈l,y∈l,z∈l
coll(x,y,z) + ∈HPyz x
− ∈HPyz x
x=y ∧ y=z y x≠ ∧ y=z
z
y≠ ∧ x∈[y,z]
coll(x,y,z) ∧ y≠ ∧z x∉[y,z] coll(x,y,z) ∧ y≠ ∧z x∈(−∞yz,y) coll(x,y,z) ∧ y≠ ∧z x∈(z,+∞yz)
¬
( )t ( )t ij
e E
( )t
i
s
( )tj
s
( )t ( )t
ij
W
( )t
ij
e
( )t n n
X
( )t ij
( )t ( )t i
s S
( )t ( )t j
s S
( )t
ij
( )t ( )t
ij W
( ) ( ) ( ) ( )
1 2
{ , , , }
t t t t
k
{1, , }
i k
( ) ( ) ( ) ( ) 1 2 1
{ , , , }
k
t t t t
i n
i
s s s
( )
1
k t i i
( )t
,
( )t ( )ti j
s s
S
( )t
ij
( )
( ) ( ) ( )
1 | |
{ , , t } i
t t t
i s s
( ) | t |
i
( )t
i
( )t
n×k are non-negative. It is
21
Information Technology and Control 2019/1/48
to a convenient clustering interpretation. The matrix G is restricted to be nonnegative while placing no re-striction on the signs of F and allowing data matrix X to have mixed signs. Convex-NMF restricts the col-umns of F to be convex combinations of data points in X. The NMF clustering method has been proposed [10], where F is considered to be a centroid matrix as every column represents a cluster center, and G is the cluster indicator matrix.
In particular, the result of the K-means clustering run can be written as a matrix factorization A = FGT, where A is a data matrix, F contains the cluster cen-troids, and G contains the cluster membership indica-tors. Nonnegative matrix factorization focuses on the analysis of data matrices whose elements are nonneg-ative [15].
To extend the applicable range of the NMF method, when the data matrix is unconstrained, Semi-NMF is motivated from the perspective of clustering [10]. The NMF restricts G to be a nonnegative while placing no restriction on the signs of F. For reasons of interpret-ability, the Convex-NMF constrains the basis vectors F = (f1, ... , fk). The vector defining F lies within the
col-umn space of A: fl = w1la1 + ... + wnlan = Awl, or F = AW.
It can be applied to both nonnegative and mixed-sign data matrices. This constraint could interpret the col-umns fl as weighted sums of certain data points and
these columns would capture a notion of the centroid. However, the traditional NMF, Semi-NMF, and Con-vex-NMF are linear models and they may fail to dis-cover the nonlinearities of data streams. In real world, the data streams have potential nonlinear structure. The kernel method is a powerful technique in deal-ing with nonlinear correlations. To achieve linearity of the nonlinearity, the kernel method is to map the data nonlinearly into a kernel feature space. The Con-vex-NMF method can be accomplished in the kernel feature space to process the nonlinear data.
Although these methods are successfully applied, the graphs require the huge amounts of space. Indeed, several important applications can be modeled as large sparse graphs, such as traffic network analysis, social network analysis. Low rank approximation for the matrix of a graph is essential in finding patterns and detecting anomalies. It can extract correlations and remove noise from matrix structured data. This has led to the development of these methods, such as Column and Row (CUR) decomposition [12],
Com-pact Matrix Decomposition (CMD) [22], and the fam-ily of Colibri [23].
The matrix CUR decomposition [12] is a powerful technique for low rank matrix decomposition. It can be regarded as an approximation of a matrix A≈
CUR, where ∃line l:Ax∈l,y∈l,z∈l coll(x,y,z)
+ ∈HPyz x
− ∈HPyz x
x=y ∧ y=z y x≠ ∧ y=z
z
y≠ ∧ x∈[y,z]
coll(x,y,z) ∧ y≠ ∧z x∉[y,z] coll(x,y,z) ∧ y≠ ∧z x∈(−∞yz,y) coll(x,y,z) ∧ y≠ ∧z x∈(z,+∞yz)
¬
( )t ( )t ij
e E
( )t
i
s
( )tj
s
( )t ( )t
ij
W
( )t
ij
e
( )t n n
X
( )t ij
( )t ( )t i
s S
( )t ( )t j
s S
( )t
ij
( )t ( )t
ij W
( ) ( ) ( ) ( )
1 2
{ , , , }
t t t t
k
{1, , }
i k
( ) ( ) ( ) ( ) 1 2 1
{ , , , }
k
t t t t
i n
i
s s s
( )
1
k t i i
( )t
,
( )t ( )ti j
s s
S
( )t
ij
( )
( ) ( ) ( )
1 | |
{ , , t } i
t t t
i s s
( ) | t |
i
( )t
i
( )t
m×n, C is an m×c matrix consisting of
C randomly picked columns of A, R is an r×n matrix consisting of r randomly picked rows of A, and U is a c×r matrix computed from C and R. The CUR decom-position is operated by first selecting the representa-tive column and row exemplars as the left and right matrices according to their probability distributions and then computes the middle matrix based on these two matrices. CUR decomposition both reveals infor-mation about the structure of the matrix and allows computations to be performed more efficiently. The CMD [22] can be employed to obtain sparse low rank approximations. Each unique sample is scaled up based on square root of the number of times in the initial subspace. The CMD is often used to de-tect anomalies and monitor time-evolving graphs. In comparison to CUR, CMD not only achieves equal accuracy as CUR, but also takes less space and com-putational. Moreover, CMD not only can analyze stat-ic graphs, but can handle with dynamstat-ic graphs. The family of Colibri [23] is low rank method for static and dynamic graphs, respectively. Colibri-S saves space and time by eliminating linearly dependent columns while iterating over sampled columns to construct the subspace used for low rank approximation. Co-libri-D builds on Colibri-S, and performs incremental updates efficiently, by exploiting the “smoothness” between two consecutive time steps.
3. Preliminaries and Formulations
3.1. Problem Statement