International Journal of Hematology-Oncology and Stem Cell Research
IJHOSCR 11(3) - ijhoscr.tums.ac.ir – July, 1, 2017
Expression Analysis of Long Non-coding PCAT-1
In Breast Cancer
Shaghayegh Sarrafzadeh1, Lobat Geranpayeh2, Soudeh Ghafouri-fard1
1
Department of Medical Genetics, Shahid Beheshti University of Medical Sciences, Tehran, Iran 2Department of Surgery, Sina Hospital, Tehran University of Medical Sciences, Tehran, Iran
Corresponding Author: Soudeh Ghafouri-fard, M.D., Ph.D. Shahid Beheshti University of Medical Sciences, Tehran, Iran Tel/ Fax: 00982123872572
Email: [email protected]
Received: 5, July, 2016 Accepted: 27, Sep, 2016
ABSTRACT
Background: The prostate cancer-associated non-coding RNA transcript 1 (PCAT-1) is a newly identified long non- coding RNA whose participation in tumorigenesis of a variety of cancers has been observed. In the present study, we aimed at analysis of its expression in breast cancer patients.
Subjects and Methods: The expression of PCAT-1 was assessed using real-time reverse transcription polymerase chain reaction in tumor samples obtained from 47newly diagnosed breast cancer patients as well as their corresponding adjacent non-cancerous tissues (ANCTs).
Results: We detected significant over-expression of PCAT-1 in 12/47 (25.5%) of tumoral tissues compared with their corresponding ANCTs. However, no significant association has been found between the levels of PCAT-1 transcripts and patients’ clinical data such as tumor size, stage, grade, estrogen and progesterone receptors or Her2/neu status.
Conclusion: PCAT-1 is possibly involved in the pathogenesis of fraction of breast cancers. Future studies are needed to evaluate its precise function in breast cancer.
Key words: Breast cancer, lncRNA, PCAT1
INTRODUCTION
Breast cancer is the most common cancer among women1. It has been regarded as a complex and heterogeneous disease distinguished by histological parameters as well as clinical markers such as hormone receptor status. Although this classification has been rather successful in determination of patient’s prognosis, a high level of disparity has been detected in patient’s response to treatment modalities. Consequently, gene expression profiling has been suggested as an efficient modality for classification of breast cancer subtypes, which can show the different cellular origins and degree of progression2. Several previous studies have evaluated the expression of
186
International Journal of Hematology Oncology and Stem Cell Research ijhoscr.tums.ac.ir
sequencing of poly A+ RNA (RNA-Seq) from a cohort of prostate tissues and cells lines10. This lncRNA has been shown to have a prostate-specific expression profile with minimal expression detected by quantitative real-time PCR in breast or lung cancer cell lines11 . PCAT-1 is a transcriptional repressor that participates in the regulation of cell proliferation and serves as a target of the Polycomb Repressive Complex 2 (PRC2). Notably, the researchers have suggested a method for categorization of patients into molecular subtypes based on the patterns of PCAT-1 and PRC2 expression10. This lncRNA has been found to regulate BRCA2 expression in the post-transcriptional level12. Furthermore, a prostate cancer risk-associated variant at rs7463708 has been shown to increase binding of a recently identified androgen receptor (AR)-interacting transcription factor, at a distal enhancer that loops to the PCAT-1 promoter, which leads to over-expression of PCAT-1following continued androgen treatment. Besides, PCAT1 cooperates with AR and LSD1 and is necessary for their gathering at the enhancers of two androgen late-response genes involved in prostate cancer tumorigenesis10. On the other hand, the AR has been demonstrated to be expressed in 3 main breast cancer subtypes. AR has a significant interaction with estrogen receptor (ER),so its participation in different signaling pathways is probably different among breast cancer subtypes13. So, PCAT-1 may contribute in the pathogenesis of breast cancer as well. Furthermore, elevated expression of PCAT-1 has been shown to be associated with decreased BRCA2 expression in prostate cancer cells12. Considering the role of BRCA2 in the repair of double strand breaks (DSB) and the contribution of its mutations in the pathogenesis of a fraction of breast cancers, PCAT-1 expression analysis would pave the way for identification of a mechanism for deficiencies in DSB repair in patients lacking BRCA mutations. In addition, PCAT-1–mediated proliferation in prostate cancer cells has been shown to be exerted through cMyc protein stabilization. In other words, PCAT-1 has a protective effect on cMyc by disruption of MYC regulation by miR-34a14. Consequently, in the present study, we evaluated the expression of
PCAT-1 and its relation with MYC transcript levels in a population of Iranian breast cancer patients.
SUBJECTS AND METHODS Patients' samples
Forty-seven newly diagnosed female breast cancer patients referred to Sina and Farmanieh Hospitals in 2015 were included in the present study. All patients were diagnosed with invasive ductal carcinoma of breast. Patients with history of cancer in other organs or history of radio or chemotherapy were excluded from the study. Tumoral tissues in addition to their ANCTs were obtained from all patients during surgery under the conventions of the Ethics Committee. ANCT was defined as the normal breast tissue diagnosed by the pathologists through H.E. staining. Informed consent was obtained from all study participants. Clinical and pathological information of patients were collected through questionnaires and assessment of medical records. The samples were immediately snap-frozen in liquid nitrogen and then stored at -70⁰C.
RNA extraction and quantitative real-time reverse transcription polymerase chain reaction (RT-PCR)
187 International Journal of Hematology Oncology and Stem Cell Research
ijhoscr.tums.ac.ir asnormalizer. Specific primers were designed using
Primer-BLAST online tool15. Forward and reverse primers sequences are as follows, respectively: PCAT-1: 5’- GAGAAGAGAAATCTATTGGAACC-3’ and 5’-GGTTTGTCTCCGCTGCTTTA-3’; B2M:
5’-AGATGAGTATGCCTGCCGTG-3’ and
5’-GCGGCATCTTCAAACCTCCA-3’; MYC:
5’-CACATCAGCACAACTACG-3’ and
5’-GTTCGCCTCTTGACATTC-3’. Melting curve analysis was performed to verify the specificity of the PCR products. Moreover, PCR products were electrophoresed on 2% agarose gel to verify product size and specificity.
Estrogen receptor (ER), progesterone receptor (PR), Her2/neu and Ki-67 status
The results of immunoreactivity for these markers were obtained from patients’ medical records. All of these markers were evaluated by immunohistochemical (IHC) staining. For ER and PR, staining of >20% of tumor cell nuclei was regarded as positive. For Her2/neu, a test result of 0 to 2+ was considered as negative and a result of 3+ as positive. Ki-67 values were stated as both the proportion of positively stained tumor cells amongst the whole number of tumor cells and as positive vs. negative.
Statistical analysis
LinRegPCR(2) and Relative Expression Software Tool-RG©-version 3 (QIAGEN, Korea) were applied for calculation of fold changes in gene expression.
The amplification efficiencies and cycle thresholds were included in the analyses. The quantities of mRNAs in the tissues were normalized to the B2M mRNA and compared between tumor and non-cancerous tissues. The pairwise fixed reallocation randomization test with 2000 iterations in the REST 2009 software was applied for the assessment of significance, which was set at the level of P<0.05. Besides, the correlation between PCAT-1 and MYC expression levels in a certain type of samples (tumor or ANCTs) was evaluated by the ratio of target genes over B2M expression (relative expression, REx). Data were analyzed using Pearson correlation statistical analysis. PCR assays were performed in duplicate for each sample, and the results were averaged.
Statistical analyses of demographic and clinical data were performed using SPSSv.21 (SPSS Inc., Chicago, IL). The McNemar test was used to compare paired tumor and ANCTs. Chi-square and independent t tests were used to evaluate the association between categorical variables. The level of statistical significance for the p value was set at 0.05.
RESULTS
General statistical information
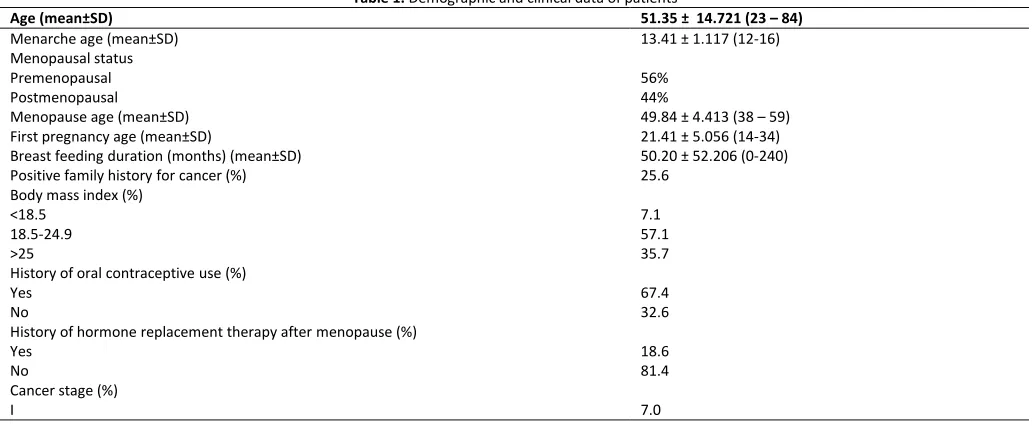
Patients’ information was obtained from questionnaires, interviews and evaluation of clinical and laboratory tests. Table 1 summarizes the demographic and clinical data of patients.
Table 1. Demographic and clinical data of patients
51.35 ± 14.721 (23 – 84) Age (mean±SD)
13.41 ± 1.117 (12-16) Menarche age (mean±SD)
Menopausal status
56% Premenopausal
44% Postmenopausal
49.84 ± 4.413 (38 – 59) Menopause age (mean±SD)
21.41 ± 5.056 (14-34) First pregnancy age (mean±SD)
50.20 ± 52.206 (0-240) Breast feeding duration (months) (mean±SD)
25.6 Positive family history for cancer (%)
Body mass index (%)
7.1 <18.5
57.1 18.5-24.9
35.7 >25
History of oral contraceptive use (%)
67.4 Yes
32.6 No
History of hormone replacement therapy after menopause (%)
18.6 Yes
81.4 No
Cancer stage (%)
188
International Journal of Hematology Oncology and Stem Cell Research ijhoscr.tums.ac.ir
58.1 II
30.2 III
4.7 IV
Grade (%)
11.9 I
54.8 II
33.3 III
Tumor size (%)
16.3 <2 cm
76.7 ≥2 cm, <5 cm
7.0 ≥5 cm
Estrogen receptor (%)
70.7 Positive
29.3 Negative
Progesterone receptor (%)
63.4 Positive
36.6 Negative
Her2/neu expression (%)
26.8 0
22.0 1
26.8 2
24.4 3
Ki67 expression (%)
94.7 Positive
5.3 Negative
Expression of PCAT1 in patients’ samples
We detected significant over-expression of PCAT-1 in 12/47 (25.5%) of tumoral tissues compared with their corresponding ANCTs. The relative expression values of PCAT-1 in these patients have been presented in Figure 1(the last three columns indicate the REx values more than 1). However, the level of PCAT-1 transcript was significantly lower in tumoral tissues compared with total tumor and ANCT tissues (P=0.02) (Figure 2). The frequency and
percentage of patients' samples in certain subgroups based on relative expression of PCAT-1 in tumor tissues compared with ANCTs are demonstrated in Figure 1. MYC was shown to be over-expressed in all samples compared with their corresponding ANCTs (P<0.001). The comparison of the level of PCAT-1 transcripts with those of MYC showed no significant association (P=0.461).
Figure 1. Frequency and cumulative percentage of samples in each subgroup based on relative expression of PCAT-1 in tumoral tissues compared with their corresponding adjacent non-cancerous tissue
0 0.2 0.4 0.6 0.8 1 1.2
0 5 10 15 20 25
<0.1 0.1-0.5 0.5-1 1.0-2.0 2.0-10.0 >10
Fr
e
q
u
e
n
cy
PCAT-1 expression ratio
189 International Journal of Hematology Oncology and Stem Cell Research
ijhoscr.tums.ac.ir The values under each column show the relative
expression (REx) of PCAT1 in tumoral tissues compared with their corresponding adjacent non-canceroustissues.The X-axis shows the number of
samples in each group based on REX values (left panel) and cumulative percentages (right panel).
Figure 2.Relative expression of PCAT-1 in tumor tissues and adjacent non-cancerous tissues
Correlations between genes expressions and clinical characteristics
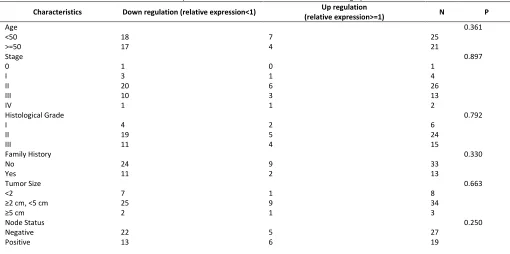
To define the role of PCAT-1 in breast cancer pathogenesis, we then evaluated the association between its transcript levels and several clinicopathological parameters. However, no significant associations were detected
betweenPCAT-1 expression and these characteristics (Table 2). Among all patients, 2were negative for ER, PR and HER2/neu expression (triple negative). In the tumoral tissues of both patients, PCAT-1 was significantly down-regulated compared with their ANCT counterparts.
Table 2.PCAT-1 expression and its associations with clinical and demographic data
Characteristics Down regulation (relative expression<1) Up regulation
(relative expression>=1) N P
Age 0.361
<50 18 7 25
>=50 17 4 21
Stage 0.897
0 1 0 1
I 3 1 4
II 20 6 26
III 10 3 13
IV 1 1 2
Histological Grade 0.792
I 4 2 6
II 19 5 24
III 11 4 15
Family History 0.330
No 24 9 33
Yes 11 2 13
Tumor Size 0.663
<2 7 1 8
≥2 cm, <5 cm 25 9 34
≥5 cm 2 1 3
Node Status 0.250
Negative 22 5 27
190
International Journal of Hematology Oncology and Stem Cell Research ijhoscr.tums.ac.ir
ER Status 0.641
Negative 9 3 12
Positive 24 8 32
PR Status 0.435
Negative 12 3 15
Positive 21 8 29
Her2/neu Status 0.237
Negative 27 7 34
Positive 6 4 10
Ki67 Status 0.535
Negative 2 1 3
Positive 30 8 38
Hormone Replacement Therapy 0.635
Negative 28 9 37
Positive 7 2 9
Body Mass Index 0.130
18.5-24.9 1 2 3
25-29.9 21 4 25
>30 12 5 17
Smoking History 0.569
Negative 33 10 43
Positive 2 1 3
Menopausal status 0.316
Premenopausal 18 8 26
Postmenopausal 14 4 18
DISCUSSION
In the present study, we demonstrated significant up-regulation of PCAT-1 in a proportion of breast cancer samples compared with their paired ANCTs. To the best of our knowledge, the present study is the first report on expression analysis of this lncRNA in samples from breast cancer patients. A previous study has shown its minimal expression in breast cancer cell lines11. Previously, it has been demonstrated that PCAT-1 expression in prostate cancer cells leads to a functional insufficiency in homologous recombination through its inhibitory effect on the BRCA2 tumor suppressor. The mentioned experiment has provided an explanation for the identification of impaired DSB repair mechanisms in cancers lacking BRCA1/BRCA2 mutations12. Similar in vitro studies in breast cancer cell lines are needed to identify PCAT-1 role in DSB repair in breast cancer. In addition, PCAT-1 has been shown to be significantly over-expressed in about two-thirds of colorectal cancer tissues compared with the matched normal tissues. A significant association has been found between its expression and distant metastasis as well as poor overall survival16. A more recent study demonstrated its up-regulation in hepatocellular carcinoma tissues compared with adjacent non-tumor tissues with a notable association between
191 International Journal of Hematology Oncology and Stem Cell Research
ijhoscr.tums.ac.ir The contribution of rs7463708 as a prostate cancer
risk-associated polymorphism in enhancing prostate transformation has been shown to be mediated through PCAT-1 up-regulation10. On the other hand, the role of this variant in breast cancer risk has not been assessed yet. Future studies can focus on evaluation of any association between PCAT-1 transcript levels, the certain variant of this polymorphism and breast cancer risk.
CONCLUSION
In brief, although lncRNAPCAT-1 has been shown to participate in many aspects of tumor progression, such as cell proliferation, migration and invasion in certain types of cancer18, its up-regulation has only been detected in a fraction of breast cancers. So for its application as a therapeutic target in breast cancer, it is necessary to assess its expression in individual samples to predict its contribution in the tumorigenesis and to select the best treatment modality as stated in personalized cancer medicine.
ACKNOWLEDGEMENT
This study was supported by a grant from Shahid Beheshti University of Medical Sciences and was performed by as the M.Sc. project of the first author.
CONFLICT OF INTEREST
The authors declare that they have no conflict of interest.
REFERENCES
1. Siegel RL, Miller KD, Jemal A. Cancer statistics, 2015. CA Cancer J Clin. 2015;65(1):5-29.
2. Waldemarson S, Kurbasic E, Krogh M, et al. Proteomic analysis of breast tumors confirms the mRNA intrinsic molecular subtypes using different classifiers: a large-scale analysis of fresh frozen tissue samples. Breast Cancer Res. 2016;18(1):69.
3. Dianatpour M, Mehdipour P, Nayernia K, et al. Expression of Testis Specific Genes TSGA10, TEX101 and ODF3 in Breast Cancer. Iranian Red Crescent medical journal. 2012;14(11):722-6.
4. Kazemi-Oula G, Ghafouri-Fard S, Mobasheri MB, et al. Upregulation of RHOXF2 and ODF4 Expression in Breast Cancer Tissues. Cell journal. 2015 Fall;17(3):471-7.
5. Derrien T, Johnson R, Bussotti G, et al. The GENCODE v7 catalog of human long noncoding RNAs: analysis of their gene structure, evolution, and expression. Genome Res. 2012;22(9):1775-89.
6. Nikpayam E, Tasharrofi B, Sarrafzadeh S, et al. The Role of Long Non-Coding RNAs in Ovarian Cancer. Iran Biomed J. 2017;21(1):3-15.
7. Soudyab M, Iranpour M, Ghafouri-Fard S. The Role of Long Non-Coding RNAs in Breast Cancer. Archives of Iranian medicine. 2016;19(7):508-17.
8. Iranpour M, Soudyab M, Geranpayeh L, et al. Expression analysis of four long noncoding RNAs in breast cancer. Tumour Biol. 2016;37(3):2933-40.
9. Tasharrofi B, Soudyab M, Nikpayam E, et al. Comparative expression analysis of hypoxia-inducible factor-alpha and its natural occurring antisense in breast cancer tissues and adjacent noncancerous tissues. Cell Biochem Function. 2016;34(8):572-578.
10.Guo HY, Ahmed M, Zhang F, et al. Modulation of long noncoding RNAs by risk SNPs underlying genetic predispositions to prostate cancer. Nat Genet. 2016;48(10):1142-50.
11.Prensner JR, Iyer MK, Balbin OA, et al. Transcriptome sequencing identifies PCAT-1, a novel lincRNA implicated in prostate cancer progression. Nat Biotechnol. 2011;29(8):742.
12.Proverbs-Singh T, Feldman JL, Morris MJ, et al. Targeting the androgen receptor in prostate and breast cancer: several new agents in development. Endocr-Relat Cancer. 2015;22(3):R87-R106.
13.Chia K, O'Brien M, Brown M, et al. Targeting the Androgen Receptor in Breast Cancer. Curr Oncol Rep. 2015;17(2).
14.Prensner JR, Chen W, Han SM, et al. The Long Non-Coding RNA PCAT-1 Promotes Prostate Cancer Cell Proliferation through cMyc. Neoplasia. 2014;16(11):900-8.
15.Ye J, Coulouris G, Zaretskaya I, et al. Primer-BLAST: a tool to design target-specific primers for polymerase chain reaction. BMC bioinformatics. 2012;13:134. 16.Ge X, Chen Y, Liao X, et al. Overexpression of long noncoding RNA PCAT-1 is a novel biomarker of poor prognosis in patients with colorectal cancer. Med Ooncol. 2013;30(2):588.
17.Yan TH, Yang H, Jiang JH, et al. Prognostic significance of long non-coding RNA PCAT-1 expression in human hepatocellular carcinoma. Int J Clin Exp Pathol. 2015;8(4):4126-31.