This is an open access journal, and articles are distributed under the terms of the Creative Commons Attribution-Non Commercial-ShareAlike 4.0 License, which allows others to remix, tweak, and build upon the work non-commercially, as long as appropriate credit is given and the new creations are licensed under the identical terms.
© 2019 Journal of Advanced Pharmacy Education & Research | Published by SPER Publication
108
Growth analysis of intercropped Wheat, Chickpea and wild
Mustard based on physical and thermal time scales
Aryan S. A. Dizayee*, Sami M. Maaroof
Department of Field Crops, College of Agriculture, Salahaddin University-Erbil, Kurdistan Region, Iraq.
Correspondence:
Aryan S. A. Dizayee, Department of Field Crops, College of Agriculture, Salahaddin University-Erbil, Kurdistan Region, Iraq.
Email: aryan.ahmed @ su.edu.krd.
ABSTRACT
A field experiment was carried out on intercropping of wheat (Triticum aestivum L.), chickpea (Cicer arietinum L.), and wild mustard
(Sinapis arvensis L.). Treatments from combinations of either single, double or triple (row: crop) proportions were arranged in the standard replacement series at Grdarasha experimental farm (36.2º N, 44.1º E, and elevation of 476 m) during the winter season of 2016-17. The aim of the present study was to evaluate some of the growth aspects of wheat (A) and chickpea (B) in the presence of wild mustard (C), which invades common weed in these areas. Wheat crop possessed the highest values of biological dry biomass (BIO), crop growth rate (CGR), and relative growth rate (RGR) whether measured on physical or thermal scales at the first three growth intervals, while mustard weed showed superiority in the same growth aspects at the last two growth stages of flowering and maturity. This could be the reason for the lower performance of the cultivated crops in the presence of the wild mustard.
Keywords: Intercropping, Growth indices, Row: crop ratio
Introduction
Wheat (Triticum aestivum L.) is the most important food crop in
Kurdistan region which lays under semi-guaranteed rainfall.
Chickpea (Cicer arietinum L.) is a staple crop pulse and is used
throughout the world, particularly Asian countries. [1] Wheat
and chickpea comprise respectively 50% and 20% of the total food production in the region. They consist of the first cereal and third pulse of the most edible crops that play a vital role in
universal agricultural economy, [2] with average productivity of
2.109 t ha-1 and 0.9 t ha-1 respectively. [3] Wheat production
reduced in Iraq by minus 14% during the period from 2013 to
2018. [4] Wild mustard (Sinapis arvensis L.) was recorded as early
as 1748 in New York State (c.f. Mulligan and Bailey, 1975).[5]
Mustard plants have the ability of dense invading due to the production of 2000 to 3500 viable soil embedded up to sixty
years. [6]
The natural resources such as water, soil, air, temperature, and other environmental resources caused by humans, lead to
differences in production (c.f. Rad et al., 2018).[7] So, the
studying of growth aspects of the interplant species supports the ecological management of the field crops. Growth analysis is one of the basic techniques used to determine growth aspects and represents the first step in primary production analysis, which is the most practical way to evaluate net photosynthetic
production. [8]Hoffmann and Poorter (2002) mentioned that
the most important growth aspect is the relative growth rate
(RGR).[9] Crop dry matter production can be analyzed in terms
of crop growth rate (CGR) and RGR, the two important
growth indices used in growth analysis. [10] Growth indices
based on the temperature, such as growing degree days (GDD), rather than elapsed time, allow for direct comparison among cultivars with different phonological and development techniques, and may otherwise be confused by temperature
variations. [11] Davidson and Campbell (1984) found high mean
values of initial RGR increasing up to near anthesis, then Access this article online
Website: www.japer.in E-ISSN: 2249-3379
How to cite this article: Aryan S. A. Dizayee, Sami M. Maaroof. Growth analysis of intercropped Wheat, Chickpea and wild Mustard based on physical and thermal time scales. J Adv Pharm Edu Res 2019;9(2):108-114.
decreasing with time up to zero, then negative values, during
the first maturity stage. [12] Differences in RGR and CGR are
rarely mentioned in growth studies. This fact was reported also
by [13] who recorded differences in RGR and CGR affecting
yield and yield improvement.
Many researchers regarded that plant biological processes are differed due to/or associated with masked role of temperature in physiological processes rather than time, and this principle
was recorded by Remur since 1735.[11] Consequently, wheat
and chickpea productions vary in the area including the current research, following the fluctuations in both the amount and distribution of rainfall. The scarcity of rainfall in the small parcels pushes the farmers toward intercropping choice. Intercropping is an old practice, placed on the fringes of modern agriculture dominated by large tracts of mono-cultural
crops, consuming resources and high yield crops. [14, 15] The
practice of growing of two or more dissimilar crop species or varieties in distinct row combinations simultaneously on the same field practicing is some kind of intercropping as described
by [16]. Many researchers mentioned the importance of this
process. [16-20] Intercropping plays a major role in expanding
biodiversity and maintenance of ecological balance in
agriculture ecosystem. [21]
The current research was carried out to study the beneficial gains from the wheat-based intercropping system including chickpea in the presence of natural wild mustard, over a variable row arrangement. The wheat was taken as a base crop and modified growth degree days or the unit scale (phyllocrone), besides elapsed time were employed to analyze the growth, aiming to find out the appropriate treatment with compatible row ratio.
Materials and Methods
A field study was carried out in Grdarasha, the experimental
farm of college of Agriculture-University of Salahaddin–Erbil,
on geographical location (36.2o N, 44.1o E and elevation 470 m
above the mean sea level), to study some of the growth aspects from intercropping wheat, chickpea, and wild mustard in single, double, and triple (row: crop) arrangement in a standard replacement series maintaining total number of 6 rows with varying ratios of species components, so that seven (row: species) consortia were formed the basic combinations of 21 plots repeated in 3 replications to form 63 units with an area of (2×2.40 m) including 20 cm departed sowing lines in randomized complete block design (RCBD). Each treatment was duplicated to avoid any probable risk. Data related to growth measurements and their estimated indices as biological dry biomass, crop growth rates, and relative growth rates based on physical (days) and thermal (phyllocrone) time scales were recorded and analyzed. Field practicing related to land preparing and cropping densities were achieved upon local agricultural recommended criteria. Mustard plant population was resembled from its natural local invasion density. The soil of the experiment was silty clay with composition of sand (11.22%), silt (47.28%), and clay (41.75%) with pH of 7.82,
EC of 0.2, 0.6% OM, 0.22% total nitrogen, as well as available P and K of 3.73 and 100 respectively. The climatic data during the experiments are presented in Table 2. Plant sampling achieved at emergence and physiological maturity including three regular samplings at each 20 days interval from emergence up to harvesting to measure the total biomass accumulation then estimating crop growth and relative growth rates based on time intervals scaled by days after establishment and modified growth degree days (phyllochron). Seeding was
done on Nov. 26th 2016, while harvesting was executed
manually at different dates (May 16th, 17th, and 18th 2017) for
wild mustard, chickpea, and wheat respectively according to their seed dryness.
Physiological study
Random samples were taken from the inner lines of each plot along the total of one meter for each species every 20 days from
plant establishment (DAS). The samples were dried at 72 ℃
for 48 hours, and both CGR (g m-2d-1) and RGR (mg g-1d-1)
were determined from the standard formulae. [22]
Estimation of Growth Indices
The CGR is defined as the daily production of plant dry matter per land unit area, and the RGR is the daily accumulation of dry
matter relative to the current plant dry weight. [23] Because of
the differences in the pattern of growth and maturation among the three competitor species used in this study, and due to the direct effect of temperature rather than day lengths, GDD was also taken into account to determine both CGR and RGR. Growth analysis was done based on measuring various mean rate changes in plant weights obtained at each interval following Radford (1967).
1- Crop Growth Rate (CGR).
CGR (g m-2d-1) = w2 − w1
t2 − t1
W2 and W1 = Plant dry matter (g) at time 2 and time 1,
respectively.
T2 and T1 = Physical times (days)
2- Relative Growth Rate (RGR)
RGR (mg g-1phyl-1) = (loge w2 − loge w1)
(t2 − t1)
ln = Natural logarithm (e = 2.718)
3- Growth Degree Days (GDD)
GDD = [(Tmax- Tmin)/2] - Tb
Where BIO is biological weights (g) and a temperature index measured in GDD units and calculated by summing the
following equation [11] for each day from the date of sowing to
the date of each sampling. GDD is the growing degree day for
1th day; T
max is the maximum daily air temperature with an
upper limit of 30 Cº; T
min is the minimum daily air temperature
with a lower limit of 0 ℃; Tb is set equal to 0 Cº, i.e. the base
110 Journal of Advanced Pharmacy Education & Research | Apr-Jun 2019 | Vol 9 | Issue
GDD2 and GDD1 = Growth degree day at the beginning and
end of each sampling interval (Phyllocron), respectively.
Tuckey’s 0.05 statistical analysis achieved on obtained data
using SAS computer package. Tuckey’s HSD test was adopted to
obtain 5% level of significance.
Results and Discussion
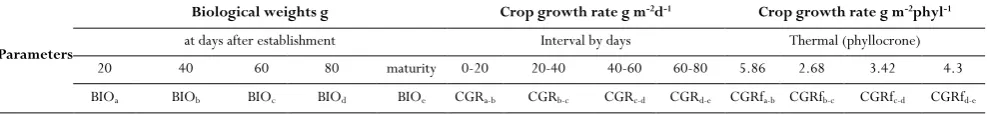
Tables 3 and 4 show the BIO at plant growth establishment, and
at 20, 40 and 60 days after establishment referred to as BIOa,
BIOb, BIOc, and BIOd respectively in addition to the dry
biomass at physiological maturity (BIOe). Biological biomass
reached its significantly (P ≤ 0.05) highest values at growth
intervals a, b and c for wheat, and intervals d and e for mustard plant. The superiority in biomass production followed by superiority in crop growth rate and relative growth rates based on time CGR and RGR, and thermal scales CGRf and RGRf (f after phyllocrone). Biomass mean values were 1.43, 4.12, and 14.57 g for wheat at the first three growth intervals a, b, and c respectively, while biomass mean values were 25.22 g and 31.24 g for the mustard plant at the two last growth intervals d and e, respectively. Chickpea was dominated by wheat and mustard plant in all the studied parameters. Superiority in crop growth rates and relative growth rates of wheat and mustard at the above-mentioned intervals related to each species and the significant lowest mean values of biomass of chickpea are the probable reasons for the higher and lower mean values of crop growth rates and relative growth rates of corresponding species. Crop growth rates as well as relative growth based on elapsed days behaved in direction to their corresponding rates based on thermal scale in superiority but had quite different mean values due to the variation of accumulated GDD (phyllochron) at the same growth period over the different season days. Wheat crop
had crop growth rate of 0.033 g m-2d-1 and 0.522 g m-2d-1 or
0.413 g m-2phyl-1 then 3.898 g m-2phyl-1, during the first two
intervals a and b, while the relative growth rate was 0.0059 mg
g-1d-1 and 0.0737 mg g-1phyl-1 at RGR
a and RGRfa respectively.
The external abnormal superiorities of CGRc, CGRfd, RGRc,
and RGRfd seem to be in the benefit of mustard plant at
intervals c and a, which is normal indeed due to estimation of those indices from two successive weight values. Mustard plant was superior in both of crop growth rates and relative growth rates at the two last growth intervals c and d with mean values
of 0.801 g m-2d-1 and 0.301 g m-2d-1 or 4.684 g m-2phyl-1 and
1.400 g m-2phyl-1 crop growth rates with 0.0220 mg g-1d-1,
0.0046 mg g1d-1 or 0.1284 mg g-1phyl-1 and 0.0214 mg g-1phyl-1
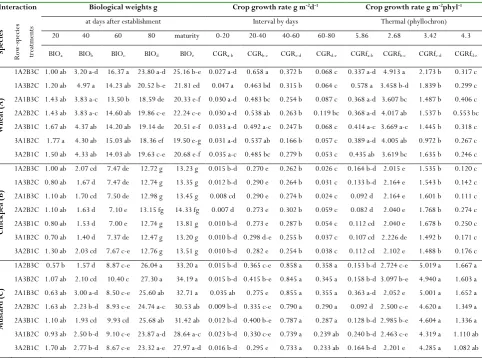
of relative growth rates based on both time scales, respectively. Table (5) reveals that most of parameters possessed non-significant differences when measured from the intercrops, except the intercropping consortium 1A2B3C that obtained significant superiority in the biological weights of 20.85 g and
23.86 g at the last two growth intervals BIOd and BIOe, crop
growth rates of 0.431 and 0.498 g m-2d-1 or 3.217 and 2.909 g
m-2 phyl-1 at growth intervals CGR
b, CGRc, CGRfb, and CGRfc
for both time scales respectively. This might be having 50% of cropping rows of the superior species mustard plant, while the
treatment combination of 3A2B1C revealed superiority in
biological weight of 1.50 g at growth interval BIOa. Table (6)
didn’t reveal any significant differences among three competitor
species on RGR.
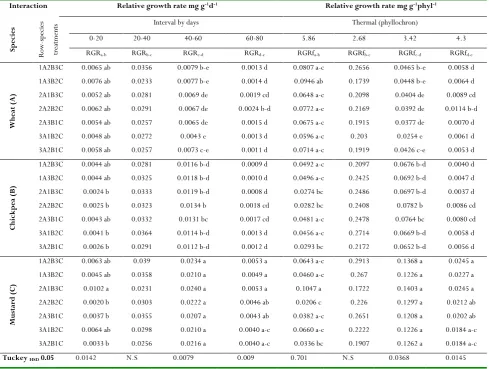
Tables 7 and 8 postulated significant differences at 5% probability among the different interactions between crops and intercropping consortia as the interaction between chickpea and the consortium wheat×1A2B3C produced the highest values of
biological weights of 16.37 g at growth interval BIOc. Besides,
the highest mean values of 0.658 g m-2d-1 or 4.913 g m-2phyl-1
crop growth rates were observed at growth intervals CGRb and
CGRfb respectively. For wheat × 1A3B2C recorded highest
mean value was 4.97 g and 0.578 g m-2phyl-1 at BIO
b and
CGRfa, while wheat×3A1B2C was superior at BIOa (1.77 g).
Interaction consortium of mustard×1A2B3C possessed the
highest significant mean values of 0.858 and 0.358 gm-2d-1 or
5.019 and 1.667 g m-2phyl-1 at growth intervals CGR
c, CGRd,
CGRfc, and CGRfd, while RGRd and RGRfd possessed 0.0053
mg g-1d-1 or 0.0245 mg g-1phyl-1 for both time scales,
respectively. Interaction of mustard×1A3B2C postulated 27.30
g and 34.19 g at last two growth intervals BIOe and BIOd, while
mustard×2A1B3C interaction had higher values of 0.0102 and
0.0240 mg g-1d-1 or 0.1047 mg g-1phyl-1 and 0.1403 mg g-1phyl-1
at growth intervals RGRa, RGRc, RGRfa, and RGRfc,
respectively. Comparison between CGR and RGR was measured on the bases of time (days) and thermal time
(phyllochron), as phyllochron refers to 100 ℃ of accumulated
temperature, the standard amount of temperature required to produce one wheat leaf or GDD.
Conclusions
To summarize the overall results of this study, it was conducted in general that the wild mustard negatively acts as a competitor to the principle crops according to wheat and chickpea.
Acknowledgments
We appreciate the assistance of the Field Crops Department, College of Agriculture, and University of Salahaddin-Erbil for their help and conducting these experiments.
References
1. Sumbul, A., Rizvi, R., Salah, M., Tiyagi, S.A., Ansari,
R.A. and Mahmood, I. Role of Different Sawdusts and Bioinoculant in the Management of Root-Knot Nematode Infesting Chickpea. Asian Journal of Crop Science. 2015; 7(3), p.197-206.
2. FAO. Production Year Book, 2002. Food and
Agriculture Organization of the United Nations (FAO), Rome, Italy. 2003; http://apps.fao.org.
3. Al-Qaesi, H.A.H. and Salih, A.A. The Analysis of the Main Statistical Indicators Which Characterize the
Economic Engineering in Agriculture and Rural Development. 2018; 18(1), pp.45-51.
4. FAO. Giews country brief of Iraq. 2018.
5. Mulligan, G.A. and Bailey, L.G. The Biology of Canadian Weeds. 8. Sinapis arvensis L. Canadian Journal of Plant Science. 1975; 55(1), pp. 171-183.
6. Warwick, S.I., Beckie, H.J., Thomas, A.G. and
McDonald, T. The biology of Canadian Weeds. 8.
Sinapis arvensis L. (updated). Canadian Journal of Plant Science. 2000; 80(4), pp. 939-961.
7. Rad, M.H., Ebrahimi, M. and Shirmohammadi, E. Land Use Change Effects on Plant and Soil Properties in a Mountainous Region of Iran. Journal of Environmental Science and Management. 2018; 21(2), pp.47-56.
8. Nogueira, S.S.S., Nagai, V., Braga, N.R., Novo, M. and Camargo, M.B.P. Growth analysis of chickpea (Cicer arietinum L.). Scientia Agricola. 1994; 51(3), pp. 430-435.
9. Hoffmann, W.A. and Poorter, H. Avoiding bias in
calculations of relative growth rate. Annals of botany. 2002; 90(1), pp. 37-42.
10. Watson, D. J. The physiological basis of variation in
yield. Advances in Agronomy. 1952; 4, pp. 101-45. 11. Russelle, M.P., Wilhelm, W.W., Olson, R.A. and
Power, J.F. Growth Analysis Based on Degree Days. Crop science. 1984; 24(1), pp. 28-32.
12. Davidson, H. R., and Campbell, C. A. Growth rates,
harvest index and moisture use of Manitou spring wheat as influenced by nitrogen, temperature and moisture. Canadian Journal of Plant Science. 1984; 64, pp. 825-839.
13. Siddique, K. H. M., Belford, R. K., Perry, M. W., and
Tennant, D. Growth, Development and Light Interception of Old and Modern Wheat Cultivars in a Mediterranean Type Environment. Australian Journal of Agricultural Research. 1989; 40, pp. 473-87.
14. Zhang, F., Shen, J., Zhang, J., Zuo, Y., Li, L. and
Chen, X. Rhizosphere Processes and Management for
Improving Nutrient Use Efficiency and Crop Productivity: Implications for China. Advances in Agronomy. 2010; 107, pp. 1-32.
15. Li L, Zhang, L.Z and Zhang, F.Z. Crop mixtures and
the mechanisms of overyielding. In: Levin SA, ed.
Encyclopedia of biodiversity, Waltham, MA, USA 2nd
ed, Vol, 2. Academic Press. 2013; pp. 382–395.
16. Katyayan, A. Fundamentals of Agriculture, Kushal
Publications & Distributors, Varanasi, Uttar Pradesh. 2005; pp. 10-11.
17. Ahlgren, H.L. and Aamodt, O.S. Harmful Root Interactions as a Possible Explanation for Effects Noted between Various Species of Grasses and Legumes. Agronomy Journal. 1939; 31(11), pp. 982-985.
18. Donald, C.M. Competition among crop and pasture plants. In: Advances in agronomy, Vol. 15. Academic Press. 1963; pp. 1-118.
19. Willey, R.W. The Use of Shade in Coffee, Cocoa and
Tea. Horticultural Abstracts. 1975; 45(12), pp.
791-798.
20. Sarkar, R.K., Shit, D. and Maitra, S. Competition
Functions, Productivity and Economics of Chickpea (Cicer arietinum)-Based Intercropping System Under Rainfed Conditions of Bihar Plateau. Indian Journal of Agronomy. 2000; 45(4), pp. 681-686.
21. Abate, M. and Alemayehu, G. Biological Benefits of Intercropping Maize (Zea mays L) with Fenugreek, Field Pea and Haricot Bean Under Irrigation in Fogera Plain, South Gonder Zone, Ethiopia. Agriculture, Forestry and Fisheries. 2018; 7(1), pp. 19-35.
22. Radford, P.J. Growth Analysis Formulae-Their Use and Abuse 1. Crop science. 1967; 7(3), pp. 171-175.
23. Warren Wilson, J. Analysis of growth, photosynthesis
and light interception for single plants and stands. Ann. Bot. 1981; 8, 507-12.
112 Journal of Advanced Pharmacy Education & Research | Apr-Jun 2019 | Vol 9 | Issue Table 1. The number of days and phyllochrones between each two successive growth intervals for
each plant component.
Plant Time scale (days) Thermal scale (phyllochron)
GS1 GS2 GS3 GS4 GS1 GS2 GS3 GS4
Wheat Chickpea
Mustard
81 73 67
20 20 20
20 20 20
20 20 20
6.52 5.75 5.30
2.68 2.68 2.68
3.42 3.42 3.42
4.30 4.30 4.30
Note: GS= growth stage.
Table 2. Meteorological data during the field experimental period rainfall season of 2016-2017.
Months
Temperature ℃
Rela
tiv
e
Hum
idit
y (
%)
Atm
os
pheric
Pres
su
re
Wi
nd D
ire
cti
on
Av
g.
M
aximum
Wind
Speed
Soil Temp. Preci
pitat
ion
(mm)
M
ax.
M
ini.
Av
era
ge
Nov.2016 Dec.2016 Jan.2017 Feb.2017 Mar.2017 Aprl.2017 May.2017
21.9 12.5 12.5 13.2 18.3 25.2 33.5
9.7 4.9 2.0 1.9 8.3 12.6 16.9
15.2 8.5 7.3 7.6 13.3 18.9 25.2
29.3 68.9 59.0 50.3 55.6 45.0 22.2
971.0 971.4 970.2 970.9 965.7 965.8 961.5
165.4 171.2 180.7 167.9 153.5 179.9 180.4
3.0 3.1 3.0 3.2 3.9 4.1 4.3
16.7 11.0 9.2 9.0 13.4 18.5 24.2
21.1 110.0 27.9 14.2 4.5 38.0
2.4
Table 3. Biological weight (BIO) and crop growth rate based on time (CGR) and temperature (CGRf) for three plant species in mono-cultures.
Parameters
Biological weights g Crop Growth Rate g m-2d-1 Crop Growth Rate g m-2phyl-1
at days after establishment Interval by days Thermal (phyllocrone)
20 40 60 80 maturity 0-20 20-40 40-60 60-80 5.86 2.68 3.42 4.30
BIOa BIOb BIOc BIOd BIOe CGRa-b CGRb-c CGRc-d CGRd-e CGRfa-b CGRfb-c CGRfc-d CGRfd-e
Spe
cie
s Wheat (A)
Chickpea (B) Mustard (C)
1.43 a 0.97 b 1.09 b
4.12 a 1.72 c 2.30 b
14.57 a 7.37 c 9.20 b
19.98 b 12.79 c 25.22 a
21.46 b 13.56 c 31.24 a
0.033 a 0.010 c 0.018 b
0.522 a 0.282 c 0.345 b
0.271 b 0.271 b 0.801 a
0.074 b 0.038 c 0.301 a
0.413 a 0.115 b 0.186 b
3.898 a 2.107 c 2.575 b
1.584 b 1.586 b 4.684 a
0.344 b 0.178 c 1.400 a
Tuckey HSD 0.05 0.2878 0.5196 0.6635 1.2868 1.5448 0.0073 0.0412 0.0546 0.0327 0.0755 0.3022 0.3177 0.1521
Table 4. Relative growth rate based on time (RGR) and temperature (RGRf) for three plant species in mono-cultures.
Parameters
Relative growth rate mg g-1d-1 Relative growth rate mg g-1phyl-1
Interval by days Thermal (phyllochron)
0-20 20-40 40-60 60-80 5.86 2.68 3.42 4.3
RGRa-b RGRb-c RGRc-d RGRd-e RGRfa-b RGRfb-c RGRfc-d RGRfd-e
Spe
cie
s Wheat (A) Chickpea (B) Mustard (C)
0.0059 a 0.0035 b 0.0052 a
0.0278 0.0321 0.0313
0.0068 c 0.0120 b 0.0220 a
0.0016 b 0.0012 b 0.0046 a
0.0737 a 0.0396 b 0.0533 b
0.2075 0.2397 0.2335
0.0395 c 0.0705 b 0.1284 a
0.0073 b 0.0058 b 0.0214 a
Tuckey HSD 0.05 0.0034 N.S 0.0019 0.0022 0.0169 N.S 0.0089 0.0035
Table 5. Biological weight (BIO) and crop growth rate based on time (CGR) and temperature (CGRf) for three plant species in mix-cultures.
Parameters
Biological weights g Crop growth rate g m-2d-1 Crop growth rate g m-2phyl-1
at days after establishment Interval by days Thermal (phyllocrone)
20 40 60 80 maturity 0-20 20-40 40-60 60-80 5.86 2.68 3.42 4.3
Row -s pe cie s tr eat ments 1A2B3C 1A3B2C 2A1B3C 2A2B2C 2A3B1C 3A1B2C 3A2B1C 0.86 b 1.02 ab 1.06 ab 1.39 ab 1.19 ab 1.13 ab 1.50 a 2.28 2.91 2.84 2.57 2.61 2.73 3.04 10.9 10.7 9.83 10.21 10.38 10.5 10.12 20.85 a 20.19 ab 19.06 ab 19.25 ab 19.19 ab 18.23 b 18.57 ab 23.86 a 23.12 ab 22.16 ab 22.37 ab 21.92 ab 20.45 b 20.72 b 0.019 0.025 0.024 0.015 0.019 0.021 0.02 0.431 a 0.389 ab 0.349 b 0.382 ab 0.388 ab 0.388 ab 0.354 ab 0.498 a 0.474 ab 0.461 ab 0.452 ab 0.441 ab 0.387 b 0.422 ab 0.151 0.147 0.155 0.156 0.136 0.111 0.108 0.218 0.29 0.274 0.181 0.218 0.245 0.237 3.217 a 2.906 ab 2.608 ab 2.852 ab 2.898 ab 2.898 ab 2.641 b 2.909 a 2.774 ab 2.697 ab 2.642 ab 2.576 ab 2.261 b 2.469 ab 0.701 0.681 0.723 0.726 0.635 0.516 0.501 Tuckey HSD
0.05 0.5607 N.S N.S 2.5061 3.0085 N.S 0.0803 0.1063 N.S N.S 0.5885 0.6188 N.S
Table 6. Relative growth rate based on time (RGR) and temperature (RGRf) for three plant species in mix-cultures.
Parameters
Relative growth rate mg g-1d-1 Relative growth rate mg g-1phyl-1
Interval by days Thermal (phyllochron)
0-20 20-40 40-60 60-80 5.86 2.68 3.42 4.3
RGRa-b RGRb-c RGRc-d RGRd-e RGRfa-b RGRfb-c RGRfc-d RGRfd-e
Row -s pe cie s tr eat ments 1A2B3C 1A3B2C 2A1B3C 2A2B2C 2A3B1C 3A1B2C 3A2B1C 0.0057 0.0055 0.0059 0.0036 0.0045 0.0051 0.0039 0.0342 0.0305 0.0281 0.0305 0.0315 0.0311 0.0268 0.0143 0.0135 0.0143 0.0141 0.0134 0.0122 0.0133 0.0025 0.0024 0.0027 0.0029 0.0025 0.0022 0.0021 0.0647 0.0634 0.0656 0.042 0.0513 0.0571 0.0448 0.2555 0.2278 0.2102 0.2279 0.2348 0.2322 0.1999 0.0836 0.0788 0.0835 0.0824 0.0783 0.0716 0.078 0.0114 0.0113 0.0123 0.0137 0.0118 0.0101 0.0098
Tuckey HSD 0.05 N.S N.S N.S N.S N.S N.S N.S N.S
Table 7. Biological weight (BIO) and crop growth rate based on time (CGR) and temperature (CGRf) for three plant species in
mix-cultures.
Interaction Biological weights g Crop growth rate g m-2d-1 Crop growth rate g m-2phyl-1
Spe cie s Row -sp eci es tr ea tm ents
at days after establishment Interval by days Thermal (phyllochron)
20 40 60 80 maturity 0-20 20-40 40-60 60-80 5.86 2.68 3.42 4.3
BIOa BIOb BIOc BIOd BIOe CGRa-b CGRb-c CGRc-d CGRd-e CGRfa-b CGRfb-c CGRfc-d CGRfd-e
114 Journal of Advanced Pharmacy Education & Research | Apr-Jun 2019 | Vol 9 | Issue Tuckey HSD
0.05 1.195 2.1563 2.7536 5.3406 6.4114 0.0303 0.1711 0.2265 0.1356 0.3135 1.2541 1.3187 0.6312
Table 8. Biological weight (BIO) and relative growth rate based on time (RGR) and temperature (RGRf) for three plant species
in mix-cultures.
Interaction Relative growth rate mg g-1d-1 Relative growth rate mg g-1phyl-1
Spe
cie
s
Row
-sp
eci
es
tr
ea
tm
ents
Interval by days Thermal (phyllochron)
0-20 20-40 40-60 60-80 5.86 2.68 3.42 4.3
RGRa-b RGRb-c RGRc-d RGRd-e RGRfa-b RGRfb-c RGRfc-d RGRfd-e
Whe
at
(A)
1A2B3C 1A3B2C 2A1B3C 2A2B2C 2A3B1C 3A1B2C 3A2B1C
0.0065 ab 0.0076 ab 0.0052 ab 0.0062 ab 0.0054 ab 0.0048 ab 0.0058 ab
0.0356 0.0233 0.0281 0.0291 0.0257 0.0272 0.0257
0.0079 b-e 0.0077 b-e 0.0069 de 0.0067 de 0.0065 de 0.0043 e 0.0073 c-e
0.0013 d 0.0014 d 0.0019 cd 0.0024 b-d 0.0015 d 0.0013 d 0.0011 d
0.0807 a-c 0.0946 ab 0.0648 a-c 0.0772 a-c 0.0675 a-c 0.0596 a-c 0.0714 a-c
0.2656 0.1739 0.2098 0.2169 0.1915 0.203 0.1919
0.0465 b-e 0.0448 b-e 0.0404 de 0.0392 de 0.0377 de 0.0254 e 0.0426 c-e
0.0058 d 0.0064 d 0.0089 cd 0.0114 b-d 0.0070 d 0.0061 d 0.0053 d
Chi
ckp
ea (B
)
1A2B3C 1A3B2C 2A1B3C 2A2B2C 2A3B1C 3A1B2C 3A2B1C
0.0044 ab 0.0044 ab 0.0024 b 0.0025 b 0.0043 ab 0.0041 b 0.0026 b
0.0281 0.0325 0.0333 0.0323 0.0332 0.0364 0.0291
0.0116 b-d 0.0118 b-d 0.0119 b-d 0.0134 b 0.0131 bc 0.0114 b-d 0.0112 b-d
0.0009 d 0.0010 d 0.0008 d 0.0018 cd 0.0017 cd 0.0013 d 0.0012 d
0.0492 a-c 0.0496 a-c 0.0274 bc 0.0282 bc 0.0481 a-c 0.0456 a-c 0.0293 bc
0.2097 0.2425 0.2486 0.2408 0.2478 0.2714 0.2172
0.0676 b-d 0.0692 b-d 0.0697 b-d 0.0782 b 0.0764 bc 0.0669 b-d 0.0652 b-d
0.0040 d 0.0047 d 0.0037 d 0.0086 cd 0.0080 cd 0.0058 d 0.0056 d
M
us
tard (
C)
1A2B3C 1A3B2C 2A1B3C 2A2B2C 2A3B1C 3A1B2C 3A2B1C
0.0063 ab 0.0045 ab 0.0102 a 0.0020 b 0.0037 b 0.0064 ab 0.0033 b
0.039 0.0358 0.0231 0.0303 0.0355 0.0298 0.0256
0.0234 a 0.0210 a 0.0240 a 0.0222 a 0.0207 a 0.0210 a 0.0216 a
0.0053 a 0.0049 a 0.0053 a 0.0046 ab 0.0043 ab 0.0040 a-c 0.0040 a-c
0.0643 a-c 0.0460 a-c 0.1047 a 0.0206 c 0.0382 a-c 0.0660 a-c 0.0336 bc
0.2913 0.267 0.1722
0.226 0.2651 0.2222 0.1907
0.1368 a 0.1226 a 0.1403 a 0.1297 a 0.1208 a 0.1226 a 0.1262 a
0.0245 a 0.0227 a 0.0245 a 0.0212 ab 0.0202 ab 0.0184 a-c 0.0184 a-c