Low cost humidity generator system development for
laboratory applications integrating a PID controller
doi.org/10.33500/ ijfr.2020.07.001Ittalo Pezzotti
1,2, Alexander Saldarriaga
2, Marco Moscatelli
1, Alessandro Orro
1,
Matteo Gnocchi
1and Luciano Milanesi
11
Institute of Biomedical Technologies, Via F.lli Cervi 93-20090, Segrate (Mi) Italy. 2
Physics School, National University of Colombia at Medellin, Street 59A # 63-20.
Article History ABSTRACT
Received 04 July, 2019 Received in revised form 13 August, 2019
Accepted 16 August, 2019
Keywords: Humidity, Electronic instruments, Environmental sensors, PID controllers.
Article Type:
Full Length Research Article
The purpose of this work is to present the development of a laboratory device with a low cost approach, which allows generating humidity ramps in a closed chamber. This development was achieved by integrating an electronic system for the control of thermodynamic variables, applying the proportional-integral-derivative (PID) control mechanism. The developed system allows testing on sensors, cell cultures, bacteria or tissues, under conditions of humidity and time chosen by the user. The prototype allows changes to be made between a level of 100% relative humidity at 19% in the dehumidification stage and from 19 to 100% in the humidification stage, including the hardware needed to capture data in real time and monitor the variables of interest.
©2020 BluePen Journals Ltd. All rights reserved
INTRODUCTION
The measurement and control of humidity is a constant need in multiple industrial or laboratory processes, understanding the humidity as the amount of water present in a material in relation to its total mass or with respect to its dry mass. Most of the solid materials around us have some water content and their measurement is influenced by the water-material interaction (Korotcenkov, 2019).
In manufacturing processes associated with the production of materials in different industries such as electronics, pharmaceutical, clinical or food, the control of environmental humidity is of utmost importance for the final quality of the finished product (Wernecke and
*Corresponding author. E-mail: [email protected]. Tel: 3315977719.
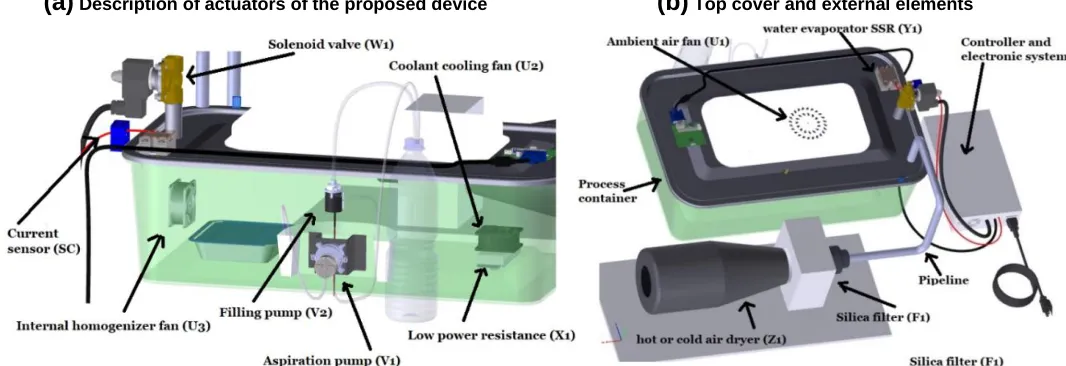
Figure 1. Container with some devices to modify the humidity inside.
This situation, that alters metabolic functions causes fatigue, dehydration of the skin, impaired absorption of oxygen and dryness of the mucous membranes present in the mouth and eyes, whose protective function keeps the body away from pathogens (Arundel et al., 1986;Kjtergaard and Pedersen, 1989). Excess moisture becomes the ideal medium for the proliferation of microorganisms such as fungi and spores that attack the immune system (Garrett et al., 1998). Another consequence of the low content of water in the ambient air is the presence of static electricity discharges in people and electronic equipment, a phenomenon that becomes relevant in data centers where electronic faults can occur in circuits, dust accumulation in reading heads and even breakage of magnetic media in data storage systems (Wan et al. 2013). Another type of hardware failure can occur in closed spaces with high humidity, where the generation of a wet layer on the surfaces of the materials allows the accumulation of electric charge (but not its discharge) (Elajnaf et al. 2006), giving way to transmission of charges towards the ground and eliminating electrical potentials.
In this work, a novel device, specifically a closed chamber for humidity tests, is presented with the aim of solving the problem of the high cost of purchasing equipment for laboratories and research centers. This development included the design, development, testing and optimization of the device, which has been built with inexpensive microcontrollers, sensors and actuators, as well as easy-to-buy hardware, within a budget of less than 120 Euros. This development will allow engineers and researchers to perform tests or experiments under controlled humidification and dehumidification conditions over a wide range of materials and products of scientific interest (Mensah and Choi, 2017).
MATERIALS AND METHODS
System components
The proposed device utilizes a set of sensors and actuators properly attached to a plastic container, in order to change the relative humidity inside it. The objective is to have the capacity to generate controlled humidification and dehumidification processes that allow carrying out different laboratory tests, for example, the study of the behavior of sensors, materials, compounds, fabrics and environmental applications in general (Mead et al., 2013; Jinno et al., 2017).The components of the desired device are shown in Figure 1.
Air container: It is a system designed to modify the properties of air and study its effects on materials or products of interest in a controlled manner (Sim and Cho, 2016).
Steam generator: Increase temperature and relative humidity by adding water vapor to the air inside the closed chamber.
Recirculation fan: works as an air mixer, improving the homogeneity of temperature and relative humidity throughout the volume of the closed chamber.
Low power heating element: electrical device used to heat the internal air slowly. This mechanism of heat transfer allows the air particles in the lower part of the container to rise and mix by pressure difference. This component allows heating the internal air to a temperature of 60°C.
Top cover: includes a fan to enter ambient air with the temperature and humidity conditions of the environment where the device is located.
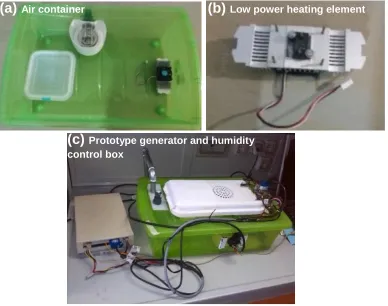
Figure 2. Description of the physical moisture system.
Air dryer: designed to deliver hot air to the system (up to 200°C), through a variable speed fan (activated by relay), which passes ambient air through a duct with electric heating elements and a silica filter that lowers humidity (Misha et al., 2012).
Sensors: the designed system includes the set of sensors that allow measuring the thermodynamic variables inside the container and controlling the actuators. Temperature sensors of dry bulb, internal humidity, external humidity, vapor temperature, atmospheric pressure, flow and level were used.
Figure 2ashows the plastic container without cover, while in Figure 2b, a low power heating element is illustrated and Figure 2c is the final prototype with control box.
Energy balance during the humidification process
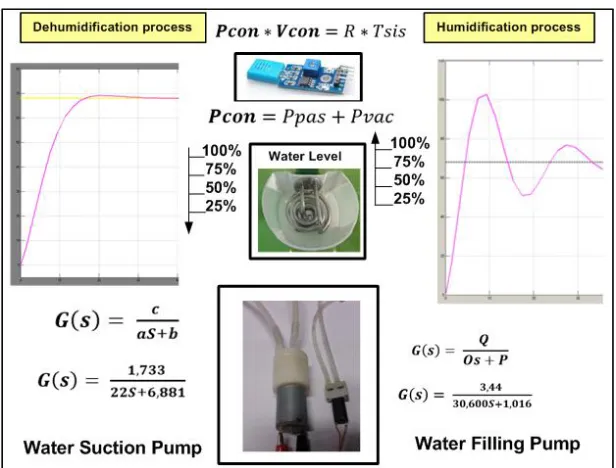
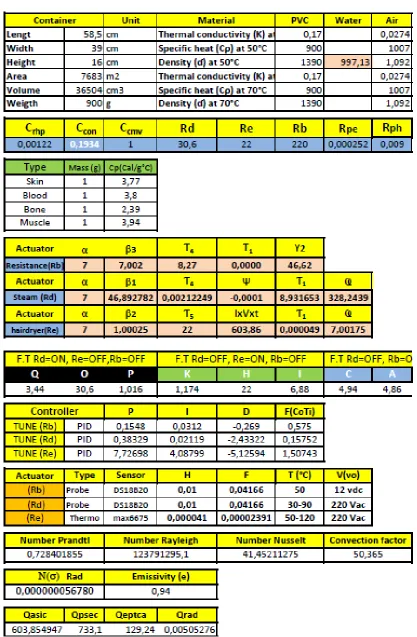
The humidification process was designed in two stages. The first stage covers the interval from 0 to 50% internal relative humidity and the second from 50 to 100%. Starting from the premise that, the air inside the container behaves like an ideal mixture of gases, the equation of state (Equation 1) is used, which relates pressure,
volume and temperature (known as the universal gas law). Where R the universal constant of gases and Tsis is the air temperature, Pcon is the total pressure measured in the container and Vcon is the volume of air. For this model, air is considered as an ideal gas stored at low pressure where enthalpy is a function that depends only on temperature (Ernst, 1982).
𝑷𝒄𝒐𝒏 ∗ 𝑽𝒄𝒐𝒏 = 𝑅 ∗ 𝑇𝑠𝑖𝑠 (1)
The experimental assembly included the installation of a pressure sensor (Bosch BMP180), in order to verify that the total pressure inside the container (Pcon) is equal to the sum of the dry air pressure (Ppas) and the vapor pressure of the water (Pvac), as it is expressed in Equation 2. The internal pressure measurement process was carried out in two stages. Firstly, the range of 0 to 10%of the sensor's wasapplied to themeasurement scale, until it reached a relative humidity level of 50%. The second measurement stage was made from 50% relative humidity, making use of the 90 to 100% range of the sensor measurement scale(Lewis et al., 2016).
𝑃𝑐𝑜𝑛 = 𝑃𝑝𝑎𝑠+ 𝑃𝑣𝑎𝑐 (2)
(a)
Air container(b)
Low power heating elementEnergy balance during the dehumidification process
This process involved two actuators responsible for delivering heat to the system. The first is a low cost, efficient air dryer, easy to install and control, which allows to lower the relative humidity up to 50% in a time interval of between 5 and 10 min. The second actuator is an electric heating element, which allowed lowering the relative humidity up to 5% with a total cycle time that varied between 13 and 20 min during the experimental measurement phase. The heat balance is summarized in Equation 3, where Qcco is the heating thermal load of the container, Qpva is the heat that enters the container,
Qstta corresponds to the thermal loss on the container cover, Qsicav is the loss due to external infiltrations, Qfm
is the thermal load of the living biological material
Qpconare the losses by stored heat in the walls of the container, and Fis defined as a dimensionless number between 0 and 1 that quantifies the external effects that can affect the mathematical model and the thermal balance, for this case F = 0. This equation will then be used to find the transfer function of the PID control(Gene and Franklin, 2014).
𝑸𝒄𝒄𝒐= [ 𝑄𝑝𝑣𝑎 − 𝑄𝑠𝑡𝑡𝑎 − 𝑄𝑠𝑖𝑐𝑎𝑣 − 𝑄𝑓𝑚− 𝑄𝑝𝑐𝑜𝑛] ∗ (1 + F) (3)
For the thermodynamic study of the dehumidification process, which resembles a drying process, some physical variables are known such as volume, weight, surface area, density and thermal conductivity of the plastic container and the air contained in it. The other variables necessary for the calculation of the input heat (Qasic) and the heat losses presented in Equation 4 were measured experimentally. Such is the case of the electrical resistance in ohms measured in the air dryer (Rsec = 24 Ω) and in the complementary heater (Rhc = 48 Ω).
𝑸𝒄𝒄𝒐= [𝑄𝑎𝑠𝑖𝑐 − 𝑄𝑠𝑡𝑡𝑎 − 𝑄𝑠𝑖𝑐𝑎𝑣− 𝑄𝑓𝑚− 𝑄𝑝𝑐𝑜𝑛] ∗ (1 + 𝐹) (4)
When the thermal equilibrium state is reached (during the generation of hot air in the circular section of the pipeline that transports it from the dryer to the container), the heat input Qasic can be found by using (Equation 5). Qpsec is the net heat at the entrance of the tube, Qeptca is the heat given by convection from the wall of the tube and
Qrad is the heat given by radiation from the wall of the tube.
𝑸𝒂𝒔𝒊𝒄= 𝑄𝑝𝑠𝑒𝑐 − 𝑄𝑒𝑝𝑡𝑐𝑎 − 𝑄𝑟𝑎𝑑 (5)
Electronic control system design
For electronic development, it is necessary to consider all the actuators of the system. For the developed apparatus
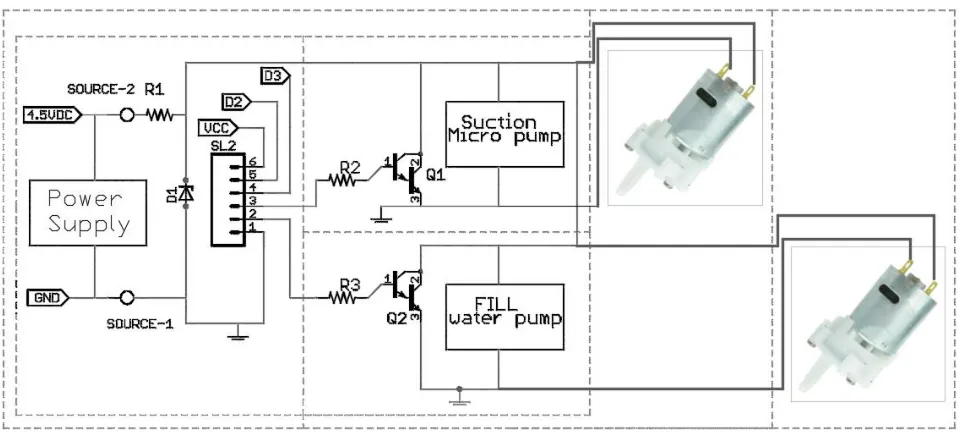
are the following: Z1, hot and cold air dryer; Y1, water evaporator; X1, low power heating element 5W; W1, normally closed solenoid valve; V1, water evacuation pump; V2, water filling pump; U1, ambient air fan; U2, fan cooler in the low power electric heater, U3 internal temperature homogenizer fan. In practice, these actuators operate at different voltages in their power and control circuits in the following way: actuators (Z1) and (Y1) operate at 220 VAC; (X1), (U1), (U2), and (U3) operate at 12 VDC while the actuators (V1), (V2) and the digital section operate at 5 VDC. In Figure 3, the electrical control scheme of the evacuation pumps (operating at 3.3 VDC) and water filling (operating at 5 VDC) in the steam generator is illustrated by(Li et al., 2016). These devices come into operation depending on the process stage that is being executed (humidification or dehumidification) (Figure 3).
Humidification Stage from 0 to 100%
To achieve the increase in relative humidity, it is necessary to saturate the air with water, in this case, in form of vapor. For the implemented system, a high power electrical heating element (Y1) submerged in a water container located inside the main container was used. The nature of the designed process requires the replacement of liquid water in container (V2), as the electric heater transforms it into steam. This filling function is executed through an electric micro pump that is governed by the control circuit described in Figure 4, and that regulates the electric current flow to the heating element, powered at 220V in a very short time.
Increase and control of humidity from 0 to 50%
For the generation of relative humidity ramps in the range of 0 to 50%, it is very important to take into account the relative humidity of the environment, which in practice can vary between 25 and 45%, depending on the season. Therefore, the humidification process can be relatively simple and require little energy. For this purpose, a low-power electric heater (X1) and a fan were used to homogenize the air-water composition inside the container (U3).
This circuit and method allows obtaining relative humidity ramps at a slow speed, which can be very useful in tests that require it (Figure 4). Other test methods can be implemented with the proposed design, allowing sampling times of up to 10 minutes to achieve stability at a selected humidity level.
Increase and Control of humidity from 50 to 100%
Figure 3. Electrical diagram of pumps for humidification and dehumidification.
Figure 4. DC Circuit for the handling of other actuators in DC.
is necessary to saturate the air with water particles. However, in preliminary tests, the system was saturated in 1 min and went from 50 to 100% in a sudden manner without allowing gradual state changes. As mentioned above, this condition depends a lot on the initial inertia imposed by the humidity in the surroundings. In order to
Figure 5. Circuit for the current control of the steam generator.
states that produced stable humidity conditions relative that they promote reliable measurements (Hu et al., 2018).
Decrease and humidity control from 100 to 45%
To be able to lower the humidity inside the closed system, which is 100%, it is necessary to eliminate the water vapor particles present in the air. To achieve this, a combined steam evacuation process (opening of the exhaust pipe through the valve drive W1), recirculation, and heating of the internal air are started (Figure 5). In order to execute the humidification process gradually, a control system was implemented on the air dryer (Z1), regulating the power of the heating element in three stages and regulating the speed of the fan that drives the air through it. In Figure 6, the corresponding circuit is illustrated.
Decrease and humidity control from 45 to 100%
To achieve this purpose it is necessary to have the control circuits as mentioned previously. First, the dryer (Z1) will allow the entry of dry hot air with the help of a silica filter (F1). It will be necessary to activate the low-power heating element (x1) to increase the temperature in conjunction with the opening of the solenoid valve (W1) to extract the densest air with water particles.
Operation of humidity control
Figure 6. Control circuit for steam drying.
electromagnetic noise generated by the actuators and their energy consumption. By having this characteristic as a design factor, it is possible to achieve a coherent electronic development with sensors and actuators that work according to each stage of the process (Benis and Ferrão, 2018).
Control for moisture increase
To control the increase in humidity, it is necessary to fill the main container of the steam generator (CP), so that the heating element (Y1) is turned on. For this, a micro pump is used to transport the water inside the container (V2). Once the sensor verifies the level (SN), check that the outlet air solenoid valve (W1) is closed and the electric evaporator is turned on. Because the system is capable of saturating the chamber at 100% in a very short time (approximately one minute), an adjustment was made with a solid-state relay, in order to regulate the supply current by time intervals and generate time versus humidity curves according to the object of study. The
algorithm is defined in intervals of 166 ms in the ON state and 500 ms in the OFF state. This control strategy helps to make a ramp of up to 10 min and allow certain stability within the entire system. In Equation 6, the heat demanded by the submerged heating element (Qpva) is equivalent to the sum of the heat absorbed by the water of the internal container plus the heat absorbed by the system, where Ce is the thermal capacity of water, mH2Ois
the mass of water andCpcon is the specific heat of the
plastic container.
𝑸𝒑𝒗𝒂=> 𝐼2∗ R𝑑= m𝐻2𝑂∗ C𝑒 𝐻2𝑂 𝑇𝑖 − 𝑇𝑒 + 𝐶𝑝𝑐𝑜𝑛 𝑇𝑖 − 𝑇𝑒 (6)
Control for moisture reduction
Figure 7. Diagram of reverse and direct action of humidity control.
is eliminated. Then, through the action of the low power heating element (X1) and the homogenization provided by the internal fans (U2, U3), the saturated air exits through the exhaust pipe through the operation of the valve (W1).
The equations of thermal equilibrium between the generation of hot air and the duct inlet to the container are as follows:
𝑸𝒂𝒔𝒊𝒄= 𝑄𝑠𝑝𝑒𝑐− 𝑄𝑒𝑝𝑡𝑐𝑎 − 𝑄𝑟𝑎𝑑 (7)
𝑸𝒑𝒔𝒆𝒄= 𝑚 ∗ 𝐶𝑎 𝑎𝑖𝑟 𝑇𝑖 − 𝑇𝑒 (8)
Heat equation corresponding to the exposed tube:
𝑸𝒆𝒑𝒕𝒄𝒂=≫ 𝑄𝑟𝑝𝑡 = 𝑄𝑟𝑟𝑐𝑎 (9)
Heatloss by conduction:Using Equation 10, the conduction loss in the metalic cylindrical pipe (transports the hot air from the air dryer to the container) can be calculated. In this case the pipe is not thermaly insulated, and D1 represents the internal
diameter of the pipe, D2 is the external diameter of the
pipe, K1is the thermal conductivity coefficient of steel,
Tpri and Tpre are the internal and external wall temperatures.
𝑸𝒓𝒑𝒕= 2∗𝜋∗k1
2.3 𝑙𝑜𝑔 𝐷2
𝐷1
∗ 𝑇𝑝𝑟𝑖 − 𝑇𝑝𝑟𝑒 (10)
Heat loss bay convection:
𝑸𝒓𝒓𝒄𝒂= h𝑎∗ 𝜋 ∗ D2 𝑇𝑝𝑟𝑒 − 𝑇𝑒 (11)
Radiation heat loss in the pipe:In Equation 12 the calculation is carried out using the Steffan-Boltzman constant (), the exposed area (A) and the steel emissivity (e).
𝑸𝒓𝒂𝒅 = σ ∗ Α ∗ e − 𝑇𝑝𝑟𝑖4− 𝑇𝑒4 (12)
METHODOLOGY PROCEDURES
Commercially there are multiple options for humidity control of closed test chambers. However, the components of a system for measuring, controlling and acquiring temperature and humidity data are of considerable cost. For this reason, the development method is based on the selection of sensors, actuators and open hardware controllers that integrated will allow obtaining a stable and reliable device (Figure 7).
external environment, a thermocouple type J with the integrated MAX6675 (ST7), two humidity sensors (DHT22) to know the heat (SH1) of the internal humidity and (SH2) of external humidity. The electric current sensor (SCT-013) was also installed to measure the current consumption when heating the dryer (SC1) and the pressure sensor inside the container (SP1). In preliminary tests, the version of the Arduino Mega 2560 board was used for data acquisition, but then a new integrated circuit was made using only the processor and adding the module (WIFI ESP8266) and a real time clock RTC (M41T11) for time management.
Analytical expressions for dynamic modeling
The humidification and dehumidification stages were carried out in the same plastic container, but using different actuators in each case. The control algorithm begins its operation by evaluating the environmental conditions of the surroundings where the device is located. From a value less than 50% humidity, the system proceeds to open the exhaust pipe by means of a solenoid valve, in order to balance the humidity. Then the control verifies the water level in the steam generator, proceeding to adjust it through the filling or evacuation pump to then start the operation of the heater in steam generator and close the valve. The function represented in (Equation 3) corresponds to the generic transfer function of the humidification process. This equation is the result of a specific mathematical treatment that applies specifically in the humidification process, and is used to characterize the relation between inputs and outputs (Ogata, 2003).
𝐺 𝑠 = 𝑂𝑠+𝑃𝑄 (13)
During the humidification step and using the heating element Rd (R = 30.2 Ω fed at 220 VAC), the parameters in Equation 14 were obtained, through the mathematical procedure performed on Equation 1.
𝐺 𝑠 = 30,600𝑆+1,0163,44 (14)
The function represented in (Equation 15) corresponds to the generic transfer function of the process of moisture reduction, or dehumidification process, using the same mathematical and conceptual procedure performed in (Equation 13).
𝐺 𝑠 = 𝑘
𝐻𝑠+𝐼 (15)
During the dehumidification, step and using the heating element Re (R = 22 Ω fed at 220 VAC), expression (Equation 16) was obtained.
𝐺 𝑠 = 22𝑆+6,781,174 (16)
In the same table, the results from proper calculations are also reported, including the parameter values to then perform the mathematical simulation, optimization and the corresponding comparison with the acquired data.
Control mechanisms
For the proposed system, tuning or searching the constants of the PID controller is carried out, using the reaction curve method and with the help of Simulink software (Ogata, 2003; Ziegles and Nichols, 1942).
Since it is a closed loop system, the passage of the open control loop is used. The record of the change in this response, over time, is called the process reaction curve that approximates a first-order system with dead time. The process reaction curve is determined by making a change in the process input signal to observe the measured variable.
A block diagram was developed with the input and output signals, including the controller. For the selected transfer function, a step value corresponding to an average value between the maximum and minimum value conceptually defined at the beginning of the development of the device was entered and displayed on an oscilloscope. Because the signal exceeds the defined reference value, the tuning process is executed. The results are recorded in Figure 8.
RESULTS AND DISCUSSION
Results
The same methodology was maintained for the analysis of each one of the actuators, making use of the mathematical model proposed. In addition, through an energy balance on the system, a set of three different transfer functions was obtained, which took into account both the experimentally captured information of each sensor and the final control elements. The resulting model can be described as a first order thermal model whose behavior offers a monotonous growing trend without oscillations.
Response curve of the Re actuator
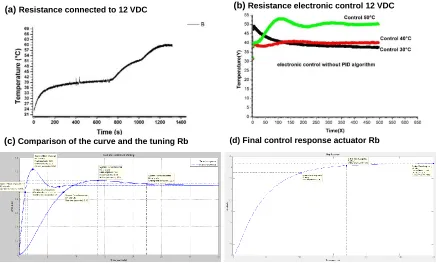
Figure 9. Actual response of the actuator, Re of 2000 W, using the electronic circuit.
temperature using the dryer and adding the low heating resistance Rb.
Figure 9c shows the response of the actuator without control (PID) and using the algorithm. This system is controlled using the circuit of Figure 6, in which different voltage dividers are handled in various resistor arrangements to manipulate the temperature and speed, using solid state relays and avoiding the heating of the components. Figure 9d instead shows the system after having achieved the tuning of the PID algorithm, where the best parameters were P = 7.72, I = 4.08, D = - 5.12, considerably decreasing the overshoot time.
Response curve of the actuator Rb
In Figure 10a the behavior of the heating element Rb is shown, which unlike the Rd, Re element, operates at 12 VDC. The curves in Figure 10b illustrate an apparent stability after the third minute, which is achieved through the control action of the circuit of Figure 4, fan circuit (4) (use TIP122 to regulate the output) and even without using the control algorithm PID. Figure 10a shows the
response of the heating element until reaching the limit proposed by the 60°C model, including the current delivery time of the electronic circuit extending the values in time up to almost four times with respect to Figure 10b. Figure 10c illustrates the response curve at 50°C in dotted line and the continuous line curve because of the optimization process with the suggested PID parameters. To perform the tuning procedure, a set point is chosen to then apply a step to the plant and observe the signal from the sensors. The change in amplitude as a function of time is recorded and the values reported in Figure8. The overshoot in the signal is optimized from 23.2 to 6.77%, however the stabilization time increases from 1 to 6.35 s. Figure 10d shows the correction of the stabilization time after tuning by means of the MatlabSisotool tool, in which it is possible to have an overshoot of 0% upon reaching the second 600.
Response curve of the actuator Rd
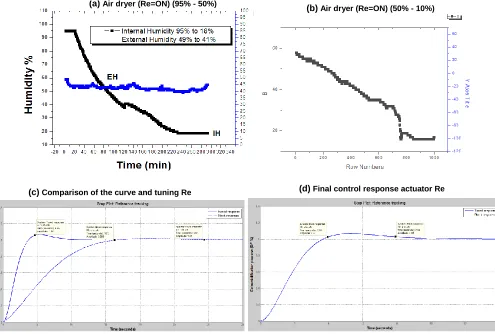
Figure 11a shows the curve of the increase in humidity. This happens when the filling pump passes the water to (a) Air dryer (Re=ON) (95% - 50%)
(b) Air dryer (Re=ON) (50% - 10%)
Figure 10. Actual response of the actuator, Rb of 25W, is using the electronic circuit.
Figure 11. Actual response of the actuator, Rd of 180 W, using the electronic circuit.
(a) Resistance connected to 12 VDC (b) Resistance electronic control 12 VDC
(d) Final control response actuator Rb
(c) Comparison of the curve and the tuning Rb
(a) Resistance connected to 12 VDC (b) Resistance electronic control 12 VDC
(d) Final control response actuator Rb
(c) Comparison of the curve and the tuning Rb
(a) Pump water, (Rd=Off) (5% to 50%) (b) Steam resistance (Rd=On) (50%- 95%)
(C) Comparison of the curve and the tuning Rd (d) Final control response actuator Rd
(a) Pump water, (Rd=Off) (5% to 50%) (b) Steam resistance (Rd=On) (50%- 95%)
Figure 12. Control algorithm for increasing humidity.
the internal container. Automatically the air is loaded with moisture, increasing it to a certain value that ranges between 30 and 40%. To continue this process, the Rd heating element or vaporizer at 220 Vac is involved, increasing the humidity until the air is completely loaded with water and the humidity reaches its maximum point, this is presented in Figure 11b.
Figure 11c shows the response of the actuator without control (PID) and using the algorithm, this system is controlled using the circuit of Figure 5, in which different power currents are handled to adjust the times and delays. Figure 11d on the other hand, shows the system after having achieved the tuning of the PID algorithm, where the best parameters were P = 0.38, I = 0.021, D = - 2.43, considerably decreasing the overshoot time.
Control algorithm for the humidification stage
In Figure 12, the algorithm designed to achieve a process of humidification suitable to conditions of relative humidity of the environment in a range of 45 to 60% is exposed. In order to avoid sudden increases in humidity (which would be an unfavorable condition for obtaining useful data for mathematical modeling), the algorithm establishes a moisture reduction action up to 18%. This condition, which in practice is achieved through the proper
implementation of electronic components and its control firmware, allows to obtain test steps for each moisture level selected during the stage of capturing data of interest.
Control algorithm for the dehumidification stage
The algorithm described in Figure 13 illustrates the logical order established for the stage of capturing experimental data during the drying process. Specific actions such as the opening of the exhaust pipe and the entry of hot air, allow to lower the humidity from the point of saturation to 75% of relative humidity. At this point, the low power heater is activated, adding thermal energy to the air and lowering the relative humidity, in conjunction with the homogenization action performed by the recirculation fan. Once the humidity reaches the Set Point level, the exhaust duct is closed.
Discussion
Figure 13.Control algorithm for decreasing humidity.
camera with those that are commercially available.
Conclusion
Many of the actuators of this system are of ON-OFF type, for this reason the times in which the events take place are not convenient, due to the fact that it is not possible to adequately manipulate the system variables. For example, in the process of capturing data for test curves, humidity went from 18 to 95% in just 60 s (humidification process). This condition could be corrected through the implementation of control hardware over the supply current of the heating element present in the steam generator, favoring sampling times of up to 10 min.
Although, in the humidification process, the tuning and calibration curves of the controller were found with the variables p, k, i, it is not possible to use the same variables for the inverse process, since the array of actuators is completely different.
Note that to remove the moisture in the saturation state inside the container, an air dryer, a 5 W heating element and some fans were used to first extract the humid air and then to recirculate it. The final arrangement of sensors and actuators retained the low cost approach, taking into account the effect of the increase in temperature on the relative humidity of the air under study.
It became necessary to use digital and analog electronic tools to materialize the idea of building a humidity ramp generator with PID controller in the same body. This practical approach resulted in a device with good response speed, which captures data in real time and whose control loop has no delays. The final prototype also included a firmware with menu management that allows managing the sensors, which is a design strategy that can be scaled to other applications.
ACKNOWLEDGEMENTS
MIUR PON ELIXIR "CNR-BIOmics", Italian flagship "InterOmics" and PRIN 2015 20157ATSLF projects.
Gimel-, efficient use of electrical energy Group, University of Antioquia.
GICEI: Scientific and Industrial Instrumentation Group, Department of Physics, National University of Colombia, at Medellin –Colombia.
REFERENCES
Arundel A. V., Sterling E. M., Biggin J. H. & Sterling T. D. (1986). Indirect health effects of relative humidity in indoor environments. Environ Health Perspect. 65:351-361. PMCID: PMC1474709, PMID: 3709462.
Boor B. E., Spilak M. P., Laverge J., Novoselac A. & Xu Y. (2017). Human exposure to indoor air pollutants in sleep microenvironments: A literature review. Building and Environment. 125:528-555.
Elajnaf A., Carter P. & Rowley G. (2006). Electrostatic characterization of inhaled powders: Effect of contact surface and relative humidity. Eur. J. Pharm. Sci. 29(5):375-384.
Ernst S. (1982). Properties of water and steam in SI units. Verlag, Berlin.
Franklin G. F. , Powell J. D.& Emami-NaeiniA (2014). Feedback control of dynamic systems. 7th Prentice Hall Press Upper Saddle River, NJ, USA. ISBN:0133496597 9780133496598.
Garrett M. H., Rayment P. R., Hooper M. A., Abramson M. J. & Hooper B. M. (1998). Indoor airborne fungal spores, house dampness and associations with environmental factors and respiratory health in children. Clin. Exp. Allerg. 28:459–467.
Hu S., Ge J., Dong H., Xue L., Yuan Z., Zhu J. & Zhang H. Y. (2018). Research on a thermostatic heating control system for optically pumped cesium magnetometer. 37th Chinese Control Conference (CCC).https://doi.org/10.23919/ChiCC.2018.8484244
.
Jinno H., Fukuda K., Xu X., Park S., Suzuki Y., Koizumi M., Yokota T., Osaka I., Takimiya K. & Someya T. (2017). Stretchable and waterproof elastomer-coated organic photovoltaics for washable electronic textile applications. Nat. Energy. 2:780-785.
Kjtergaard S. K. & Pedersen O. F. (1989). Dust exposure, eye redness, eye cytology and mucous membrane irritation in a tobacco industry. Int. Arch. Occup. Environ. Health. 61(8):519-525.
Korotcenkov G. (2019). Handbook of humidity measurement: methods, materials and technologies, Vol. 2: Electronic and Electrical Humidity Sensors.
Lewis A. J., Campbell M. & Stavroulakis P. (2016). Performance evaluation of a cheap, open source, digital environmental monitor based on the Raspberry Pi. Measurement. 87:228-235. https://doi.org/10.1016/J.MEASUREMENT.2016.03.023
.
Li B., Lai W., Yang C. & Zheng S. (2016). Design of the intelligent air humidifier. International Conference on Mechatronics Engineering and Information Technology. Pp. 2352-5401. https://doi.org/10.2991/icmeit-16.2016.20.
Mead M. I., Popoola O. A. M., Stewart G. B., Landshoff P., Calleja M., Hayes M., Baldovi J. J., McLeod M. W., Hodgson T. F., Dicks J.,Lewise A., Cohenf J., Barong R., Saffellg J. R. & Jonesa R. L. (2013). The use of electrochemical sensors for monitoring urban air quality in low-cost, high-density networks. Atmos. Environ. 70:186-203.
Mensah K. & Choi J. M. (2017). Energy consumption and stability investigation of constant temperature and humidity test chamber. Int. J. Air-Condit. Refrigerat. 25(1):1750010.
Misha S., Mat S., Ruslan M. H. & Sopian K. (2012). Review of solid/liquid desiccant in the drying applications and its regeneration methods. Renew. Sustain. Energ. Rev. 16(7):4686-4707. https://doi.org/10.1016/J.RSER.2012.04.041.
Ogata K. (2003). Modern control engineering. Prentice Hall, 2003. Peder W. (2018). Indoor air humidity, air quality and health – An
overview. Int. J. Hyg. Environ. Health. 221(3):376-390. https://doi.org/10.1016/j.ijheh.2018.01.015.
Pitarma R., Marques G. & Ferreira B. R. (2017). Monitoring indoor air quality for enhanced occupational health. J. Med. Syst. 41(2):23. https://doi.org/10.1007/s10916-016-0667-2.
Sim J. K. & Cho Y. H. (2016). Portable sweat rate sensors integrated with air ventilation actuators. Sensors and Actuators B: Chemical. 234:176-183. https://doi.org/10.1016/J.SNB.2016.04.137.
Wan F. Y., Swenson D., Hillstrom M., Pommerenke D. & Stayer C. (2013). The effect of humidity on static electricity induced reliability issues of ICT equipment in data centers-motivation and setup of the Study. Ashrae Trans. 119:341-357.
Wernecke J. & Wernecke R. (2014). Industrial moisture and humidity measurement: A Practical Guide.