Vol. 48, No. 2, Fall 2016, pp. 103-110
Please cite this article using:
Aminnayeri, M., and Sogandi, F., 2016. “A Risk-Adjusted Self-Starting Bernoulli CUSUM Control Chart with Dynamic Probability Control Limits”. Amirkabir International Journal of Modeling,
Identification, Simulation and Control, 48(2), pp. 103–110. DOI: 10.22060/miscj.2016.833
URL: http://miscj.aut.ac.ir/article_833.html
*Corresponding Author, Email: [email protected]
A Risk-Adjusted Self-Starting Bernoulli CUSUM Control
Chart with Dynamic Probability Control Limits
M. Aminnayeri1,*, F. Sogandi2
1- Associate Professor, Department of Industrial Engineering, Amirkabir University of Technology 2- Ph.D. Student, Department of Industrial Engineering, Amirkabir University of Technology
(Received 7 March 2016, Accepted 3 September 2016)
Usually, in monitoring schemes, the nominal value of the process parameter is assumed to be known. However, this assumption is violated owing to costly sampling and the lack of data, particularly in healthcare systems. On the other hand, applying a fixed control limit for the risk-adjusted Bernoulli chart gives rise to a variable in-control average run length performance for patient populations with dissimilar risk score distributions in monitoring clinical and surgical performance. To solve these problems, a self-starting scheme is proposed based on a parametric bootstrap method and dynamic probability control limits for the risk-adjusted Bernoulli cumulative sum control charts. The main contribution of the pro-posed control charts relates to the use of probability control limits when any assumption does not need about the patients’ risk distributions and process parameter. Simulation studies show that both proposed schemes have a good performance under various shifts.
K
EYWORDS:Average Run Length, Self-Starting Monitoring, Bernoulli Process, Probability Control Limits, Surgical Performance
1- I
NTRODUCTION
Due to the increasing desire for healthcare systems improvement, control charts as one of the most important tools in statistical process control (SPC) are applied. Chou [1] provided a comprehensive guide to adopting control charts as the main tools in SPC with practical issues related to healthcare systems. Once the control charts are activated, detecting assignable causes is one of the most important issues as soon as possible once an adverse event occurs. Using a proper monitoring scheme, fast assignable causes, and frequent false alarms can be balanced. For detailed information, refer to the comprehensive review papers on health care area presented by Tennant et al. [2] and Woodall et al. [3]. By current published evidence, the case for applying statistical process control in monitoring clinical performance is very strong [4].
Generally, the proposed control charts depend on the kind of the assumed underlying probability distribution used for modeling. In this regard, Coory et al. [5] used control charts quality of hospital care with administrative data for specific conditions. Regarding to Bernoulli models, data consist of information on successive items classified as conforming or nonconforming. Hence, these models are considerably applied to health-related research that the incidence rate of a medicinal issue, for example, a congenital malformation is of interest. For example, Joner et al. [6] detected a rate increase using a Bernoulli scan statistic. Some early applications of control charts in medicine, such as De Leval et al. [7] and Steiner et al. [8], considered the monitoring cardiac surgery outcomes without considering risk adjustment. Also, Shu et al. [9] compared weighted cumulative sum (WCUSUM) and conventional CUSUM procedures based on a Poisson model in the presence of monotone changes in population size. Recently, Sun et al. [10] have proposed a WCUSUM to monitor medical outcomes with dependent censoring. Also, Lim et al. [11] extended CUSUM charts to evaluate doctors’ performance. However, in most medical applications, owing to the heterogeneity of patients, risk adjustment is necessary. Risk-adjusted monitoring scheme is an important topic in the healthcare system and has received much attention. The risk-adjustment can occur with a risk probability being assigned to each patient. As one of the first works, Steiner et al. [12] applied Bernoulli outcomes in the risk-adjusted CUSUM charts. Jones and Steiner [13] showed that estimation error can affect risk-adjusted
CUSUM chart performance. More recently, Rossi et al. [14] developed a new risk-adjusted Bernoulli CUSUM chart to monitor binary health data. Taseli and Benneyan [15] developed similar types of risk-adjusted sequential probability ratio tests. A considerable number of studies have been devoted to developing risk-adjustment monitoring scheme over the past few decades. For example, Gombay et al. [16] conducted a comparative study to monitor binary outcomes using risk-adjusted charts. In this context, Zeng [17] reviewed the existing studies on a risk adjusted monitoring, including the risk adjustment models and known scheme for change detection based on these models. Tang et al. [18] have recently proposed a risk-adjusted CUSUM chart based on multi responses for Binary data.
Detecting performance of the risk-adjusted exponentially weighted moving average (EWMA) charts are similar to CUSUM charts. Also, the effect of previous observations is gradually omitted in the statistic by adjusting the statistic weights applied by healthcare practitioners [19]. Relating to the monitoring of time-between-events, a generalized group runs control chart is provided by Fang et al. [20]. After that, Pan and Jarret [21] constructed a Multivariate EWMA (MEWMA) control chart in the biosurveillance area.
On the other hand, the patient mixes for different hospitals and surgeons are very common in applications. Thus, applying fixed control limits leads to a variable in-control average run length (ARL) performance in risk-adjusted Bernoulli CUSUM charts. To alleviate this problem, the dynamic probability control limits (DPCLs) to the risk-adjusted Bernoulli CUSUM chart are proposed by Zhang and Woodall [22] to monitor the surgical performance. In addition, Shen et al. [23] designed the DPCLs in EWMA chart to monitor Poisson count data with time-varying population sizes. In this approach, the conditional probability of a false alarm is considered to be fixed to maintain that there is no false alarm for previous observations. As a result, an in-control run length distribution is partly a geometric distribution with a given in-control ARL for any group of patients. It should be noted that although conditional false alarm rate is monitored to be fixed, this approach can be used to design the chart with any given sequence of the conditional false alarm rates.
by considering categorical covariates. In Phase I, Asadayyoobi and Niaki [25] proposed an accelerated failure time-based risk-adjusted control chart to monitor continuous surgical outcomes. In addition, at the same Phase, Mohammadian et al. [26] provided a risk adjusted Geometric control charts. Most of the studies have primarily concentrated on the Phase II monitoring by considering in-control parameter is known or estimated based on a sufficient number of historical data set; however, in many applications, this assumption may be violated. In these situations, self-starting approaches are utilized such as Hawkins [27] and Hawkins and Tchao [28] that update the parameter estimates and simultaneously alarm out-of-control condition. On this subject, Shen et al. [29] proposed a self-starting EWMA control scheme based on a parametric bootstrap for Poisson count data with varying population sizes. They determined probability control limits at each time point after observing the sample size without any prior knowledge of in-control parameter.
As aforementioned, binary outcomes as one of the most practical cases related to healthcare field would be adjusted. On the other hand, there is a common situation in applications where in-control process parameter is unavailable. It is worth mentioning that determining the proper control limits depends noticeably on the unknown process parameter. In other words, the estimation of the parameter resulting unsuitable in control run average length performance. Hence, in this paper, the risk adjusted CUSUM control charts are proposed based on the DPCLs using a self-starting method in monitoring the Bernoulli process. The remainder of this paper is presented as follows: in the next section, the self-starting chart in the statistical model is discussed. The risk adjusted CUSUM control charts is given with probability control limits in section 3. In section 4, the performance study on the proposed control charts are investigated and compared. Finally, several remarks draw the paper to its conclusion in section 5.
2- U
NDERLYING
M
ODEL AND
S
ELF-S
TARTING
M
ONITORING
S
CHEME
In many SPC applications in healthcare, the outcome of interest is defined for each individual patient. For example, whether or not each surgical patient has a special type of infection. Therefore, each case distribution follows the Bernoulli distribution. Regarding this issue, [30] reviewed the charts survey
for monitoring Bernoulli processes and said that the incidence rate of a rare disease or medical problem is covered with this distribution. As aforesaid, there is major variability in risks of patient populations. Hence, the standard Bernoulli chart cannot be applied to monitor surgical performance. In this section, a self-starting method is given to monitor process parameter. To this end, let yt be values independently follow the Bernoulli distribution with the mean πt during the constant time interval. In these situations where in-control process parameter is being monitored, the main interest is detecting its increases. Note that the surgical failure rate for each patient is computed by the pre-operative patient risk using the logistic regression model based on Parsonnet scores [31]. A sudden shift happens in the primary process parameter to another unknown value at some unknown time τ. It is assumed that m0 denote historical observation collected over time as an independent reference. The goal is detecting time point that an out-of-control condition is occurred considering the patient risk and lack of the sufficient data.
3- P
ROPOSED
C
ONTROL
C
HARTS
Note that the false alarm rate was adjusted to avoid unnecessary interventions. Therefore, the control limits need to be designed for each surgeon based on assumptions about the patient population. To overcome this issue, the DPCLs are used to the risk-adjusted Bernoulli CUSUM chart. In this regard, keeping the conditional probability in a specified false alarm means there is no false alarm for previous data at a fixed value.
DPCLs h(α)=(h1(α), h2(α),...,hk(α),...) satisfy Eq. (1) according to Shen et al. [23] in which ht(α) relates to the upper control limit and α is the given conditional false alarm rate. β is an updated parameter estimate along with 25 new observations in self-starting monitoring. It should be noted that the number of new observations for updating beta is tuned by trial and error method in the range of 5-50 to obtain an appropriate estimation of this parameter.
(1)
Now, statistic is obtained equal to Ct+=max(0,C
t-1+ +Wt) for each patient where Wt is
calculated using following equation according to Shen et al. [23]:
(2)
where pt and yt are observed values and process parameter, respectively. Also, the risk-adjusted CUSUM chart is designed to monitor for an odds ratio change from R0 to Ra in which R denote the failure odds ratio.
As aforementioned, it is not easy to determine
ht(α) depending on the in control distributions of Ct on the parameter pt. For this purpose, a parametric bootstrap iteratively is applied at each sample. To describe the proposed self-starting monitoring scheme, let the monitoring be at t=1 and randomly generate pseudo-observations yi,t according to the
( )
ˆ 1( )
ˆ 1ˆt 1 exp t / exp t
p = + â x− â x− model for i=1,2,...,N,
where N is considered as a sufficiently large integer. Consider x as a vector of the explanatory variable in logistic regression model. Afterwards, a sample of charting statistics C(1)={C1(1),C2(1),...,CN(1)} can be achieved and then elements in C(1) be ranked in ascending order to redesign the vector C(1) as C[1](1),...,C[N](1). After that, h1(α) is calculated using C[H](1), in which H=[N(1−α)] and [] symbol refer to the rounding symbol. When C1>h1, control chart shows an out of control condition. Otherwise, the monitoring to the next time point t=2 is continued. In this regard, β̂t’s is updated based on new data. At time t=2, to obtain the control limit h2, we should
first restrict the values of Ci(1) such that satisfy Eq. (1). Then, a part of C(1),C[1](1),...,C[H](1) is kept, as the space of feasible values of C[i](1) and randomly bootstrap N variables of Ci(1) from this space are generated to construct an updated N−dimensional vector C(1). Similarly, the control limit h2 can be achieved by repeating the process of random number generation of Bernoulli random variables with mean equal to p̂t. The proposed approach based on a parametric bootstrap method is succinctly given as follows:
1) If Ct−1≤ht−1, estimate β̂t-1 based on the past response variables {(x1,y1),(x2,y2),...,(xt-1,yt-1)}.
2) Now, generate randomly yi,t from Bernoulli distribution with p̂t for i=1,...,N and then compute
C(t)={C1(t),...,CN(t)} and sort the elements of C(t) in ascending order. In addition, the control limit can be obtained equal to the value of C[H](t).
3) Decide on control chart condition by comparing the statistic Ct with ht and. When continuing to the next time point, update the C(t) by randomly selecting Ci(t)’s from C[1](t−1),...,C[H](t−1) and return to step 1.
Clearly, control limits are obtained on-line along with the process data rather than decided upon before monitoring. Not that if a short-run change occurs, starting testing with a very small set of observations would result in a severe masking-effect [28].
4- S
IMULATION
S
TUDY
In this section, we evaluate the performance of the Bernoulli risk-adjusted CUSUM chart with self-starting monitoring procedure and considering DPCLs for specific sequences of patients from different patient populations. Here, the data set of patients from a seven-year study used by Steiner et al. [8] is applied. Moreover, the same criteria in Tian et al. [32] are used to differentiate the Parsonnet score distributions. In this context, in the first two years, 2218 patients are considered as in-control group and utilized to fit the logistic regression risk model refereed to Zhang et al. [22] according to the Eq. (3):
and low risk are the highest and lowest 50% of the scores, respectively. In addition, the medium risk is considered as 50% of the scores from average range. For this purpose, the control limits estimated based on historical data are obtained in each simulation trial. Then, the average in control ARL is estimated defined as AARL0 using a large number of the simulation trials where for each trial there is a different amount of the historical data. Hence, the performance of interest is then investigated in terms of this criterion. The estimated AARL0 and the absolute relative error called as δ=|ARL0-AARL0|/ARL0 are shown in Table 1 for the proposed self-starting monitoring scheme.
The simulation results show that the proposed monitoring scheme has a suitable in control performance under a specific conditional false alarm rate. In other words, the value of the average in control ARLs obtained is approximately close to the predetermined ARL0 for all number of historical observations. It is worth mentioning that when the number of primary data is small, the proposed monitoring procedure can provide a satisfactory performance. As seen in the result, in these situations the AARL0 is close to desired value. on the other hand, performance of the proposed approach significantly improves when the reference sample would be large. Also, the different primary observation can be applied in the similar way to show varying estimates, control limits, and their corresponding in control ARLs.
Now, we survey the out of control performance of the proposed self-starting scheme. For this aim, type I
probability is considered equal to 0.005. To this end, we set m0=20 and assume R0 to be 1. We investigated the out of control performance under the different magnitude of shifts. In this respect, the different step shifts are imposed on the regression parameters of Bernoulli process separately and simultaneous in Table 2.
Generally, as the magnitude of the shift increases, the performance of the monitoring schemes improves significantly. As a result, the simulation studies show satisfactory performance of the self-monitoring scheme in risk-adjusted Bernoulli CUSUM control chart with DPCL.
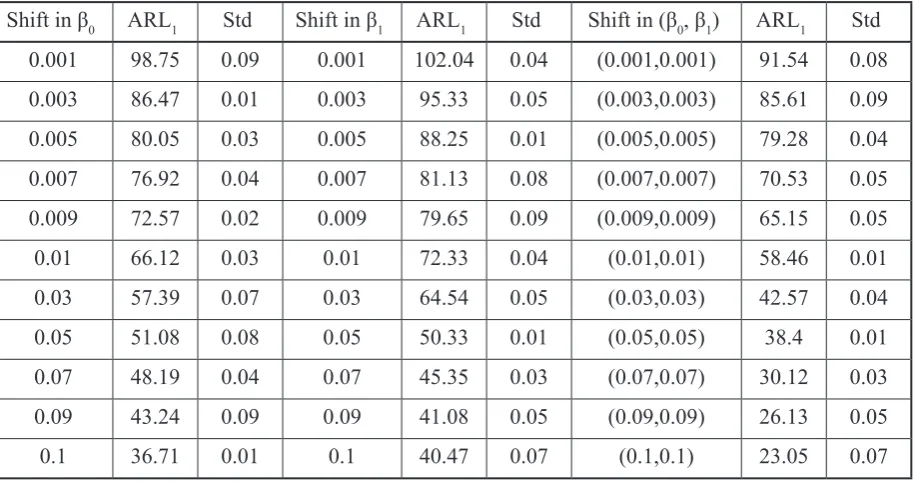
In Table 3, the simulation study is given to provide sufficient evidence to advantage of the proposed monitoring scheme in comparison with the previous scheme without a self-starting plan. To this aim, m0
is considered historical data in Phase I in monitoring without self-starting. Comparing the results between Tables 2 and 3, it can be understood easily risk-adjusted self-starting Bernoulli CUSUM control chart with DPCLs has a better performance than without considering self-starting monitoring scheme. Also, Fig. 1 demonstrates a difference between them under given shifts in discarding alarm more clearly.
5- C
ONCLUSION AND
F
UTURE
R
ESEARCHES
Recently, with the increasing importance of the quality of health care, performance monitoring of
Table 1. Estimated AARL0 of the proposed control monitoring scheme considering different m0
(within δ parentheses)
m0 Risk distribution
α
0.005 0.002 0.001
10
Low 184 (0.06) 462(0.03) 943(0.01)
Medium 189 (0.01) 465(0.01) 939(0.04)
High 194 (0.03) 471(0.08) 968 (0.03)
20
Low 188 (0.04) 465(0.05) 971(0.05)
Medium 191 (0.02) 482(0.09) 985(0.08)
High 187 (0.02) 459(0.07) 992(0.03)
50
Low 194 (0.07) 487 (0.05) 987(0.02)
Medium 185 (0.06) 475(0.02) 955(0.01)
Table 2. Estimated performance of self-starting monitoring risk-adjusted Bernoulli CUSUM charts with DPCLs
Shift in β0 ARL1 Std Shift in β1 ARL1 Std Shift in (β0, β1) ARL1 Std
0.001 51.11 0.05 0.001 53.15 0.04 (0.001,0.001) 48.08 0.03
0.003 49.77 0.08 0.003 46.87 0.05 (0.003,0.003) 47.01 0.08
0.005 42.65 0.04 0.005 40.05 0.01 (0.005,0.005) 40.14 0.04
0.007 38.09 0.04 0.007 39.4 0.08 (0.007,0.007) 36.12 0.04
0.009 33.75 0.01 0.009 32.99 0.09 (0.009,0.009) 30.15 0.01
0.01 30.87 0.03 0.01 31.02 0.05 (0.01,0.01) 30.22 0.03
0.03 23.08 0.09 0.03 22.11 0.01 (0.03,0.03) 21.18 0.09
0.05 17.22 0.07 0.05 18.09 0.02 (0.05,0.05) 15.15 0.01
0.07 12.93 0.04 0.07 14.12 0.07 (0.07,0.07) 10.05 0.03
0.09 9.15 0.01 0.09 8.97 0.04 (0.09,0.09) 6.6 0.05
0.1 6.45 0.03 0.1 5.96 0.01 (0.1,0.1) 5.05 0.07
care providers has received much concentration. In this scope, monitoring the quality of surgical outcome performance leads to the improved surgical performance. Regarding the monitoring of them, Bernoulli process is applied in which prior risks of different patient populations is considered. On the other hand, until now, most of studies are concerned with known assumption and estimable parameter, however, it is violated in practice. It is worth mentioning that the control limits typically are affected based on the estimation of parameters. Hence,
in this paper, a self-starting scheme is proposed based on a parametric bootstrap method and DPCLs for the risk-adjusted Bernoulli CUSUM. It is also known that all proposed control charts have a very good performance in which the number of primary data is insufficient.
Future research may be extended in the following directions. First of all, the presented approach can be applied in the other health-related process. In addition, proposed approach could be easily adapted to design the method of Tang et al. [14] where there can be
Table 3. Estimated performance of the risk-adjusted Bernoulli CUSUM charts with DPCLs
Shift in β0 ARL1 Std Shift in β1 ARL1 Std Shift in (β0, β1) ARL1 Std
0.001 98.75 0.09 0.001 102.04 0.04 (0.001,0.001) 91.54 0.08
0.003 86.47 0.01 0.003 95.33 0.05 (0.003,0.003) 85.61 0.09
0.005 80.05 0.03 0.005 88.25 0.01 (0.005,0.005) 79.28 0.04
0.007 76.92 0.04 0.007 81.13 0.08 (0.007,0.007) 70.53 0.05
0.009 72.57 0.02 0.009 79.65 0.09 (0.009,0.009) 65.15 0.05
0.01 66.12 0.03 0.01 72.33 0.04 (0.01,0.01) 58.46 0.01
0.03 57.39 0.07 0.03 64.54 0.05 (0.03,0.03) 42.57 0.04
0.05 51.08 0.08 0.05 50.33 0.01 (0.05,0.05) 38.4 0.01
0.07 48.19 0.04 0.07 45.35 0.03 (0.07,0.07) 30.12 0.03
0.09 43.24 0.09 0.09 41.08 0.05 (0.09,0.09) 26.13 0.05
Fig. 1. The comparison of the proposed and traditional monitoring scheme performances
more than two possible outcomes for each patient. On the other hand, the performance of all monitoring schemes is affected by the number of primary observations. Hence, the necessary number of Phase I data should be analyzed to provide the given in-control performance. Moreover, the bootstrap-based approach may be applied to design a generalized likelihood ratio test (GLRT)-based control chart.
R
EFERENCES
[1] Chou, S. C.; “Statistical Process Control for Health Care,” International Journal for Quality in
Health Care, Vol. 14, No. 5, pp. 427-428, 2002. [2] Tennant, R.; Mohammed, M. A.; Coleman, J. J. and Martin, U.; “Monitoring Patients Using Control Charts: A Systematic Review,” International Journal
for Quality in Health Care, Vol. 19, No. 4, pp. 187-194, 2007.
[3] Woodall, W. H.; Adams, B. M.; Benneyan, J. C.; “The Use of Control Charts in Healthcare,” Statistical Methods in Healthcare, Wiley, in Faltin, F.; Kenett, R.; Ruggeri, F. Eds., pp. 251-267, 2011.
[4] Lim, T. O.; “Statistical Process Control Tools for Monitoring Clinical Performance,” International
Journal for Quality in Health Care, Vol. 15, No. 1, pp. 3-4, 2003.
[5] Coory, M.; Duckett, S. and Sketcher-Baker, K.; “Using Control Charts to Monitor Quality of Hospital
Care with Administrative Data,” International
Journal for Quality in Health Care, Vol. 20, No. 1, pp. 31-39, 2008.
[6] Joner, M. D.; Woodall, W. H.; Reynolds, M. R.; “Detecting a Rate Increase Using a Bernoulli Scan Statistic,” Statistics in Medicine, Vol. 27, No. 14, pp. 2555-2575, 2008.
[7] De-Leval, M. R., François, K.; Bull, C.; Brawn, W. B. and Spiegelhalter, D.; “Analysis of a Cluster of Surgical Failures,” The Journal of Thoracic and Cardiovascular Surgery, Vol. 107, No. 3, pp. 914-924, 1994.
[8] Steiner, S. H.; Cook, R. and Farewell, V.; “Monitoring Paired Binary Surgical Outcomes Using Cumulative Sum Charts,” Statistics in Medicine, Vol. 18, No. 1, pp. 69-86, 1999.
[9] Shu, L.; Jiang, W.; Tsui, K. L.; “A Comparison of Weighted CUSUM Procedures that Account for Monotone Changes in Population Size,” Statistics in Medicine, Vol. 30, No. 7, pp. 725-741, 2011.
[10] Sun, R. J.; Kalbfleisch, J. D.; Schaubel, D. E.; “A Weighted Cumulative Sum (WCUSUM) to Monitor Medical Outcomes with Dependent Censoring,” Statistics in Medicine, Vol. 33, No. 18, pp. 3114-3129, 2014.
of CUSUM Technique in Monitoring Doctors’ Performance,” International Journal for Quality in
Health Care, Vol. 14, No. 3, pp. 251-258, 2002. [12] Steiner, S. H.; Cook, R. J.; Farewell, V. T. and Treasure, T.; “Monitoring Surgical Performance Using Risk-Adjusted Cumulative Sum Charts,” Biostatistics, Vol. 1, No. 4, pp. 441-452, 2000.
[13] Jones, M. A.; Steiner, S. H.; “Assessing the Effect of Estimation Error on Risk-Adjusted CUSUM Chart Performance,” International Journal for Quality in
Health Care, Vol. 24, No. 2, pp. 176-181, 2012. [14] Rossi, G.; Del-Sarto, S. and Marchi, M.; “A New Risk-Adjusted Bernoulli Cumulative Sum Chart for Monitoring Binary Health Data,” Statistical Methods in Medical Research, 2014.
[15] Taseli, J. C. and Benneyan, A.; “Cumulative Sum Charts for Heterogeneous Dichotomous Events,” Industrial Engineering Research Conference Proceedings, pp. 1754-1759, 2008.
[16] Gombay, E.; Hussein, A. and Steiner, S. H.; “Monitoring Binary Outcomes Using Risk-Adjusted Charts: a Comparative Study,” Statistics in Medicine, Vol. 30, No. 23, pp. 2815-2826, 2008.
[17] Zeng, L.; “Risk-Adjusted Performance Monitoring in Healthcare Quality Control,” Quality
and Reliability Management and Its Applications, Springer, London, pp. 27-45, 2016.
[18] Tang, X.; Gan, F. F. and Zhang, L.; “Risk-Adjusted Cumulative Sum Charting Procedure Based on Multiresponses,” Journal of the American Statistical Association, Vol. 110, No. 509, pp. 16-26, 2016.
[19] Cook, D. A.; Coory, M. and Webster, R. A.; “Exponentially Weighted Moving Average Charts to Compare Observed and Expected Values for Monitoring Risk-Adjusted Hospital Indicators,” BMJ
Quality and Safety, Vol. 20, No. 6, pp. 469–474, 2011. [20] Fang, Y. Y.; Khoo, M. B.; Teh, S. Y. and Xie, M.; “Monitoring of Time between Events with a Generalized Group Runs Control Chart,” Quality and
Reliability Engineering International, 2015.
[21] Pan, X. and Jarrett, J. E.; “The Multivariate EWMA Model and Health Care Monitoring,” International Journal of Economics and Management Sciences, 2014.
[22] Zhang, X. and Woodall, W. H.; “Dynamic
Probability Control Limits for Risk-Adjusted Bernoulli CUSUM Charts,” Statistics in Medicine, Vol. 34, No. 25, pp. 3336-3348, 2014.
[23] Shen, X.; Tsung, F.; Zou, C. and Jiang, W.; “Monitoring Poisson Count Data with Probability Control Limits When Sample Sizes are Time-Varying,” Naval Research Logistics, Vol. 60, No. 8, pp. 625-636, 2011.
[24] Paynabar, K.; Jin, J. and Yeh, A.; “Phase I Risk Adjusted Control Charts for Monitoring Surgical Performance with Considering Categorical Covariates,” Journal of Quality Technology, Vol. 44, No. 1, pp. 39-53, 2012.
[25] Asadayyoobi, N. and Niaki, S. T. A.; “Monitoring Patient Survival Times in Surgical Systems Using a Risk-Adjusted AFT Regression,” Quality Technology and Quantitative Management Chart, 2015 [Accepted].
[26] Mohammadian, F.; Niaki, S. T. A. and Amiri, A.; “Phase I Risk-Adjusted Geometric Control Charts to Monitor Health Care Systems,” Quality and
Reliability Engineering International, 2014.
[27] Hawkins, D. M.; “Self-Starting CUSUM Charts for Location and Scale,” The Statistican, Vol. 36, No. 1, pp. 299-315, 1987.
[28] Hawkins, D. M. and Maboudou-Tchao, E. M.; “Self-Starting Multivariate Exponentially Weighted Moving Average Control Charting,” Technometrics, Vol. 49, No. 1, pp. 199-209, 2007.
[29] Shen, X.; Tsui, K. L.; Woodall, W. H. and Zou, C.; “Self-Starting Monitoring Scheme for Poisson Count Data with Varying Population Sizes,” Technometrics, 2015 [Accepted].
[30] Szarka, J. L. and Woodall, W. H.; “A Review and Perspective on Surveillance of Bernoulli Processes,” Quality and Reliability Engineering International, Vol. 27, No. 6, pp. 735-752, 2007.
[31] Parsonnet, V.; Dean, D. and Berstein, A. D.; “A Method of Uniform Stratification of Risk for Evaluating the Results of Surgery in Acquired Adult Heart Disease,” Circulation, Vol. 79, No. 6, pp. 3-12, 1989.