Downloaded from
http://journals.tums.ac.ir/
on Wednesday, August 15, 2012
A Novel Dual Energy CT-Based Attenuation Correction Method
in PET/CT Systems: A Phantom Study
Behnoosh Teimourian1, 2, Mohammad Reza Ay2,3,4,
Mojtaba Shamsaei Zafarghandi1, Hossein Ghadiri2, 5
1
Faculty of Nuclear Engineering and Physics, Amir Kabir University of Technology, 2
Research Center for Science and Technology in Medicine,3Department of Medical Physics and Biomedical Engineering, 4Research Institute for Nuclear Medicine, Tehran University of
Medical Sciences, Tehran, Iran
5Department of Medical Physics, School of Medicine, Iran University of Medical Sciences,
Tehran, Iran
(Received 17 October 2009, Revised 22 November 2009, Accepted 24 November 2009)
ABSTRACT
In present PET/CT scanners, PET attenuation correction is performed by relying on theinformation given by CT scan. In the CT-based attenuation correction methods, dual-energy technique (DECT) is the most accurate approach, which has been limited due to the increasing patient dose. In this feasibility study, we have introduced a new method that can implement dual-energy technique with only a single energy CT scan. The implementation was done by CT scans of RANDO phantom at tube voltages of 80 kVP and 140 kVP. The
acquired data was used to obtain conversion curves (which scale CT numbers at different kVP to each other), in
three regions including lung tissue (HU<-100), soft tissue (-100<HU<200) and bone tissue (HU>200) for the combination of 80 kVP /140 kVP. Therefore, with having the CT image in one energy, we generate the CT image
at the second energy (from now we call it virtual dual-energy technique) using these kVP conversion curves. The
attenuation map at 511 keV was generated using bilinear (the most commonly used method in commercially available PET/CT scanners), real dual-energy and virtual dual-energy technique in a polyethylene phantom. In the phantom study, the created attenuation map using mentioned methods are compared to the theoretical values calculated using XCOM cross section library. The results in the phantom data show 10.1 %, 4.2 % and 4.3 % errors for bilinear, dual-energy and virtual dual-energy techniques respectively. Further evaluation using a larger patient data is underway to evaluate the potential of the technique in a clinical setting.
Key Words: PET/CT, Dual Energy CT, Attenuation Correction
Iran J Nucl Med 2009;17(2):42-49
Corresponding author: Dr Mohammad Reza Ay, Department of Medical Physics and Biomedical Engineering, Tehran University of Medical Sciences, Tehran, Iran.
E-mail: [email protected]
O
Downloaded from
http://journals.tums.ac.ir/
on Wednesday, August 15, 2012
Ir
an J Nuc
l Med
200
9
, Vo
l
17, No
2
(Se
rial No
32)
43
INTRODUCTIONHybrid positron emission tomography/x-ray computed tomography (PET/CT) units have been designed and been commercially available since 2000 (1). The primary purpose of combining CT and PET scanners is for the precise anatomical localization of regions identified on the PET tracer uptake images. In addition, the use of CT images for CT-based attenuation correction (CTAC) reduces the overall scanning time and improves the precision of the attenuation correction factors (2).
Several physical factors can degrade the image quality and quantitative analysis of PET: the most important is photon attenuation in tissues, which can affect both the visual interpretation and quantitative analysis of PET data (3). With the introduction of hybrid PET/CT systems into the clinical setting, precise conversion from linear attenuation coefficients (LAC) of the tissues at effective CT energies (~ 60-80
keV, depending to the kVp) to LAC at 511
keV , the energy of PET imaging, has become essential in order to apply accurate CTAC to the PET data. Several CTAC strategies have been developed, including scaling (4), segmentation (4), hybrid (segmentation and scaling) (4), bilinear (5), and dual-energy methods.
In the nominated methods, dual-energy technique (DECT) is most accurate one (6), but has been limited due to increasing patient dose resulting from two CT scans at two different kVPs. In this study we have introduced a new method that can implement dual-energy technique with only a single energy (kVP) CT imaging. In this method, by having the CT image in one kVP, we generate the CT image at the second kVP. It should be emphasized that the aim of this method is to implement dual energy method for generating accurate attenuation map at 511 keV from CT images. The methodology is still under validation and need more assessment in clinical setting.
METHODS
CTAC methods
All CTAC methods in PET/CT systems require accurate conversion (energy mapping) from CT numbers to LACs at 511 keV. Several of conventional energy mapping methods are used which include scaling, segmentation, hybrid (scaling/segmentation), bilinear and
dual-energy decomposition method.
In this study, we evaluated three methods to obtain 511 keV attenuation map (µmap): Bilinear which uses in the commercially available PET/CT scanner, DECT which is the most accurate method, and virtual DECT as the proposed low dose method.
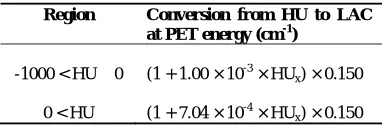
Bilinear: In this method, as discussed by Bai et al (5), CT numbers in the range of -1000 < HU ≤ 0 primarily represent regions that contain mixtures of air and water, whereas regions having CT numbers HU > 0 are those that contain mixtures of water and bone. The conversion from CT numbers at
140 kVP to LACs at PET energy for each
region is shown in table 1.
Table 1. The conversion from CT numbers at 140 kVP to LACs at PET energy for two regions.
Region Conversion from HU to LAC at PET energy (cm-1)
-1000 < HU ≤ 0 (1 + 1.00 × 10⁻³ × HUx) × 0.150
0 < HU (1 + 7.04 × 10⁻⁴ × HUx) × 0.150
DECT: In dual-energy method, attenuation correction is based on using two CT scans at different tube volatges but performed at the same time and patient position then uses these data to extract the individual photoelectric and Compton contributions in attenuation map as discussed by Guy et al (7).
Downloaded from
http://journals.tums.ac.ir/
on Wednesday, August 15, 2012
Ir
an J Nuc
l Med
200
9
, Vo
l
17, No
2
(Se
rial No
32)
44
attenuation coefficient (µtot) is the sum of the photoelectric (µpe) and Compton (µc) components.
[1]
The photoelectric component is given by:
[2]
Where , is a constant, is
the electron mass and is the photon energy.
The total Compton attenuation coefficient can be obtained using the Klein-Nishina formula, as shown in Equation [3]:
[3]
Where and is the classical
cross section. So, if the two incident photon
beams have the energies of , and ,,
with corresponding attenuation values of
and , the total linear attenuation
coefficient ( ) at the scaling energy, is given by:
[4]
Where , and:
Virtual DECT: In this proposed method, with having the CT image in one tube volate and generating the CT image at the second tube voltage, DECT technique is implemented using the real and virtual image, as described above.
Phantom Studies
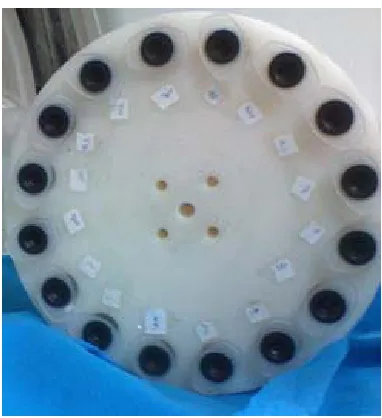
RANDO Phantom
The RANDO phantom (RANDO Alderson; Phantom Laboratory, Salem, NY, (8)) is an invaluable aid in radiotherapy treatment planning. There are two RANDO models: The RANDO woman and the RANDO man. The woman represents a 163cm tall and 54kg and the man represents a 175cm tall and 73.5kg (figure 1). Neither have arms or legs. Breast accessories are available for both models.
Figure 1. Photograph of RANDO phantom.
Like the sectional phantoms, the RANDO phantoms are constructed with a natural human skeleton cast inside material that is radiologically equivalent to soft tissue. The RANDO lungs are molded to fit the contours of the natural human rib cage. The lower-density material in the RANDO lungs is designed to simulate human lungs in a median respiratory state.
Downloaded from
http://journals.tums.ac.ir/
on Wednesday, August 15, 2012
Ir
an J Nuc
l Med
200
9
, Vo
l
17, No
2
(Se
rial No
32)
45
Figure 2. The whole body coronal CT images of RANDO phantom at 80 kVP (right) and 140 kVP
(left).
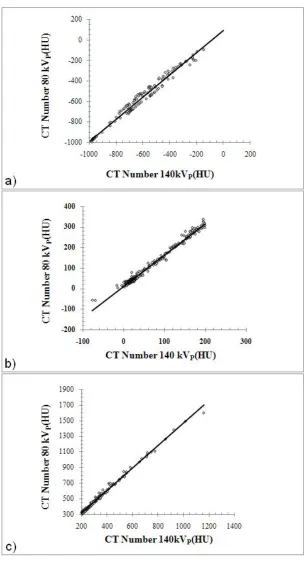
The analysis on the acquired images was done by AMIDE (9) image viewer. More than 200 different ROIs were selected in each image and the mean CT numbers for each ROI at one kVP was plotted versus the same values at another kVP. Finally the best curve was fitted for each plot to obtain kVP Conversion Curves (which scale CT numbers at different tube voltages to each other), in three regions including lung tissue (HU ≤ -100), soft tissue (-100 < HU < 200)
and bone tissue (HU ≥ 200). This
classification improves the precision of the resulted kVP conversion curves.
The kVP Conversion curves have been
obtained for the combination of 80 kVP /140 kVP . It should be noted that in dual energy method, the accuracy of estimating attenuation map at 511 keV is directly related to the difference of the pair energies used in each combination (8). The calculated
kVP Conversion Curves can be used for
generation of virtual CT image in other kVPs. Having the CT image of a patient in one energy and generating the second image
in another energy, we are now able to implement the dual energy technique which is called the virtual dual-energy method.
Polyethylene Phantom
A polyethylene cylindrical phantom (250±0.5 mm diameter) was constructed. This phantom consisted of 16 cylindrical holes (20±0.5 mm diameter) with four holes in the middle (5±0.5 mm diameter) filled with air. One of the 16 holes was filled with water and the rest with various concentrations of K2HPO4 solution varying from 60 mg/cc to 1800 mg/cc (LAC ranging from 0.1 to 0.2 cm-1 at 511 keV) to simulate different biological tissues (figure 3).
Figure 3. Photograph of Polyethylene phantom.
This phantom was scanned on the LightSpeed VCT scanner at two different
tube voltages of 80 and 140 kVP and tube
current of 400 mA with 1 sec rotation speed. The acquired data was used to generate
μmaps using the three mentioned CTAC
methods: The acquired CT image at 140 kVP
Downloaded from
http://journals.tums.ac.ir/
on Wednesday, August 15, 2012
Ir
an J Nuc
l Med
200
9
, Vo
l
17, No
2
(Se
rial No
32)
46
kVP were used to implement DECT
technique.
In the proposed method, by using the kVP
Conversion Curves, which have been obtained from the CT images of RANDO
phantom, phantom image at 80 kVP was
derived from 140 kVP. Then attenuation
map at PET energy was generated using the
CT images at 80 kVP (which was derived
from 140 kVP) and 140 kVP . This is the virtual DECT method. As the noise of the CT image is lower in higher kVPs, CT image at 80 kVP was derived from 140 kVPs. The theoretical LAC at 511 keV for each concentration of the K2HPO4 solution was computed using the XCOM photon cross section library (10), and considered as gold standard.
Generation of µmap and Assessment Strategy
The reconstructed CT images (512×512 matrix size) were at first down-sampled to 128×128 and then smoothed using a 5-mm Gaussian kernel to match the resolution of the PET images. Then bilinear, dual-energy and virtual dual-energy methods were used to convert CT image to an attenuation map (μmap) at 511 keV.
A ROI-based quantitative analysis was performed on phantom data for the assessment of the accuracy of different energy mapping strategies. Several ROIs
were defined on regions of the μmap
corresponding to different concentrations of the K2HPO4 solutions and the mean LAC was computed. The result was then compared to the theoretical LAC estimated using the XCOM photon cross section library (10).
RESULTS AND DISCUSSION
RANDO Phantom
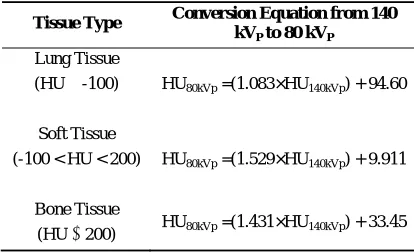
The kVP conversion curves, which obtained from CT scans of RANDO phantom at tube voltages 80 and 140 kVP, for different tissue types including lung tissue, soft tissue, and
bone tissue are shown in figure 4. Table 2 presents the conversion equations, that
convert the CT images at 140 kVP to CT
images at 80 kVP , for mentioned tissue
types. These conversion equations are used
to generate the CT images at 80 kVP from
the acquired CT images at 140 kVP using the MATLAB.
Table 2. The conversion equations that convert the CT images at 140 kVP to CT images at 80 kVP for
different tissue types.
Tissue Type Conversion Equation from 140 kVP to 80 kVP
Lung Tissue
(HU ≤ -100) HU80kVp =(1.083×HU140kVp) + 94.60
Soft Tissue
(-100 < HU < 200) HU80kVp =(1.529×HU140kVp) + 9.911
Bone Tissue
(HU ≥ 200) HU80kVp =(1.431×HU140kVp) + 33.45
Polyethylene Phantom
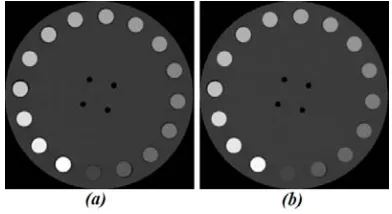
Figure 5 shows two CT images at 80 kVP.
One is the original CT image and the other one is the generated CT image from 140 kVP using the kVP conversion equations.
The original CT image at 140 kVP and
μmaps of the phantom generated using
Downloaded from
http://journals.tums.ac.ir/
on Wednesday, August 15, 2012
Ir
an J Nuc
l Med
200
9
, Vo
l
17, No
2
(Se
rial No
32)
47
Figure 4. The dots (symbol ) show the mean CT numbers of each ROI at 80 kVP versus the corresponding
values at 140 kVP. The solid line is the fitted curve to the dot plots in different tissue types including a) soft
Downloaded from
http://journals.tums.ac.ir/
on Wednesday, August 15, 2012
Ir
an J Nuc
l Med
200
9
, Vo
l
17, No
2
(Se
rial No
32)
48
Figure 5. The CT images at 80 kVP , a) Original CT
image, b) Generated CT image from CT 140 kVP
(virtual image).
Figure 6. (a) Original CT image at 140 kVP (b)
generated attenuation maps at 511 keV using bilinear (c), dual energy (80 and 140 kVPs) (d) and virtual
dual-energy.
Figure 7 shows difference images obtained by subtracting generated µmap images using the bilinear and virtual DECT techniques and the reference image. The obtained µmap image using DECT method has been considered as reference image.
Table 3. Comparison of calculated LACs at 511 keV using different CTAC method and the theoretical values computed using the XCOM photon cross section library for different regions within the phantom.
C † (mgr/cc)
LAC at 511 keV (PRD* )
XCOM Bilinear DECT Virtual DECT
Water 0.096 0.096 (0.0) 0.097 (1.0) 0.097 (1.0)
120 0.102 0.107 (4.9) 0.105 (2.9) 0.104 (2.0)
180 0.106 0.113 (6.6) 0.105 (0.9) 0.108 (1.9)
240 0.109 0.121 (11.0) 0.113 (3.7) 0.115 (5.5)
300 0.112 0.126 (12.5) 0.117 (4.5) 0.117 (4.5)
360 0.116 0.131 (12.9) 0.121 (4.3) 0.121 (4.3)
480 0.123 0.140 (13.8) 0.128 (4.1) 0.129 (4.9)
540 0.126 0.144 (14.3) 0.130 (3.2) 0.131 (4.0)
600 0.129 0.148 (14.2) 0.133 (3.1) 0.134 (3.9)
660 0.133 0.153 (15.0) 0.136 (2.3) 0.139 (4.5)
720 0.136 0.157 (15.4) 0.139 (2.2) 0.141 (3.7)
840 0.143 0.163 (14.0) 0.143 (0.0) 0.147 (2.8)
900 0.147 0.166 (12.9) 0.145 (1.4) 0.148 (0.7)
1200 0.164 0.180 (12.9) 0.154 (6.1) 0.158 (3.7)
1500 0.181 0.188 (3.9) 0.159 (12.1) 0.165 (8.8)
1800 0.199 0.198 (0.5) 0.168 (15.6) 0.174 (12.6)
†Concentration of K2HPO4 in solution
*
Percentage Relative Difference (%)
Downloaded from
http://journals.tums.ac.ir/
on Wednesday, August 15, 2012
Ir
an J Nuc
l Med
200
9
, Vo
l
17, No
2
(Se
rial No
32)
49
CONCLUSIONAmong different CTAC methods of PET data, the bilinear method is the common used method in most commercial PET/CT scanners. This method has an acceptable accuracy in lung and soft tissue, but overestimates in bone tissue. Also, the dual-energy method has a good estimation of attenuation coefficients at 511 keV for all tissues, but the use is limited because of its high dose. In this feasibility study we have introduced a new method that can implement dual-energy technique with only a single energy (kVP) CT imaging.
As shown in table 3, that dual-energy and virtual dual-energy have the low errors in obtaining LACs at 511 keV (4.2 % and 4.3 % respectively).
In this feasibility study, we presented the results showing the virtual dual-energy approach has not only the same performance as dual energy technique but has additional potential advantages of a lower patient dose. Further evaluation using a clinical PET/CT database is underway to evaluate the potential of the technique in a clinical setting.
ACKNOWLEDGEMENTS
This work has been supported by the Research Center for Science and Technology in Medicine, Tehran University of Medical Sciences.
REFERENCES
1. Townsend DW, Beyer T, Blodgett TM. PET/CT scanners: a hardware approach to image fusion. Semin Nucl Med. 2003;33(3):193-204.
2. Beyer T, Townsend DW, Brun T, Kinahan PE, Charron M, Roddy R et al. A combined PET/CT scanner for clinical oncology. J Nucl Med. 2000;41(8):1369-1379.
3. Zaidi H, Hasegawa B. Determination of the attenuation map in emission tomography. J Nucl Med. 2003;44(2):291-315.
4. Kinahan PE, Townsend DW, Beyer T, Sashin D. Attenuation correction for a combined 3D PET/CT scanner. Med Phys. 1998;25(10):2046-2053.
5. Bai C, Shao L, Da Silva AJ, Zhao Z. A generalized model for the conversion from CT numbers to linear attenuation coefficients. IEEE Trans Nucl Sci. 2003;50(5):1510-1515.
6. Shirmohammad M, Ay MR, Sarkar S, Rahmim A, Zaidi H. Comparative assessment of different energy mapping methods for generation of 511-keV attenuation map from CT images in PET/CT systems: A phantom study. Proceedings of the 4th European Conference of the International Federation for Medical and Biological Engineering, 2008 Nov 23-27; Antwerp, Belgium.
7. Guy MJ, Castellano-Smith IA, Flower MA, Flux GD, Ott RJ, Visvikis D. DETECT-Dual energy transmission estimation CT-for improved attenuation correction in SPECT and PET. IEEE Trans Nucl Sci. 1998;45:1261-1267.
8. RANDO phantom website. URL: http://www.rsdphantoms.com
9. AMIDE image viewer software. URL: http://amide.sourceforge.net
10. Berger MJ, Hubbell JH, Seltzer SM, Chang J, Coursey JS, Sukumar R et al. XCOM:photon cross sections database. NBSIR 87-3597. URL: