0 INTRODUCTION
Threaded connection is a popular joining method in modern industries making up nearly 70% of all mechanical connections in industries worldwide[1]. The preload in threaded connections is an important factor affecting the joint performance and reliability. Improper preload can degrade the behavior and life span of the joint and lead to joint problems, such as material failure, fastener loosening, joint separation, leakage, rattle, and fatigue failure [2] to [4]. It has been reported that up to 90% of bolted joint failures are caused by incorrect initial bolt tightening [5]. In the assembly of miniature precision equipment, performance degradation can be attributed to non-uniform stress, which is caused by the scatter of bolts preload. Thus, it is important to achieve an accurate preload during the assembly process for a specific bolt joint [6].
Several methods have been developed to control the preload of a bolt joint, for example, torque control tightening method, angle control tightening method, tension indicating method, ultrasonic method etc. Among these methods, the most common way of tightening a bolt or a nut is the torque control method where the preload is predicted according to the torque-preload relationship. However, the torque-preload relationship is highly sensitive to the friction properties which may cause large scatter to about ±50% of the preload [7]. Even the most precise torque measurement can rarely predict the resulting bolt preload in a reliable way. The method of angle control tightening is supposed to be applicable to both sophisticated assembly tools and simple torque wrenches, the torque required to reach the yield point of bolt is very uncertain due to variations in geometry, bolt strength, and friction. However,
applying a specific angle after an initial torque leads to more consistent preload levels. Tightening over the yield point results in the preload less affected by friction than in the case of elastic tightening. The yield characteristic of bolt determines the preload and its scatter, which is often less than ±10%. Nevertheless, since the rotation angle in the elastic region is small, there is a risk of over-tightening the miniature bolts [8]. The tension indicating method includes the use of tension indicating devices to measure the preload indirectly, such as the load indicating washers. An obvious disadvantage of this method is poor precision, which is due to the bolt preload being estimated by measuring the gap between the bolt head and the washer. The ultrasonic method is used in industries where the bolted joints are critical. The method can successfully measure the bolts with large diameters under favorable conditions. However, when the bolts are smaller, environmental disturbances or even the operator induced error may exceed the instrument resolution [9] to [11].
Recently, some new tightening control methods have been developed to increase the preload accuracy. New approaches using shape memory alloy (SMA) [12] to [13] or electronic speckle pattern interferometry (ESPI) technique [14] have been applied to the monitoring of the preload. However, the former is costly and the latter demands very stringent environmental stability and hence cannot be employed in a manufacturing environment [15]. Optical digital imaging correlation (DIC) method [16] was proposed to measure compressive strain in a washer, and the bolt preload is subsequently determined from the measured strain. The strain measurement is limited to only one angular location on the washer, thus it is not suitable for small washers in miniature bolt joints. The digital speckle pattern interferometry
An Improved Torque Method for Preload Control in Precision
Assembly of Miniature Bolt Joints
Zhang, X. – Wang, X. – Luo, Y.
Xiwen Zhang – Xiaodong Wang* – Yi Luo
Key Laboratory for Micro/Nano Technology and System of Liaoning Province, Dalian University of Technology, China
In this work, the improved torque method based on a mathematical model is proposed for preload control in the precision assembly of miniature bolt joints. The mathematical model was used for predicting the friction-compensated control torque. The predicted control torque is a function of preload and torque gradient which is determined by the friction of contact surfaces. Thus, the effect of friction on preload error was reduced, and the bolts preload scatter due to frictional variables of the bolts was decreased. Experiments were carried out to verify the proposed method using the bolts with a thread of M1.6, and the results show that the scatters of preload were less than ±13.0% in the elastic range, which is more consistent than the conventional torque method. The preload control error for most bolts was less than 10%.
(DSPI) system [17] was developed to measure and monitor the out-of-plane deformation on the surface of clamped joints in real-time. In the study, M1.5 miniature bolt joint applications were investigated, yet the control accuracy of bolt preload was not evaluated since load cells and strain-gauged bolts were not suitable for miniature bolts. As a final summary, most of the existing tightening methods are limited in the precise control of tightening miniature bolt joints. It is particularly challenging to find an effective tightening control method for miniature bolt joints due to their small size and low preload level.
In this paper, the improved torque method based on the mathematical model for preload precise control is proposed, and the effects of the friction under the head and in the threads were compensated in the model. The proposed method does not require any special equipment and is not restricted by the space, thus it is suitable for precision assembly of a miniature bolt joint. An introduction to the application of the improved method in M1.6 bolt tightening experiments is presented in detail. The effectiveness of the proposed model is demonstrated by the experiments.
1 PRINCIPLE FOR THE IMPROVED TORQUE METHOD
1.1 Theoretical Model
One of the major problems with the use of bolt joints is the accuracy of preload. With the conventional torque control method, the control torque for the target preload is determined by the torque-preload relationship. The tightening torque has a significant dependence on the friction at contact surfaces and the majority of the torque is used to overcome friction (usually between 85 and 95% of the applied torque), so small variation in the frictional conditions can lead to large changes in the bolt preload [18]. However, if the effects of friction for a certain bolt are compensated, the preload scatter for these bolts will be decreased, and the tolerance of the bolt for critical application can be lowered.
When tightening bolt joints, as the nut rotation, part of the torque and preload is applied to close the gaps, and this situation is referred to as ‘snug torque’. Then, the torque Tfand the preload Ff both increase in
proportion to the nut rotation angle θ, the relationship between Tf /Ffand θ are linear and the gradient of Tf / Ff is almost constant. At last, the preload Ff stretching
the bolt over its yield point until the bolt fails and the relationship between Tf /Ff and θ are nonlinear. In the
elastic range, the equation relating preload Ff and nut
rotation angle θ is expressed as follows [19]:
Ff = P Cθ s = P tCs
π ω
π
2 2 , (1)
where P is the thread pitch, ω and t are the rotation speed of nut and rotation time of nut, respectively. Cs
is the system spring constant or system stiffness of bolt joint in the elastic range.
In the tightening procedure of the bolt joints, the relationship between the applied torque Tf on nut (or
bolt head) and bolt preload Ff can be expressed as
[20]:
T F d d d
d d f = f
(
+)
+ n n 2
2 tan ρ β 2 µ . (2)
In Eq. (2), d2 and d are basic pitch diameter of the thread and nominal thread diameter, ρ and β are friction angles relating to friction coefficients and lead angle of threads, dn and μn represent the equivalent
friction diameter and coefficient of friction at the bearing surface of nut, respectively. Usually, Eq. (2) is denoted by a simple form using torque coefficient K.
Tf =F dKf . (3) Taking the derivative of Tfand Ff with respect to
nut rotation time t, the gradient of Tf and Ff can be
expressed as: dT dt dF dK dt dK dF dt K
f f f
t
= = = . (4)
dF dt
d dt
P C dC dt f s S S P tC = = + ω π ω π 2
2 . (5)
Combining Eqs. (4) and (5), the torque coefficient K is deduced from the torque gradient Ktusing the
following relation:
K K
Pd C dC dt t S S = + 2π
ω . (6)
Substituting for torque coefficient K from Eq (6) into Eq (3) yields:
T F dK K F
P C dC dt
f f t f
S S = = + 2π
ω . (7)
.
The system stiffness Cs in the elastic range is
constant, which is mean dC
dtS =0, thus the Eq. (7) can
T F dK K P C F
f f t
S f
= = 2π
ω . (8)
From Eq. (8), the torque gradient Kt, system
stiffness Cs and rotation speed ω are incorporated
into the improved model for predicting the tightening torque Tf at target preload Ff. As shown in Eq. (6), the
torque gradient Ktis linear related to torque coefficient K which is strongly affected by surface roughness and lubrication, so the control torque can be predicted by the model according to friction in the assembly processes of different bolts.
1.2 Model Parameters
There are four specific parameters P, ω, Kt and Cs appearing in Eq. (8) related to the model in the
tightening process. Among these parameters, the parameters Kt and Cs are determined by the bolt joint
properties and friction coefficient, respectively. Hence it is critical to estimate the parameters Kt and Cs
during bolt joint assembly.
1.2.1 Torque Gradient Kt
In the linear elastic range, the torque Tf is linear
related to the rotation time t, the torque gradient Kt is theoretically a constant. However, the torque
fluctuation caused by the micro burrs or defects is inevitable, thus it is difficult to obtain the constant of Kt through directly taking the derivative of torque Tf with respect to nut rotation time t, as a result, it
is difficult to determine if the bolt reaches the linear elastic range. In order to solve this problem, the smoothing filter and least squares linear fit method were employed. The torque Tf(i) at a specific time t(i) is obtained from the sensor data using the smoothing filter. Then the torque gradient Kt(i) at the time t(i) can be obtained by linearly fitting the torque data using linear least square fitting method. If the torque gradient between Kt(i-n) and Kt(i) remains stable around a constant, it is indicated that the bolt reach the linear elastic range, the average torque gradient Kt′ between t(i-n) and t(i) is considered as the torque gradient Kt
during the linear increasing stage of torque.
1.2.2 System Stiffness Cs
The torsional stiffness is independent of axial force Ff,
while the stiffness in the axial direction has a dominant effect on the relationship between Ff and Tf, therefore
only the stiffness in the axial direction is taken into
account in this paper. In the elastic range, the bolt joint is modeled as a set of linear springs together with a mass-less box, as shown in Fig. 1. The mass-less box has the function of providing displacement that is required in the actual system. Since the bolt joint model shows a linear behavior, the system stiffness Cs
can be calculated using the following relations:
Fig. 1. Stiffness model of bolt joint
C
K K
s
c i b
= +
∑
11 ( ). (9)
Kc(i) and Kb are stiffness of the clamped parts
and bolt, respectively. Kc(i) and Kb are considered to
be constant. The stiffness of clamped parts Kc(i) is unknown, thus experiments for measuring the stiffness are needed.
Bickford [21] provides the expression of the bolt stiffness for various bolt types and materials as described in Eq. (10):
1 K
L EA
L EA b
be
B s
= + se , (10)
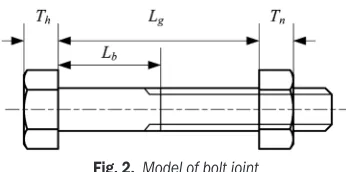
where, Lbe = Lb + 0.5 × Th, Lse = Lg – Lb + 0.5 × Tn,
and As = 0.7854 × (D – 0.938 P)2.
As shown in Fig. 2. Lbe is the effective length of
the bolts, and Lse is the effective length of the threads. Th is the height of the bolt head and Tn is the height of
the nut. Lb is the length of the unthreaded part of the
bolt and Lg is the total gap between the bolt head and
the nut. AB is the nominal cross sectional area, equal to
the cross-sectional area based on the nominal diameter D. As is the effective stress area of the threads. E is the
Young’s Modulus.
2 EXPERIMENTS
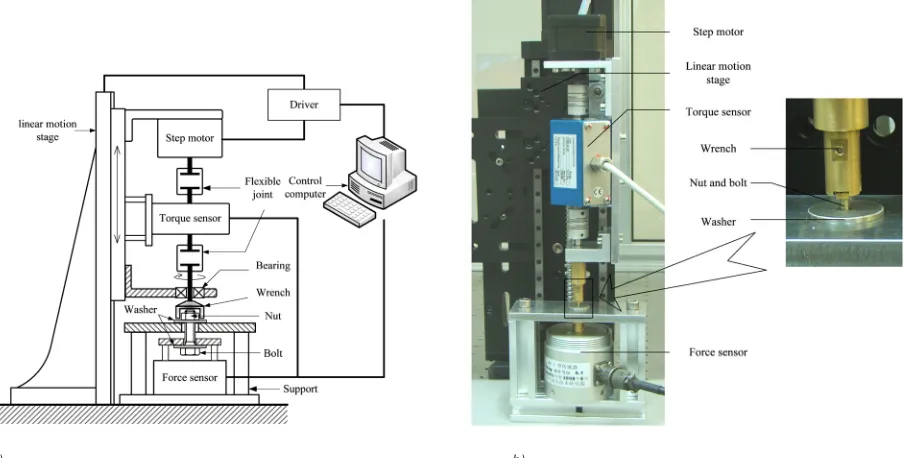
2.1 Experimental Setup
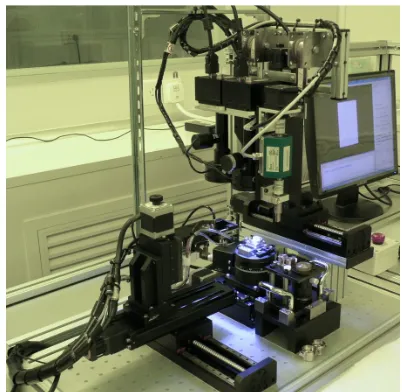
The schematic diagram of the experimental system is shown in Fig. 3a. The system is used for automatic assembly of the miniature bolts with the diameter less than 2.5 mm, which is widely employed in the precision miniature equipments. A torque sensor (Lorenz Messtechnik 0180, Germany) and a force sensor (CAAA BK-3A, China) were employed for an evaluation of the torque and preload during the bolt tightening. The resolution of the torque sensor is 0.01 Nmm with the accuracy of ±0.1% in the max range (range: ±200 Nmm), and the range of the force sensor is 200 N, with the resolution of 0.2 N and a maximum gain error of 0.1%. The torque loading is carried out with a step motor (SYNTRON 42BYG, China), which has the capacity of 230 Nmm. The rotary motion of the step motor is transmitted to a wrench through the torque sensor and flexible joints. The nut is tightened by the wrench, and as the wrench rotates, the linear motion stage drives the wrench to synchronous linear feed along the bolt, so there is no relative motion between the nut and wrench, and the effect of friction between the nut and the wrench is eliminated. The bolt head was fixed on the force sensor and sensor support, the rotation between bolt head and force sensor was restricted. Two washers were placed under the bolt head and the nut, respectively. The experimental setup
used to investigate the improved torque method is shown in Fig. 3b.
In this study, a program has been developed in LabVIEW to calculate the torque gradient Kt in real
time. When the constant torque gradient is determined, it is indicated that the bolt reached its linear elastic range, and then the friction-compensated control torque for target preload is predicted.
Bolt tightening experiments were performed using M1.6 bolts as the example. The property class of the bolts is 4.8, the geometric and material properties for the bolts are provided in Table 1. In the experiments, twenty-four bolts were divided into three groups for the target preload of 90, 120 and 150 N, respectively. The target preloads were selected to make sure that the bolts were in the elastic range, in which the relationship between the preload and nut rotation angle is linear. The maximum preload level is about 43% of the proof load of the bolts. In the tightening procedure, the bolts were tightened at fixed nut rotation speed of 5 rpm, which was selected based on preliminary tests. The total time to assembly a miniature bolt joint under the rotation speed was less than 20 seconds. The lower speed in tightening leads to low efficiency, but with a higher speed in tightening, the effect of hysteresis is not negligible, and the step motor is not able to stop at the prescribed target torque value. The experiments using the torque method were also carried out, providing a comparison with the proposed improved torque method. Another
a) b)
twenty-four bolts were divided into three groups for the experiments at target torque of 25, 35 and 45 Nmm, respectively.
Table 1. Geometrical and Material Properties of a M1.6 class 4.8 bolt
Geometrical parameters Material properties
Major Diameter [mm] 1.58 Material low carbon steel Minor diameter [mm] 1.20 Proof Load [MPa] 310 Pitch [mm] 0.35 Yield Strength [MPa] 340 Length [mm] 8.00 Tensile strength [MPa] 420
2.2 Model Parameters in Experiment
2.2.1 Stiffness of Bolt Joint
In this paper, the stiffness of the bolt is calculated using Eq. (10), and the composited stiffness of the clamped
parts 1/∑(1/Kc(i)) is determined experimentally by
compressing the clamped parts and measuring the corresponding deformation. The clamped parts include washers, preload sensor and the support. Fig. 4 shows the calibration curve of deformation under a different load during the loading of clamped parts. The deformation is linearly related to force with a linearly
dependent coefficient of 1/∑(1/Kc(i)) = 1.088 N/μm.
Fig. 4. Deformation versus force of clamped parts
2.2.2 Torque Gradient
The torque gradient Kt is determined by the friction on
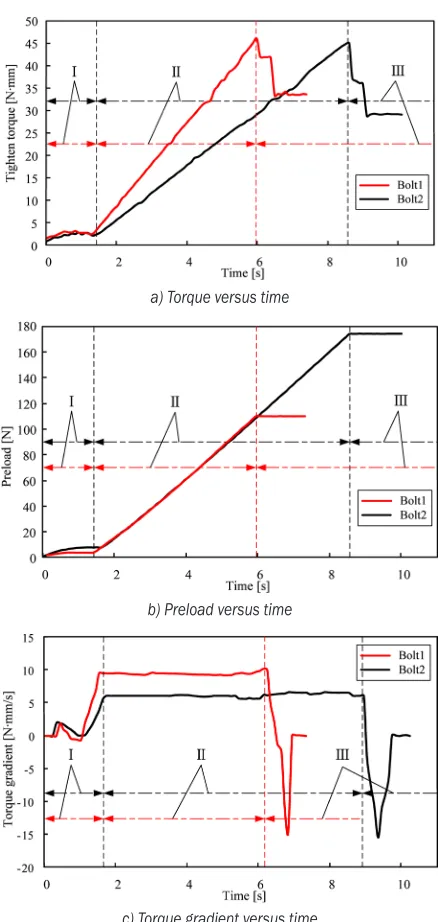
contact faces, and is not calculated from the tightening torque in real time. As an example, Fig. 5 shows the curves obtained from the two bolts tightening experiments using torque method. The curves of torque changed with the time t are shown in the Fig. 5a and the curves of preload changed with the time t as is shown in the Fig. 5b. The trend of torque gradients
Kt(i) changed with the time t for miniature bolts were plotted in Fig. 5c.The target torque values were both 45 Nmm and the nut rotation speeds were 5 rpm. For bolt 1 and bolt 2, the preloads were 106.6 and 169.2 N, and the torque gradients were 9.43 and 6.04 Nmm/s, respectively. With the improved torque method, if the target preloads are both 150 N, the predicted torques calculated according to Eq. (8) should be 60.8 and 38.9 Nmm, respectively.
a) Torque versus time
b) Preload versus time
c) Torque gradient versus time Fig. 5. Experimental curves for tightening tests
As shown in Fig. 5, three stages can be defined. In the second stage, the Tf (t) and Ff (t)curves were linear,
As shown in Fig. 5a, the slopes of the Tf (t) curves
were significantly different at the same target torque, and the corresponding Ff (t) curves have almost the
same slopes and significantly different preload values. These phenomena can be explained by Eqs. (6) and (7), the friction differences led to different preloads and a different slope of the Tf (t) curves. Moreover,
almost the same slope of the Ff (t) linear curves means
that the system stiffness of two bolt joints were both constant values and the stiffness difference was negligible.
A comparison of Fig. 5c with 5a, shows that torque gradients Kt(i) have a hysteresis less than 0.5 s to torques Tf, which is mainly caused by the time
consumed in calculating and smoothing. The results indicate that as soon as the torque Tf was linearly
related to time t, it is reliable for the proposed method to evaluate the torque gradient Kt.
3 RESULTS AND DISCUSSION
3.1 Preload Scatters of Improved Torque Method and Torque Method
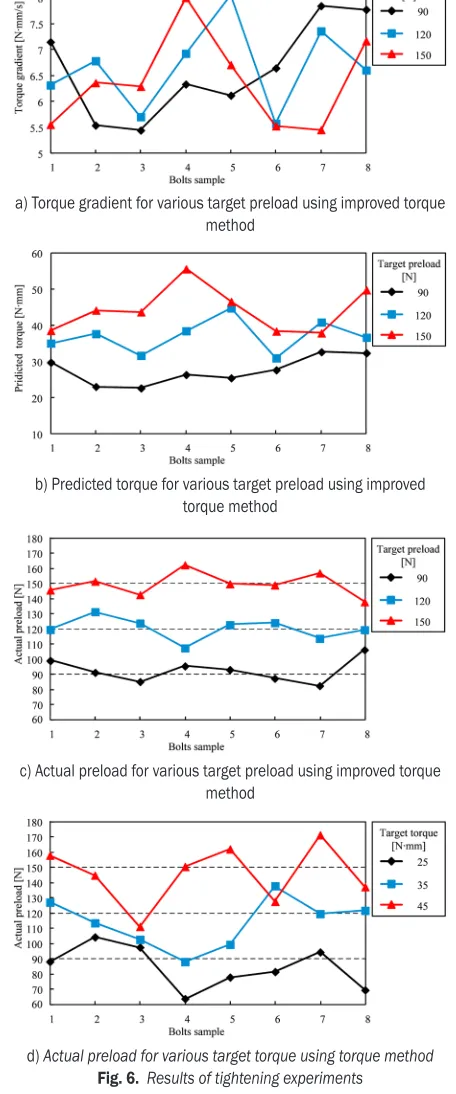
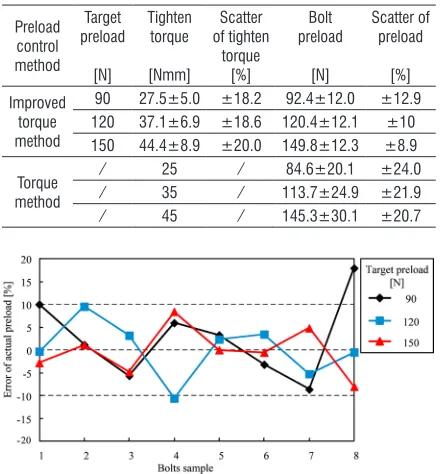
Fig. 6a shows the torque gradient results of every bolt during the tightening process. It is observed that the torque gradients at the target torque values of 90, 120 and 150 N range from 5.45 to 8.06 Nmm/s. Fig. 6b and c show the predicted torque results and corresponding bolt preload results, respectively. The experimental results show that the scatters of torque gradients and predicted torques have a similar trend. The predicted torques in the tightening process were 27.5±5.0, 37.1±6.9 and 44.4±8.9 Nmm, with an estimation scatters around the mean value of ±18.2, ±18.6 and ±20.0% for target preloads of 90, 120 and 150 N, respectively. As a result, the bolt preloads reached at the predicted torques value were 92.4±12.0, 120.4±12.1 and 149.8±12.3 N, with the scatters around the mean value of ±12.9, ±10.0 and ±8.9%, respectively. It is obvious that the scatters of predicted torques were larger than actual bolt preloads. Furthermore, as the target preloads increase, the distributions of actual preloads increase slightly, while the scatter around the mean value of actual preload decrease significantly. The results demonstrate that the proposed improved torque method for preload precise control is reliable. For precision assembly of miniature bolt joints, it is feasible to predict the tightening torque in the elastic range using the proposed model. Furthermore, it validates that the higher the target preloads, the smaller the scatters around the mean value of bolts preload would be.
a) Torque gradient for various target preload using improved torque method
b) Predicted torque for various target preload using improved torque method
c) Actual preload for various target preload using improved torque method
d) Actual preload for various target torque using torque method Fig. 6. Results of tightening experiments
target torques were 25, 35 and 45 Nmm, respectively. It is clear that as the target torques increase, the distribution of the preloads increases significantly, while the scatters around the mean value of actual preload decrease.
3.2 The Improvements of the Improved Torque Method
Table 2 shows the results of the comparison between the improved torque method and torque method. In contrast with the torque method, the improved torque method yields both smaller distribution of the preloads and smaller scatter around the mean value of bolts preload. The scatters around the mean value of bolts preload at the same level were decreased by at least 40.2% for which the reason may be that the effects of friction were compensated in the proposed improved mathematical model. Moreover, it is noticeable that in Fig. 7, the actual preload errors of most bolts were less than ±10.0%, and the maximum preload error in the experiments was 18.0%, with the actual preload and the target preload was 106.2 and 90 N, respectively. As the target preloads increase, the percentage errors of actual preload decrease significantly.
Table 2. Comparison between improved torque method and torque method
Preload control method
Target preload
[N]
Tighten torque
[Nmm]
Scatter of tighten
torque [%]
Bolt preload
[N]
Scatter of preload
[%] Improved
torque method
90 27.5±5.0 ±18.2 92.4±12.0 ±12.9 120 37.1±6.9 ±18.6 120.4±12.1 ±10 150 44.4±8.9 ±20.0 149.8±12.3 ±8.9
Torque method
∕ 25 ∕ 84.6±20.1 ±24.0
∕ 35 ∕ 113.7±24.9 ±21.9
∕ 45 ∕ 145.3±30.1 ±20.7
Fig. 7. Percentage error of actual preload versus target preload
The preload errors observed in the experiment results can be explained by the effect of bolts stiffness error between the actual and theoretical value which is calculated by Eq. (10). It has been shown that
both friction coefficients and system stiffness play a significant role in determining the torque-preload relationship in accordance with Eq. (8). The effects of the friction were compensated in the experiments, yet the bolt dimensional tolerances which caused stiffness error of bolts were neglected. Another reason for the preload error was the accuracy of the torque gradient during the tightening process. The prediction accuracy was also affected by the calculation error, the micro burrs and defects of bolt threads.
The experimental results indicated that the proposed improved torque method is highly practical to realize a real-time control of preload; the method will result in a more controlled tightening of a miniature bolt joint.
3.3 Application of the Improved Torque Method
M1.4, M1.6 and M2 bolts tightening experiments were performed to investigate the effect of bolt diameter on the preload scatter of the improved torque method. The results have demonstrated that, for the same experimental setup and the same preload level, as the bolts diameter increases from 1.4 to 2 mm, with the improved torque method, the scatters of bolts preload for the target preloads were ±8.6, ±10.0 and ±11.2%, respectively, and with the torque method, the scatters of preloads around the mean value were ±25.0, ±21.9 and ±22.7%, respectively. It is obvious that the diameter of the bolts influences the scatter of the improved torque method at the same preload level. It may induce larger preload scatters when the relatively lower tightened torques were applied on the bolt in larger diameters.
For miniature bolt applications of no more than M2, the improved torque method has an advantage over the torque method for preload control. However, if the bolt is larger than M2, other methods such as the angle control method, tension indicating method and even the ultrasonic method can also be used for better preload control in larger bolts application.
Fig. 8. Automatic precise assembly system for miniature products
4 CONCLUSIONS
An improved model based torque method was proposed for the real-time precise control of the preload of the miniature bolt joints. The torque gradient determined by friction effects was taken into account in the model. Moreover, the system stiffness and rotation speed were also incorporated into the model. Finally, miniature bolts tightening experiments which were conducted have demonstrated the validity of the proposed method, and the results indicated that the scatters of bolts preload for the target preloads of 90, 120 and 150 N were ±12.9, ±10.0 and ±8.9%, respectively. The magnitudes of the actual preload errors for most bolts were no less than 10%. However, if more accurate system stiffness can be obtained, better preload accuracy will be achieved. The method offers the benefit of convenience and does not require any special equipment, therefore, the proposed method is suitable for control the preload in real-time. It is a promising method for the preload control in the precision assembly of miniature bolt joints.
5 ACKNOWLEDGEMENTS
This research was supported by “the National Natural Science Foundation of China (No.51075058)” and by “the Fundamental Research Funds for the Central Universities (DUT10ZDG04)”.
6 REFERENCES
[1] Roman, C. (2008). Optimal control of screwing speed in assembly with thread-forming screws.
International Journal of Advanced Manufacturing Technology, vol. 36, no. 3, p. 395-400, DOI:10.1007/s00170-006-0839-1.
[2] Croccolo, D., Agostinis, M.D., Vincenzi, N. (2011). Failure analysis of bolted joints: Effect of friction coefficients in torque–preloading relationship. Engineering Failure Analysis, vol. 18, no. 1, p. 364-373, DOI:10.1016/j. engfailanal.2010.09.015.
[3] Zaletelj, H., Fajdiga, G., Nagode, M. (2011). Numerical methods for TMF cycle modeling. Strojniški vestnik - Journal of Mechanical Engineering, vol. 57, no. 6, p. 485-494, DOI:10.5545/sv-jme.2010.212.
[4] Stamenkovic, D., Maksimovic, K., Nikolic-Stanojevic, V., Maksimovic, S., Stupar, S., Vasovic, I. (2010). Fatigue life estimation of notched structural components. Strojniški vestnik - Journal of Mechanical Engineering, vol. 56, no. 12, p. 846-852.
[5] Arghavani, J., Derenne, M., Marchand, L. (2001). Sealing performance of washered bolted flanged joints: A fuzzy decision support system approach. International Journal of Advanced Manufacturing Technology, vol. 17, no. 1, p. 2-10, DOI:10.1007/ s001700170205.
[6] Sawa, T., Omiya, Y., Takagi, Y., Torii, H. (2009). Effects of scatter in axial bolt force on the sealing performance of pipe flange connections at elevated temperature. Proceedings of the ASME Pressure Vessels and Piping Conference, vol. 2, p. 139-147.
[7] Göran, R.T. (2003). Controlled tightening over the yield point of a screw: based on Taylor’s series expansions. Journal of Pressure Vessel Technology - Transactions of the ASME, vol. 125, no. 4, p. 460-466.
[8] Fukuoka, T., Takaki, T. (2004). Evaluations of the tightening process of bolted joint with elastic angle control method. Analysis of Bolted Joints. ASME/JSME Pressure Vessels and Piping Conference, vol. 478, p. 11-18.
[9] Jesse, R.M. (2010). Joint integrity monitoring using permanent ultrasonic bolt load transducers. Proceedings of the ASME Power Conference, p. 1-9.
[10] Jhang, K.Y., Quan, H.H., Ha, J., Kim, N. (2006). Estimation of clamping force in high-tension bolts through ultrasonic velocity measurement. Ultrasonics, vol. 44, p. 1339-1342, DOI:10.1016/j.ultras.2006.05.190.
transverse ultrasonic waves for in situ control of the tightening of bolts. Journal of Pressure Vessel Technology - Transactions of the ASME, vol. 129, no. 3, p. 383-390.
[12] Hesse, T., Ghorashi, M., Inman, D.J. (2004). Shape memory alloy in tension and compression and its application as clamping-force actuator in a bolted joint: Part 1 – Experimentation. Journal of Intelligent Material Systems and Structures, vol. 15, no. 8, p.577-587, DOI:10.1177/1045389X04042792.
[13] Ghorashi, M., Inman, D.J. (2004). Shape memory alloy in tension and compression and its application as clamping force actuator in a bolted joint: Part 2 – Modeling. Journal of Intelligent Material Systems and Structures, vol. 15, no. 8, p. 589-600, DOI:10.1177/1045389X04042791. [14] Nassar, S.A., Meng, A.D. (2007). Optical
monitoring of bolt tightening using 3D electronic speckle pattern interferometry. Journal of Pressure Vessel Technology-Transactions of the ASME, vol. 129, no. 1, p. 89-95, DOI:10.1115/1.2389024. [15] Yang, L.X., Ettemeyer, A. (2003). Strain
measurement by three-dimensional electronic speckle pattern interferometry: potentials, limitations and applications. Optical Engineering, vol. 42, no. 5, p. 1257-1266, DOI:10.1117/1.1566781.
[16] Huang, Y.H., Liu, L., Yeung, T.W., Hung, Y.Y. (2009). Real-time monitoring of clamping force of a bolted joint by use of automatic digital
image correlation. Optics Laser Technology, vol. 41, no. 4, p. 408-414, DOI:10.1016/j. optlastec.2008.08.010.
[17] Meng, A.D., Nassar, S.A., Douglas, T. (2011). A novel optical method for real-time control of bolt tightening. Journal of Pressure Vessel Technology - Transactions of the ASME, vol. 133, no. 6, p. 61211-61215.
[18] Zou, Q., Sun, T.S., Nassar, S.A., Barber, G.C., Gumul, A.K. (2007). Effect of lubrication on friction and torque-tension relationship in threaded fasteners. Journal of Tribology - Transactions of the ASME, vol. 50, no. 1, p.127-136.
[19] Nassar, S.A., Yang, X.J. (2008). Torque-angle formulation of threaded fastener tightening. Journal of Mechanical Design, vol. 130, no. 2, p. 245011-245014, DOI:10.1115/1.2821388.
[20] Nassar, S.A., Matin, P.H., Barber, G.C. (2005). Thread friction torque in bolted joints. Journal of Pressure Vessel Technology - Transactions of the ASME, vol. 127, no. 4, p. 387-393.
[21] Bickford, J.H. (1995). An Introduction to the Design and Behavior of Bolted Joints. 3rd ed. Marcel Dekker, New York.
[22] Zhang, X.W., Wang, X.D., Luo, Y., Teng, L., Chen, L., Ma, T.M. (2011). A precise automatic assembly system for fabrication of complex
miniature products. Advanced Materials