University of New Orleans University of New Orleans
ScholarWorks@UNO
ScholarWorks@UNO
University of New Orleans Theses and
Dissertations Dissertations and Theses
12-19-2008
Application of X-ray Diffraction Methods and Molecular
Application of X-ray Diffraction Methods and Molecular
Mechanics Simulations to Structure Determination and Cotton
Mechanics Simulations to Structure Determination and Cotton
Fiber Analysis
Fiber Analysis
Zakhia Moore
University of New Orleans
Follow this and additional works at: https://scholarworks.uno.edu/td
Recommended Citation Recommended Citation
Moore, Zakhia, "Application of X-ray Diffraction Methods and Molecular Mechanics Simulations to Structure Determination and Cotton Fiber Analysis" (2008). University of New Orleans Theses and Dissertations. 888.
https://scholarworks.uno.edu/td/888
This Dissertation is protected by copyright and/or related rights. It has been brought to you by ScholarWorks@UNO with permission from the rights-holder(s). You are free to use this Dissertation in any way that is permitted by the copyright and related rights legislation that applies to your use. For other uses you need to obtain permission from the rights-holder(s) directly, unless additional rights are indicated by a Creative Commons license in the record and/ or on the work itself.
Application of X-ray Diffraction Methods and
Molecular Mechanics Simulations to Structure Determination and Cotton Fiber Analysis
A Dissertation
Submitted to the Graduate Faculty of the University of New Orleans
in partial fulfillment
of the Requirements for the Degree of
Doctor of Philosophy in
the Department of Chemistry
by Zakhia Moore
B.S., Xavier University, 2000 M.S., University of New Orleans, 2005
ii
ACKNOWLEDGEMENTS
Giving all glory to God for His many blessings, whom without I could not have
completed this long journey. The work took longer than what I expected, but I’m glad
it’s finally behind me and now I can continue to another chapter in my life. This
dissertation is dedicated to my beloved grandmothers, Dorothy Moore and Pernella
Collins. Both of these beautiful women never stopped believing in me and always gave
me words of encouragement. My parents, Vanest and Denise Moore have always been
there for me every step of the way; I thank them for their constant unwavering love and
support. To my best girls, Chanel Fortier, RaShante Gilford, Ebony Terrance, and
Stephanie Anderson, there aren’t words I could say that would come close to how much
your friendship and love has helped me overcome many obstacles and brought me to
where I am today. Thanks for everything all of you have given to me. To my
co-workers, the U.S. Customs and Border Patrol Agriculture Specialists and Officers, too
many to name, thanks for your support. My co-worker and editor, Dr. Yi He, thanks for
your patience and for reading all this stuff! To Devron Thibodeaux, for showing me his
passion for his work and family, thanks for being a great colleague and friend. Finally
Dr. Edwin D. Stevens, you have put up with me for eight years, my ups and downs, the
constant changes in my life. I thank you the most for not only being a great professor,
iii
TABLE OF CONTENTS
List of Tables ... v
List of Figures ... vii
Abstract ... ix
Chapter I Introduction to X-ray Diffraction 1.1 The Significance of X-ray Technology ... 1
1.2 Properties and Production of X-rays ... 5
1.3 Geometry of X-ray Diffraction and Bragg’s Law ... 8
1.4 The X-Ray Diffractometer ... 11
1.5 Area Detectors ... 12
Chapter II Identification and Structure Determination of Ethylene Glycol Bis(Tropane -3-Carboxylate) by Single-Crystal X-Ray Diffraction 2.1 The Use of Single Crystal X-ray Diffraction in Structure Determinations ... 19
2.2 Description of Unit Cell and Lattices ... 22
2.3 Miller Indices ... 27
2.4 The Reciprocal Lattice and Ewald Sphere ... 29
2.5 Crystal Selection ... 32
2.6 Diffraction of x-ray by Crystals ... 34
2.7 The Crystallography Project ... 40
a. Unit Cell Determination ... 40
b. Data Collection ... 45
c. Integration of Intensity ... 47
d. Creation of a Trial Structure ... 53
f. Crystal Structure ... 57
Chapter III Correlations Between the Structural Properties and the Strength Properties of Cotton Fibers Grown In Various Countries 3.1 Introduction ... 80
3.2 Cotton Fiber Structure ... 82
3.3 X-ray Analysis ... 84
a. Apparatus ... 84
b. Sampling, Preparation, and Analysis ... 85
c. Calibration ... 89
3.3 Results ... 91
3.4 Discussion ... 101
3.5 Data Treatment ... 104
3.6 Crystallinity Estimate ... 107
3.7 Crystallite Size ... 110
3.8 Crystallite Orientation ... 111
iv
Chapter IV Determining the Crystal Structure of Cellulose Iii by Molecular Modeling
4. Introduction ... 116
4.2 Methods ... 118
4.3 Results and Discussion ... 123
Bibliography ... 140
Vita ... 146
v
LIST OF TABLES
TABLE PAGE
2.1 Laue Lattices………. 24
2.2 Summary of Unit Cell Parameters and Reflections………... 43
2.3 Summary of Preliminary Crystallographic Data ………50
2.4 Crystal Structure Refinement Data ……… 59
2.5 Published Results of Ethylene Glycol BIS(tropane-3-carboxylate) ……. 75
2.6 Atomic Coordinates ……….. 76
2.7 Bond Lengths and Angles ………..……… 77
2.8 Anisotropic displacement parameters ……….. 78
2.9 Hydrogen Atom Coordinates ……….. 78
3.1 Calibration Results ………...… 90
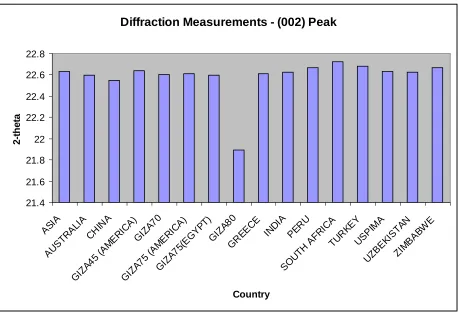
3.2 Diffraction Measurements - 002 Peak ……….. 91
3.3 Diffraction Measurements - 002 Peak ……….. 92
3.4 Crystallinity Results ……….………. 93
3.5 Crystallinity Results ……….. 94
3.6 Crystallite Size Estimates ……… 95
3.7 Crystallite Size Estimates ……… 96
3.8 Crystallite Orientation ……….. 97
3.9 Crystallite Orientation ……….. 98
3.10 Measured Strengths of Cotton Fibers ………...99
vi
4.1 Energies (kcal) and hydroxyl torsion angles (º) for two central glucose
residues from the best tetraose-based models ………..124
4.2 Calculated energies and unit cell dimensions of hexamer models …. 126
4.3 Intra - and Intermoleculara hydrogen bonds in best “up” model ……… 128
4.4 Atomic coordinates of modeled glucose monomer
of up cellulose IIII ………135
4.5 Atomic coordinates of modeled glucose monomer
vii
LIST OF FIGURES
FIGURE PAGE
1.1 Bragg’s Law ……….. 11
1.2 HI-STAR Detector ……….15
2.1 The Unit Cell ………..25
2.2 Three Dimensional Lattice ……….25
2.3 Bravais Lattices ……… 26
2.4 Miller Indices (1, 1, 1) ………. 28
2.5 Miller Indices (2, 0, 0) ………. 28
2.6 Diffraction in Terms of the Reciprocal Lattice ……….. 31
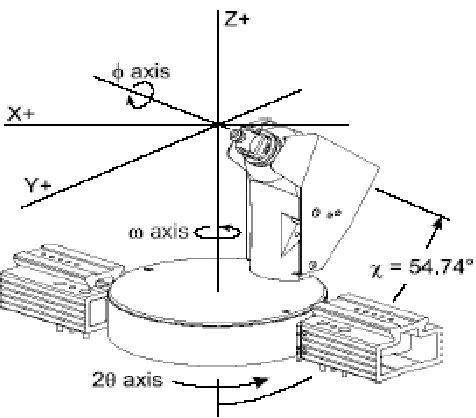
2.7 Goniometer Axes Showing All Swing Angles ………... 43
2.8 512 X 512 pixel image ……….. 44
2.9 Final Crystal Structure ……… 74
3.1 Cotton Fibers aligned on Phi Axis ………... 87
3.2 Chi integration of Egyptian Cotton Sample ……….. 101
3.3 Azimuthal Scan of an Egyptian Cotton Sample ……….. 102
3.4 Deconvolution of Peaks. Sample Asia………. 106
3.5 Fiber Strength vs. Fiber Crystallinity ……….. 108
3.6 Fiber Strength vs. Fiber Orientation ……….. 113
viii
4.2 Minicrystal of cellulose III after energy minimization with MM3(96) Hydrogen
bonding in cellulose IIII ………..………...…… 122
4.3 Hydrogen bonding in cellulose IIII ………...……… 130
4.4 Two glucose residues from the center of the best up hexameric minicrystal,
ix ABSTRACT
The results of three very different studies are presented. X-ray diffraction has
been utilized for single-crystal structure determinations, fiber diffraction analyses, and in
conjunction with molecular modeling of Cellulose IIII. Although each technique is
different in its sampling, data acquisition, data treatment, and identification, the common
denominator has been the use of x-rays. The single-crystal structure determination of
ethylene glycol bis(tropane-3-carboxylate) is presented as an example of the use of
modern single-crystal x-ray instrumentation including the use of coupled charged
devices (CCDs) as detectors for accurate data collection and rapid elucidation of crystal
structures. The structure determination of Cellulose IIII by x-ray diffraction and
computer modeling is presented to show how the use of x-rays in weakly diffracting
materials can generate a reliable structure and be a key component in model building.
Finally, a study is presented in which x-ray fiber diffraction data is utilized to investigate
possible correlations between the crystallite orientation, crystallinity, crystallize size and
the strength properties of cotton fibers collected from various countries.
1 CHAPTER I
INTRODUCTION TO X-RAY DIFFRACTION
1.1 The Significance of X-ray Technology
X-ray technology has developed into one of the most notable methods of
structural analysis during the past 100 years, as evidenced by how its discovery and
enhancements play an important role in daily living. Versatility is an attribute of x-ray
technology, offering widespread use in many applications. It is useful not only to the
scientist, but also to health professionals and law enforcement officers. For example,
x-rays are of enormous value in detecting and diagnosing health problems or assisting in
pre-surgical procedures1, as a convenient inspection device of luggage prior to boarding
airplanes2, and effective in detecting smuggled materials in cargo trucks or ships
entering or passing through the nation’s borders3. In particular, X-ray diffraction, based
upon the scattering of x-rays, has become the premier technique for quantitative and
qualitative analysis of crystalline materials, aiding in the new frontiers of nanotechnology
2
various molecules is indispensable to chemists in an effort to gain insight into chemical
problems7.
Only a few physical methods are utilized to determine chemical structures, and
amongst these methods, x-ray diffraction techniques have been the most successful.
Diffraction methods yield atom positions, bond lengths, bond angles, and spatial
proximity of non-bonded atoms for materials capable of forming crystalline solids.
The discovery of x-rays in 1895 by the German physicist Wilhelm Röntgen was
quickly followed by the demonstration by von Laue8 of diffraction of x-rays by crystals.
With the addition of W.L. Bragg’s diffraction theory in 19129, this non-destructive
analytical technique has become extremely successful since it is one of few
“fingerprinting” methods that can be used to accurately characterize both the identity
and amount of compounds found in any crystalline system.
It is well known that any material which is made up of an ordered array of atoms
will give a diffraction pattern. Determinations of the three-dimensional structure of
compounds are most easily achieved by single-crystal ray diffraction. Single-crystal
x-ray diffraction analysis differs from other diffraction methods because the measurement
of the diffraction pattern is generated from an oriented single-crystal sample10. The
diffraction pattern produced depends on the atoms present, their locations, and thermal
motion. Modern experiments use an x-ray detector based on CCD camera technology,
and the diffraction pattern from a single crystal yields a three dimension intensity
3
analysis and least-squares refinement of the intensities of the spots allows accurate
determination of the chemical identity and molecular structure of the sample.
X-ray powder diffraction (XRD) is an alternative analysis method that derives its
name from the fact the specimen is in the form of a microcrystalline powder.
In XRD, the scattered signal contains the same information as the single-crystal
experiment, but the three-dimensional pattern is “compressed” into one dimension. The
diffraction pattern from a powder consists of “rings” of diffracted intensity with cone
angles corresponding to the Bragg 2θ angles of each plane. Consequently, there is
usually considerable overlap of peaks in the powder diffraction pattern, leading to
severe ambiguities in extracting the intensities I(hkl) of individual diffraction maxima. As
a result, XRD is rarely used for structure determination, except for inorganic compounds
with relatively small cells and highly symmetric structures. On the other hand, XRD
remains a very powerful technique for the identification and quantification of crystal
phases with known structure.
X-ray fiber diffraction is a related technique used for structural analysis of fibrous
materials (i.e. DNA, muscle fibers, cotton fibers, synthetic polymers) in which the
ordering of the atoms is one-dimensional (along the fiber axis). The chain molecules in
fibers are parallel to each other, but are usually randomly oriented perpendicular to the
fiber axis, and usually terminate at random. Many fibers have only helical symmetry, in
contrast to the three-dimensional symmetry seen in single crystals. In addition,
depending on the conditions of crystallization and processing of the fiber samples, there
4
pattern typically consists of “arcs” of diffracted intensity, a pattern intermediate between
single crystal “spots” and powder diffraction “rings”.
The investigations presented here demonstrate the application of various x-ray
diffraction techniques to a variety of analytical and structural problems.
These studies demonstrate to ability of X-ray diffraction techniques to reach across
many disciplines. A wide range of structural information can be obtained through X-ray
diffraction, since it takes advantage of the scattering of x-rays by crystalline or partially
crystalline materials11. In addition, when combined with other experimental or
computational methods of analysis, it can provide deeper insight than either technique
would provide on its own.
The results of three very different studies are presented. X-rays have been used
for single-crystal structure determinations, fiber diffraction analyses, and in conjunction
with molecular modeling of Cellulose IIII. Although each technique is different in its
sampling, data acquisition, data treatment, and identification, the common denominator
has been the use of x-rays. The single-crystal structure determination of ethylene glycol
bis(tropane-3-carboxylate) is presented as an example of the use of modern
single-crystal x-ray instrumentation including the use of coupled charged devices (CCDs) as
detectors for accurate data collection and rapid elucidation of crystal structures. The
structure determination of cellulose IIII by x-ray diffraction and computer modeling is
presented to show how the use of x-rays in weakly diffracting materials can generate a
5
presented in which x-ray fiber diffraction data is utilized to investigate possible
correlations between crystallite orientation and the strength properties of cotton fibers
collected from various countries.
1.2 Properties and Production of X-rays
Wilhelm Röntgen discovered a new form of radiation in 1895 and named it
X-radiation to indicate its unknown character. X-radiation can pass through many
materials that absorb visible light, including body tissues. X-rays also have the ability to
knock electrons loose from atoms. They are characterized as a short-wavelength,
high-energy form of electromagnetic radiation with a wavelength between 0.01 and 1nm and
typical photon energies in the range of 100eV to 100keV12. Since their wavelength is
comparable to the size of atoms, and they easily penetrate most materials, x-rays are
ideally suited for investigating structural arrangements of atoms and molecules in a wide
range of materials. Energetic X-rays can also penetrate deeply into materials and
provide information about the bulk structure (x-ray radiography and tomography).
Generally, production of x-rays is achieved using sealed x-ray tubes, rotating
anode systems, or synchrotron radiation. The primary source of x-rays in conventional
laboratories is x-ray tubes, or “stationary” anodes. The traditional x-ray source consists
6
envelope under vacuum. Inside the evacuated area, the tube contains a cathode
consisting of a filament wire and an anode, which consists of a metal target with a high
melting point. An electrical current drives electrons through the low resistance filament
wire, which becomes hot and electrons are emitted. Due to a high voltage applied
between the cathode and anode, emitted electrons are accelerated in the direction of
the metal target.
On impact, electrons collide with atoms in the metal target and slow down, producing a
continuous spectrum of x-rays, which is termed Bremsstrahlung radiation.
The electrons also eject inner shell electrons in atoms of the metal target through the
ionization process. When an inner shell electron is removed, it is replaced by an
electron from a higher-level shell. Consequently, radiation is released with a specific
energy corresponding to the difference in energy levels between the initial and final
states of the electron dropping into the lower energy shell. When a free electron fills the
shell, an x-ray photon with energy characteristic of the target material is emitted. Thus,
CuKα radiation arises when an electron in the L shell (n=2) drops in to the K shell (n=1).
In this convention, Cu designates the target material, K designates the ground state
electron shell of the transition and α designates ∆n=1. Common targets used in x-ray
tubes include Cu and Mo, which emits 8 keV and 14 keV x-rays with corresponding
wavelengths of 1.54 Å and 0.7107 Å, respectively. The energy (E) of an x-ray photon
and its wavelength λ are related by the equation E = hc/λ, where h is Planck's constant
7
The rotating anode was invented in the 1960s in an effort to increase x-ray
intensity and improve heat dissipation by spreading the electron bombardment over a
much larger piece of metal13. The X-ray beam generated is more intense than those
obtained from a stationary anode tube operated under similar conditions. The target
metal is subjected to a focused stream of electrons originating from the cathode and
accelerated by a high potential difference between the target disc and the cathode.
When the electron beam hits the anode, it produces an x-ray beam by the same
mechanism as a sealed tube. However, only a very small portion of the energy of the
electrons is converted to X-rays, the rest of the energy is converted into heat.
The anode rotates in vacuum and is internally cooled with water. The rotation
continuously brings cooler metal into the path of the focused electron beam. A seal
around the anode shaft maintains the vacuum while rotating and prevents leaks.
Continuous pumping by a turbo molecular pump backed by a pre-vacuum pump
maintains the high vacuum. With more efficient cooling, rotating anode systems can be
run at a power almost an order of magnitude higher than systems equipped with an
equivalent sealed tube.
Synchrotron radiation is inherently advantageous to laboratory sources since the
naturally high-intensity, collimated beam provides superior resolution and easily tunable
wavelengths. A synchrotron is a device that accelerates and steers electrons (or other
elementary particles) by magnets in an evacuated ring14. Every accelerated charged
particle produces some electromagnetic radiation. Synchrotron radiation is the name
8
ring. The diameter of the evacuated ring can be meters or miles in length. This occurs
because the charged particles are accelerated (deflected) by the magnetic field from the
dipole magnets to make the beam travel around the ring. A synchrotron produces a
continuous distribution of infrared light, visible light, ultraviolet light and x-rays. Using
single crystal monochromators, researchers are able to select the precise wavelength
that they require from the continuous distribution of light produced.
Modern synchrotron radiation sources can generate highly energetic x-rays that are 1014
orders of magnitude brighter than the traditional x-ray source15. In most cases,
synchrotron radiation is not practical for everyday chemical analysis, because of its
huge size, cost, and location far away from local laboratories.
Synchrotron radiation technology is mostly used for special applications, including when
a diffraction pattern needs to be achieved within minutes rather than hours per sample,
or for fragile samples with little crystallinity where the best possible diffraction pattern is
warranted.
1.3 Geometry of X-ray Diffraction and Bragg’s Law
The x-ray diffraction pattern of a crystalline material serves as an identification
tool and allows in some instances complete elucidation of its structure. Klug and
Alexander simply described x-ray diffraction (where the interaction occurs between the
9
billiard balls bouncing off one another16. X-rays are “scattered” by the electrons of the
atoms without a change in wavelength. The electrons are believed to absorb and emit
the impinging x-rays, i.e. the electron in the presence of electromagnetic waves will be
excited to higher unstable energy levels. Upon relaxation, the electrons emit
electromagnetic energy of the same frequency and wavelength. When x-ray photons
collide with electrons, some photons from the incident beam will be deflected away from
the direction where they originally traveled.
If the wavelength of these scattered x-rays did not change (meaning that x-ray photons
did not lose any energy), the process is called elastic scattering (Thompson Scattering)
meaning that only momentum has been transferred in the scattering process. In some
directions, the scattered x-rays combine (crest to crest), which produces an increase in
amplitude resulting in constructive interference and an increase in diffraction intensity.
These are the x-rays that we measure in diffraction experiments, as the scattered x-rays
carry information about the electron distribution in materials. In other directions, the out
of phase combination of scattered x-rays results in destructive interference, and zero
diffracted intensity. Also, in an inelastic scattering process (Compton Scattering), x-rays
transfer some of their energy to the electrons and the scattered x-rays will have a
different wavelength than the incident x-rays. These x-rays will contribute a slowly
10
For a given set of lattice planes with an inter-plane distance of d, the condition for
a diffraction (peak) to occur can be simply written as:
n λ = 2d
hklsin θ (1.1)
The English physicists Sir W.H. Bragg and his son Sir W.L. Bragg derived the
equation in 1913 to explain why the cleavage faces of crystals appear to reflect x-ray
beams at certain angles of incidence (theta, θ)17
. They noticed the similarity of
diffraction to ordinary reflection and treated diffraction as “reflection” from planes in the
lattice.
In this equation, the variable d is the distance between atomic layers in a crystal,
lambda (λ) is the wavelength of the incident x-ray beam, and n is an integer
representing the order of the diffraction peak. In simple structures, the peaks in an
x-ray diffraction pattern are directly related to the atomic distances through equation 1.1.
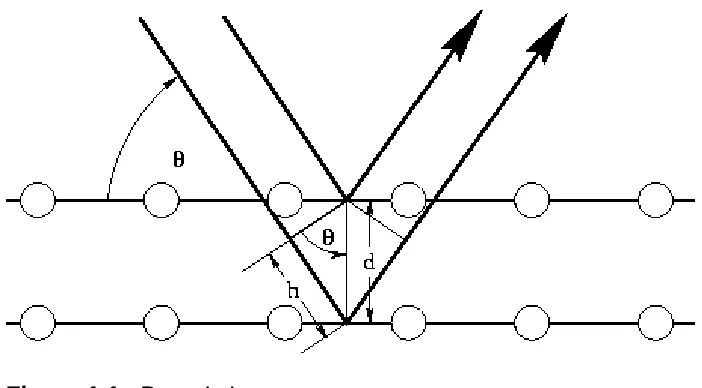
Figure 1.1 shows an incident x-ray beam interacting with the atoms arranged in a
periodic manner. The atoms, represented as spheres in the diagram below, can be
viewed as forming different sets of planes in the crystal. Here, Bragg’s Law illustrates
that a set of parallel planes with index hkl and interplanar spacing dhkl produces a
diffracted beam when x-rays of wavelength λ impinge upon the planes at and angle θ
11 Figure 1.1. Bragg’s Law
1.4 The X-ray Diffractometer
An X-ray diffractometer is a scientific instrument designed for the collection of
accurate x-ray diffraction data. A diffractometer typically consists of an x-ray source, a
goniometer for accurately mounting and orienting a sample, and a detector for collecting
and counting scattered x-ray photons at a known scattering angle. For single-crystal
experiments, the diffractometer usually includes a monochromator crystal to select a
specific x-ray wavelength and a metal tube called a collimator that directs a narrow
incident x-ray beam onto the sample. To orient the single-crystal sample, a goniometer
allows rotation of the sample about 2 or 3 independent axes under computer control.
The detector is also mounted on an axis that allows variation of the total scattering
12
The instrument often includes a low-temperature system for cooling the crystal sample
which reduces thermal motion of the atoms and improves the resolution of the
experiment.
A diffractometer designed for powder diffraction measurements is less complex
because the randomly oriented microcrystalline nature of the sample eliminates the
need to place the sample in a particular orientation with respect to the incident beam.
The diffractometer generally allows for rotation of the sample (θ) and detector (2θ) about
a common axis. For fiber diffraction measurements, the diffraction pattern is
2-dimensional and the scattering intensity much weaker than single-crystal or powder
diffraction intensities. Efficient measurement requires the use of a rotating anode or
synchrotron x-ray source and a two-dimensional area detector.
1.5 Area Detectors
Many important problems in solid physics, biophysics, and materials science can
be studied by means of x-ray diffraction18. In the past, important contributions to the
understanding of these problems have resulted from the application of recording
techniques utilizing photographic emulsions and single point electronic detectors19. As
attention had been directed to more difficult problems in these areas, both methods
have become to be decreasingly practical.
Important new problems often exhibit one or more of the following characteristics:
1. The sample is weakly diffracting; thus a high efficiency detector is required.
13 an area detector is required.
3. The samples changes with time, due either to its dynamic characteristics, or
to the effects of the radiation it is receiving.
4. It is necessary that the detector is capable of recording high count rates, i.e. it
must not be “count-rate limited.
New techniques have been developed and designed to meet the uniqueness of
these more difficult situations. Given the above information, X-ray scattering studies of
large, weakly diffracting materials require detectors that have good spatial resolution
and very low noise levels. It is also very efficient to collect a full two-dimensional
diffraction pattern all at once-with an “area detector” rather than simply measuring the
intensities at one point or along one line at a time. X-ray film is commonly used as an
area detector for CuKα (8 keV) x-rays20, but it has several significant limitations: it has a
high background noise level which leads to a very poor detective quantum efficiency for
weak signals; it must be developed and then digitized before the data may be analyzed
quantitatively; and it has a very limited dynamic range, so that a typical pattern must be
recorded on several films that are exposed for different times and then scaled together.
Whereas traditional diffractometers use point detectors, which measure the
intensity of each diffracted beam individually in sequence, area detectors record the
diffraction pattern over a large area of reciprocal space simultaneously. One type of
area detector is the multiwire or gas proportional detector. An example of this type is
14
perpendicular sets of parallel wires in a flat box filled with an xenon gas (see Figure
1.2). A thin window of beryllium permits entry of x-ray from the front of the detector21.
Entering the detector through the beryllium window, an x-ray photon ionizes the
gas in a small region, producing a few hundred electrons. The electrons drift to the
nearest anode wire, and because of the high voltage, each electron triggers an
electrical discharge that in turn produces thousands of ion pairs in the gas. The
movement of these ions in the electric field of the cathode and anode wires produces a
pulse of current in each of the nearest wires. The detection of these pulses at the ends
of the x and y delay lines allows determination of the reflection position in the detector.
The output from the area detector is fed to a computer, which indexes the event using
the x and y positional information and the crystal orientation at the time of the event.
The computer sums events that have the same index and thus produce a file of indexed
15
16
Another type of area detector utilizes charge-coupled devices (CCDs). A CCD
area detector consists of a collection of individual photoelectric sensitive elements,
called pixels, that are arranged linearly or in a two-dimensional pattern on a single
semiconductor chip22. The chip, which is usually silicon and typically has dimensions of
a few millimeters on a side, also contains electronic circuitry that makes it possible to
determine the electrical output signal from each of the photosensitive elements either
sequentially or simultaneously. To record an x-ray image using a CCD based area
detector, the x-ray image is usually first converted to a visible light image using a
phosphor screen. The phosphor’s function is to convert x-ray energy into visible light
while preserving the spatial content of the x-ray image. The visible light image formed
by the phosphor is focused by a lens, or transferred by the fiber optic taper, onto a CCD
chip to generate an electronic image, corresponding to the original x-ray image, which
then can be digitized, saved, analyzed, and displayed. The processes in this energy
conversion can be described as:
1. Absorption of an x-ray photon by the phosphor and formation of an excited
state,
2. Partial relaxation of the excited state by radiationless decay,
3. Radiation by emission of a lower energy photon from the excited state, and
4. Relaxation to the original, ground state.
There are several reasons for using a phosphor rather than having x-rays strike
17
First, silicon only weakly absorbs x-rays with energy higher than 5 keV. These x-rays
are inefficient in directly forming an electronic image, since most of them simply pass
through the active region of the CCD. This problem can be avoided by using a
phosphor screen of heavier atoms, which strongly absorbs the x-rays and efficiently
converts them to visible light. Second, for the x-ray photons that are absorbed by
silicon atoms in the CCD, each one will generate thousands of signal electrons. The
dynamic range can be improved if an energy converter is used with the CCD, e.g., a
phosphor screen and fiber optic taper which produce on the order of ten signal electrons
in the CCD for each x-ray photon absorbed in the phosphor. Third, a phosphor screen
and its optically transparent substrate will stop most of the x-rays and will help to protect
the optical system and the CCD from radiation damage. Finally, a phosphor screen
coupled to a CCD with a demagnifying lens or fiber optic taper can record images much
larger than the active area of the CCD.
In the UNO Chemistry Department, a Bruker AXS SMART CCD diffractometer
system is equipped with a SMART 1000 CCD detector, which has a pixel size of 120
microns containing 512 X 512 pixels. For data collection, CCDs are coated with
phosphors that emit visible light in response to x-rays. A tapered bundle of optical fibers
are used to increase light collection efficiency between the phosphor and the CCD. At
the end of each collection cycle, the charges are read out by a process in which rows of
pixel charge are transferred sequentially into a serial readout row at one edge of the
18
After the charges in the readout row are transferred serially to an amplifier at the end of
the row, and the next row of pixel charges will be transferred into the readout row.
Because all data are read out at the end of the data collection, a CCD has no dead
19 CHAPTER II
IDENTIFICATION AND STRUCTURE DETERMINATION OF ETHYLENE GLYCOL BIS(TROPANE-3-CARBOXYLATE) BY SINGLE-CRYSTAL X-RAY DIFFRACTION
2.1The Use of Single Crystal X-ray Diffraction in Structure Determinations
“Structure determines function” is an axiom which emphasizes the connection
between how a molecular system functions and its natural structure. The main
objective of x-ray crystallography is to obtain knowledge of the molecular structures of
natural and synthesized compounds. It yields the three-dimensional structures of new
and existing crystalline materials, which can be used to predict or interpret functional
information. More specifically, x-ray crystallography reveals what atoms are present
and their positions, distances and angles between atoms, and the symmetry involved
that generates the entire crystalline substance. Single-crystal structure determination
has become an important and extremely powerful tool, not only for mineralogists,
inorganic and structural chemists, but also for many other scientists who are interested
in the structural basis for the properties of chemical and biological systems at the
molecular level.
Single-crystal x-ray structure determination may also be regarded as the ultimate
analytical tool, because it provides direct, unequivocal identification of the sample under
20
determination yields the precise composition of the unit cell, including the identity and
position of every atom.
Except in rare cases, only the correct molecular structure will produce a good fit to the
observed x-ray diffraction intensities, and all incorrect structures produce fits that are
obviously inferior.
A number of other experimental techniques may also provide useful structural
information, but they are often limited in the amount of information or resolution they can
provide, or suffer from other limitations. Electron diffraction and microwave
spectroscopy can provide very accurate structural data for molecules in the gas phase.
Other forms of spectroscopy, including Extended X-ray Absorption Fine Structure
(EXAFS) and Resonance Raman spectroscopy provide only limited information about
the environment of a small number of atoms, bonds, or functional groups, mostly of
elements having atomic numbers greater than oxygen23.
Libraries of spectra are helpful in identifying compounds and commonly known
functional groups. However, this practice may not be useful in the investigation of newly
synthesized compounds not found in spectral libraries. Techniques for the direct
visualization of molecules, such as atomic force microscopy, in which a probe is
scanned over molecular surface, do not provide details of the molecular interior.
Over the past few decades, many technological improvements have been
directed to optimizing X-ray diffraction instruments and software programs, so that the
once long, arduous task of structure determination has evolved into a fairly
21
methods because the measurement of a diffraction pattern is determined in three
dimensions, and generated from an oriented single crystal24.
It is the only diffraction technique where the two-way mathematical relationship that
exists between the observed diffraction pattern and the structure of the scatterer, which
is the electron density distribution of the crystal, is routinely achieved in practice. The
key assumption is that a single crystal has three-dimensional translational symmetry,
which reduces the problem to a study of the scattering density of a unit cell, rather than
the entire crystal.
Nuclear Magnetic Resonance (NMR) spectroscopy is the technique most
competitive with X-ray crystallography for generating three-dimensional structure
information of macromolecules. With NMR, one can obtain distances between specific
nuclei in the structure. When combined with molecular dynamical or molecular
mechanical techniques, these data can be used to produce full three-dimensional
molecular models. However, even with the best available equipment, the size of
structures that can be solved by NMR is limited. The structures of viruses, complex
proteins and enzymes that are routinely being solved by X-ray diffraction are currently
beyond the capabilities of NMR methods. An advantage of NMR, however, is that
experiments can be carried out on samples in solution, avoiding the need to grow
crystals.
Unfortunately, X-ray crystallography is not appropriate in every situation. For
22
crystallized will not diffract well. Moreover, the phase problem (discussed later) can be
challenging. Special circumstances like twinning (not discussed) can also interfere with
data collection and analysis. However, crystallography is a complex but valuable
technique, which certainly requires specialized skills, experience, and patience.
The successful structure determination of ethylene glycol
bis-(tropane-3-carboxylate), a ditropane derivative synthesized as a potential ligand for neuronal
nicotinic acetylcholine receptors (nAChRs) for treating various central nervous system
diseases, is presented in full detail25. We will describe every step involved in this
particular structure determination, from sample selection to model building and
refinement. The crystal was a kind gift from Dr. Mark Trudell’s research group,
Chemistry Department, University of New Orleans.
2.2 Description of Unit Cells and Lattices
Crystals are solid-state materials in which the atoms or molecules have a
repeating order which extends over a long range26. The repeating order in a crystal can
be simply described as if they were the two dimensional patterns printed on a piece of
wallpaper. Most wallpaper has a regular repeating design that extends from one end to
the other. Crystals have a similar repeating design, but in this case the design extends
in three dimensions from one edge of the crystal to the other. We can easily describe a
piece of wallpaper by specifying the size, shape, and contents of the simplest repeating
unit in the design. Similarly, we can describe a three-dimensional crystal by specifying
23
units stack to form the crystal. The repeating unit in a crystal is called a unit cell. The
unit cell is regarded as the basic "building block" of a crystal. It is a human construct
used to simplify our notion about the size, dimensions, and number of objects contained
within the crystal.
Theoretically, we should be able to reconstruct the entire crystal just by placing a large
number of these unit cells next to each other in all directions.
Each unit cell is defined in terms of lattice points. The lattice is the basic network
of points on which the repeating unit (the contents of the unit cell) may be imagined to
be laid down so that the regularly repeating structure of the crystal is obtained. Thus
the lattice establishes the repeating pattern, and the unit cell tells us what is being
repeated. In Figure 2.1, we see a standard three-dimensional unit cell consisting of a
parallelepiped with cell edges of length a, b, and c, and angles of α, β, γ. The unit cell
is always chosen to be right-handed, with a, b, and c following the “right-hand rule,” the
direction of the cell edges will be chosen to coincide with the major symmetry elements
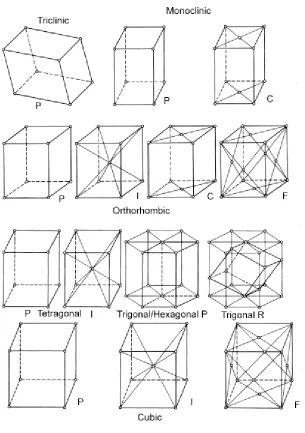
within the unit cell. All crystal structures fall into one of the seven crystal systems, its
24 Table 2.1. Laue Lattices
Cell Type Axial Measurements Angle Measurements
Triclinic a ≠ b ≠ c α ≠ β ≠ γ
Monoclinic a ≠ b ≠ c α = γ =90°, β ≠ 90°
Orthorhombic a ≠ b ≠ c α = β=γ = 90°
Tetragonal a = b ≠ c α = β= γ= 90°
Cubic a = b = c α = β = γ =90°
Hexagonal a = b ≠ c α = β= 90°, γ = 120°
Rhombohedral a = b = c α = β = γ ≠ 90°
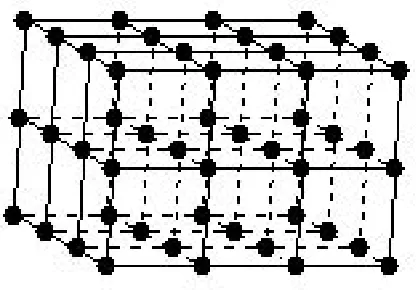
In Figure 2.2, the three-dimensional basic structural pattern (the crystal structure
itself) is simplified by replacing the pattern at an equivalent point in each cell with a
point, so that the unit cell (shown in Figure 2.1) can be translated in all directions. The
array of points thus generated constitutes the crystal lattice. There may also be one of
various centerings for a unit cell. A crystal system with equivalent lattice points only at
the corners of the unit cell is called “primitive” (P). A system that has an additional
lattice point in the center of each face is “face-centered” (F). Crystal systems that have
an additional lattice point in the middle of the unit cell are named “body centered” (I).
Other possibilities include C-(centered axially), and R (trigonally) centered lattices. A
crystal will have one of the fourteen different Bravais lattices, as seen in Figure 2.3.
25
Figure 2.1. A three-dimensional unit cell.
26
27 2.3 Miller Indices
What are Miller Indices, and how are they important in determining crystal
structure? Bragg’s law relates the angle of x-ray diffraction to the interplanar spacing
dhkl of a specific set of repeating planes in the crystal structure. Miller indices (h, k, l)
specify the orientation of the crystal planes by the intersection of the plane with the
crystallographic axes (a, b, c) of the solid. Each plane has integer indices h, k, and l
equal to the reciprocals of the intercepts a, b, and c as fractions of the unit cell
dimensions. Miller indices are also used to identify a reflection (diffracted intensity Ihkl)
coming from a set of hkl planes in a crystal. In Figure 2.4, the plane divides a, b, and c
axis into whole units, so the h, k, and l index is 1. The Miller indices for this plane are (1
1 1). In Figure 2.5, we see that the plane parallel to the unit cell axes a and b which
28
Figure 2.4. Miller Indices (1, 1, 1)
29 2.4 The Reciprocal Lattice and Ewald Sphere
A single diffraction event (reflection) occurs when an entire set of parallel planes
constructively interfere to produce the diffracted x-ray beam. The use of constructs
such as the reciprocal lattice and Ewald sphere aid in determining geometrically where
the reflections will occur and satisfy Bragg’s equation. The reciprocal lattice is related to
the real crystal lattice (axes a, b, c) with axes a*, b*, c*, such that a* (a*=1/a) is
perpendicular to b and c, b* (b*=1/b) is perpendicular to a and c, and c* (c*=1/c) is
perpendicular to a and b. Each reciprocal lattice point corresponds to a set of Miller
indices, hkl. Considering Bragg’s equation, the angle of diffraction θ is inversely related
to the interplanar spacing dhkl. This means that large unit cells will produce small angles
of diffraction, resulting in many reflections at a convenient angle from the incident beam.
The opposite is true for small unit cells, which will produce fewer reflections. P.P. Ewald
developed a geometrical construction to help visualize which Bragg planes are in the
correct orientation to diffract. In reference to Figure 2.6, the Ewald sphere has a radius
equal to 1/λ, with its center C. Points P, B, and O are on the sphere. As the crystal is
rotated about point O, a reciprocal lattice point P comes in contact with the circle. As
incident x-rays passes through the crystal (line XO´) at an angle θ, the reflected x-ray
diverges from point C at angle 2θ through point P101. The lines OP and BP are drawn;
the length of OP (or 000 to 101) is 1/dhkl. The length of OB is 2/λ, the diameter of the
30
sin θ = OP / BO = (1/d
hkl)/ (2/λ)
(2.1)
Rearranged, this equation gives Bragg’s law. The Ewald Sphere and the reciprocal
lattice show that when a reciprocal lattice point falls on the sphere, a reflection will
occur, thus Bragg’s law is satisfied. Ewald’s sphere shows which hkl planes are in the
proper orientation to diffract, and how each reciprocal lattice point must be arranged
31
32 2.5 Crystal Selection
A suitable crystal is necessary for structure determination, as crystal quality is
directly proportional to the quality of the diffraction pattern. A quality crystal should be
appropriate in size and shape, without defects or obvious twining. Smooth faces and
straight edges are useful guides in choosing a crystal for structure determination27.
Since X-ray absorption reduces the intensities of the spots and introduces systematic
errors into the intensity measurements, there is a limit to the size of the crystal.
However, the absorption also depends on the x-ray wavelength chosen. During
crystallization, randomly arranged ions, atoms or molecules originally in the gas phase
or solution adopt a unique position, orientation, and symmetry in the unit cell. The
resulting crystal is an orderly three-dimensional array of molecules, often held together
by noncovalent interactions. The crystals grown for this particular structure
determination were obtained by a slow, controlled recrystallization from methanol
solution that evaporated over time28. Another way to determine crystal suitability is to
place the crystal under a polarizing microscope to judge optical clarity. When the
selected crystal was rotated, while being observed with plane-polarized light, the crystal
rapidly changed from uniformly bright to dark and back again every 90ο. This behavior
33
The size of the crystal chosen for structure determination was approximately
0.26mm x 0.08mm x 0.03mm, which is appropriate for the 0.5mm x 0.5mm dimensions
of the uniform portion of the x-ray beam.
This allowed all parts of the crystal to be illuminated in the beam with equal intensity. A
linear absorption coefficient of 0.086 mm-1 was calculated using the equation:
I
=
I
oe
-τρ(µ/ρ)λ(2.2)
where
I
o is the incident’s beam intensity and (µ/ρ)λ is the mass absorption coefficientfor the 0.71073 Å Mo wavelength used and ρ is the density. The density was calculated
using the atomic molecular weight of the crystal and the volume of the unit cell. Since
we are dealing with atoms of small atomic number, the need to correct for absorption
can be ignored. Generally speaking, the absorption of x-rays from a crystal of such
small thickness and small absorption coefficient should generate some systematic
errors in intensity, but such errors are estimated to be well below the random noise level
of the intensity measurements.
The preparation of the crystal for structure determination entailed placing the
crystal at the end of a thin glass fiber attached by silicon vacuum grease. The fiber was
fixed onto a brass pin and this pin was then placed on a goniometer head as shown in
Figure 2.9. The goniometer head is a highly accurate xyz-positioning device for
centering the crystal on the goniometer29. The crystal can be rotated about its mounting
z-34
axis allow the crystal to be centered and rotated through 360ο. These heads are easy
to adjust and hold the crystal stationary during data collection. It is of the utmost
importance that the crystal does not move during data collection. The crystal was
centered on a Bruker SMART 1K x-ray diffractometer, and the orientation and unit cell
dimensions of the crystal were determined by gathering a small set of preliminary data.
Equally important is the cooling of the crystal, as the atoms within the crystal are
not at rest, but are constantly vibrating about their rest positions due to thermal motion.
The greater the temperature of the crystal leads to larger amplitudes of atomic vibration,
and consequently weaker intensities of the reflections. As a consequence, atomic
positions and other structural results will be less accurate if the crystal is not cooled.
Cooling is achieved by directing a stream of cold nitrogen gas down on the crystal. The
nitrogen stream is generated by boiling liquid nitrogen, and the temperature monitored
by a copper-constantan thermocouple mounted approximately 1.0 cm upstream from
the crystal.
2.6 Diffraction of X-rays by Crystals
The diffraction of x-rays by a single crystal leads to a set of intensity data that
can be used to determine the spatial arrangement of the atoms that make up the
crystal. Diffraction is a suitable technique for x-rays because of the limitations of
focusing optics of the relevant wavelengths. In order for the object to diffract light and
35
significantly larger than the object. Visible light, which is electromagnetic radiation with
wavelengths of 400-700 nm, cannot produce an image of individual atoms in molecules,
in which bonded atoms are only about 0.15 nm or 1.5 Ǻ apart. Electromagnetic
radiation of this wavelength falls into the X-ray range, so even the smallest molecules
diffract X rays. Even though individual atoms diffract x-rays, it is still not possible to
produce a focused image of a molecule, since existing lenses cannot focus X-rays.
However, by measuring the directions and intensities of the diffracted x-rays, a
computer can be used to simulate the effects of an objective lens by calculation.
To determine the position of atoms from crystallographic data, the computer
simulates the action of a lens, computing the electron density within the unit cell from
the list of Miller indexed intensities. The Fourier transform describes precisely the
mathematical relationship between an object and its diffraction pattern, which allows us
to convert the distribution of reflections intensities into a Fourier-series description of the
electron density distribution of the crystal. The intensity of an x-ray reflection can be
described by the structure-factor equation, containing one term for each atom (or each
volume element) in the unit cell. In turn, the electron density is described by a Fourier
series in which each term is a structure factor. The crystallographer uses the Fourier
transform to convert the structure factors into the electron density distribution, ρ(x,y,z).
When incident x-rays strike a crystal, the electrons of each atom will absorb and
immediately reflect the x-rays, radiating in all directions. The reflections are treated
similar to simple waves, in which each function will have a different phase since the
36
f(t)
= f cos 2
π
( Φt + α ) (2.3)
or f(t) = f sin 2
π
( Φt + α ) (2.4)
where f is the amplitude of the wave, Φ is the frequency, and α is the phase. A phase is
the difference in position of the crests of two waves of the same wavelength traveling in
the same direction. In the x-ray experiment, the intensity I = f*f of the scattered wave
can be measured during data collection; however the phase information is lost.
The x-ray structure factor Fhkl represents the amplitude of the diffracted x-rays
resulting from the sum of the scattering from all of the atoms in the direction defined by
the Miller indices, hkl. Reflection Fhkl is calculated: atoms
F
hkl=
∑
f
jexp[2
π
i(hx
j+ky
j+lz
j)] (2.5)
j=1or
F = |F| e
iα(2.6)
As mentioned, the structure factor that describes reflection hkl is a Fourier series of
atomic structure factors in which each term is the contribution of each atom in the unit
cell, with is own amplitude, fj, whose frequency is h in the x-direction, k in the
y-direction, and l in the z-direction. For each possible set of values h, k, and l, the
associated wave has amplitude Fhkl and phase αhkl. The exponential term having both
37
Since a single crystal has three-dimensional translational symmetry, it reduces
the problem to a study of the electron density of the unit cell, rather than the entire
crystal. The relationship that exists between the structure factor and the atomic
coordinates is that the structure factor is the Fourier transform of the electron density:
F
hkl= ∫ ρ(x,y,z) exp[2
π
i(hx +ky +lz)] dV (2.7)
V
where V is the unit-cell volume. The inverse Fourier transform is
ρ(
xyz
) = (1/V) Σ
F
hklexp [-
2π
i (hx + ky + lz)] (2.7)
which means that the electron density (ρ) at any point (x,y,z) in the unit cell can be
computed by summing over all structure factors (F), measured at the diffraction points
identified by the integers h,k,l. By calculating the electron density of the unit cell, the
atom positons can be found.
The x-ray structure factor Fhkl, is a complex number and can be expressed in
terms of its amplitude and phase,
F
hkl= |F
hkl| exp(2
π
iα
hkl) (2.8).
Although we know how to calculate the electron density from Fhkl, only the indices of
each reflection and its intensity are measured. The phase of Fhkl is lost during data
collection. The phase is needed to calculate the electron density, hence the notorious
38
There are several techniques to estimate approximate phases, and from them
calculate initial electron density maps. One of the first methods developed was the
heavy atom method. This method requires the presence of a single or small number of
heavy atoms whose positions can be determined using of Fourier series summation
with coefficients (Fhkl)2 (the Patterson function). In recent years, the heavy atom
method has been largely replaced by “Direct Method” techniques to solve the phase
problem. Direct methods techniques rely on statistical relationships between the x-ray
structure factors magnitudes that exist because the electron density is a function that
must be everywhere equal to or greater than zero31. Some relief is given to the phase
problem if the crystal structure is centrosymmetric (i.e., for every point (x, y, z) in the
unit cell there is an indistinguishable point (-x, -y, -z)), then the phase is either positive
or negative (α = 0o
or 180o). The phases are determined by statistical relationships
between certain reflections, the highest in amplitude having the most weight.
In multiple solution methods, the phases of a small number of normalized
structure factors, Ehkl, are arbitrarily assigned positive or negative values. According to
the principle of positivity, the signs of three reflections are related by:
s(h
1, k
1, l
1)s(h
2, k
2, l
2) ≈ s(h
1+ h
2, + k
1+ k
2, l
1+ l
2) (2.9)
where the three reflections are chosen such that the indices of the third are the sums of
h’s, k’s, and l’s of the first and second reflections. The phase of the third reflection is
equal to the product of the phases of the other two reflections, with a probability that can
be calculated. All possible combinations of the starting set phases are used, and as
39
generate a set of E-maps, which are normalized electron density maps of estimated
atomic positions for each set of possible initial phases. Usually, one of the phase sets
will be more self-consistent that the others, and the resulting E map usually contains the
correct molecular structure. If not, another phase set may be chosen. After initial
positions of the atoms are located in the E map, better estimates of the atomic positions
can be obtained by least-squares refinement. In this study, since the molecule did not
contain any heavy atoms, direct methods were used to determine the initial phases, and
all non-hydrogen atoms were located in a subsequent E map.
40 2.7 The Crystallography Project
The major steps in determining the crystal structure of ethylene glycol
bis(tropane-3-carboxylate) included:
1. Unit cell determination
2. Data Collection
3. Integration of intensity
4. Generation of a trial structure
5. Refinement of the Crystal Structure
a. Unit cell determination
Knowing the unit cell dimensions prior to data collection is essential to devising a
strategy that will give us as many identifiable (by index) measurable reflections as
possible. It also indicates whether or not the crystal is actually suitable for further data
collection. For example, if the crystal is a weak scatterer of x-rays, should the crystal be
discarded, or will the study be successful if longer than usual exposure times are used.
Once a crystal is chosen and mounted for data collection, a suite of computer programs
is available to perform the formerly arduous task of structure determination. SMART is
a part of a suite of programs included with the Bruker AXS SMART CCD-based X-ray
crystallographic system30. This online program controls the x-ray diffractometer in order
to collect the diffraction data used by the other programs in the system. SMART
controls the x-ray shutter, and crystal orientation setting angles 2-Theta, Omega, and
41
After verifying detector calibration files, the crystal is mounted and 512 X 512 pixel
images (frames) are collected (Figure 2.8). A frame is a 0.3° scan about the omega
axis; for preliminary scans to determine unit cell values, a ten second frame is suitable.
Typically, 3 scans of 25 frames are collected at different phi and theta angles to sample
reflections in different regions of reciprocal space. During the scan, a low temperature
system directs a stream of cold nitrogen gas over the crystal. This decreases the
amplitude of atomic vibrations in the crystal, which increases the intensity of x-ray
scattering, especially at high scattering angles. After the initial scan, the SMART
program searches the frame data for intensity maxima (reflections) and determines the
precise angles at which the scattering occurs. This information is used to determine the
translational symmetry of the reciprocal lattice, which determines the orientation and
dimensions of the crystallographic unit cell. Integer values of h, k, and l are then
assigned to each reflection (indexing). Least-squares refinement of the observed
setting angles yields unit cell dimensions (with estimated standard deviations) and
crystal orientation parameters which give the best fit to the x-ray observations. Based
on the unit cell dimensions, a tentative selection of the Bravais lattice type is usually
made. The unit cell parameters and orientation matrix are written to a .p4p file for
subsequent use by the other structure determination programs. Part of the .p4p output
42
43
Figure 2.8. 512 X 512 pixel image. Image obtained from the actual data collected from crystal
Table 2.2. Summary of Unit Cell Parameters and Observed Reflections
Molecular formula C19, H29, N2, O4
Unit Cell Length a = 10.1416 Ǻ (0.0050)
b = 7.6962 Ǻ (0.0041) c = 24.8890 Ǻ (0.0111)
Unit Cell Angles α = 90.0000 (0.0417)
β = 91.2301 (0.0442) γ = 90.0000 (0.0523)
Volume of Unit Cell, 1942.204 Ǻ3 (2.029)
Orientation Matrix:
44
Radiation Type Molybdenum λ = 0.71073 Ǻ
Source Power 50.00 kV, 16.00 mA
Crystal Color Colorless
Crystal Size 0.26 mm 0.08mm 0.03mm
Data Collection Temperature -123° C
X, Y Beam Center 247.2860 261.4540
Crystal Lattice Monoclinic (b-unique) Primitive
Observed Reflections:
H K L 2-Theta Omega Phi Chi Intensity I/sig
6 3 1 332.00 327.398 0 54.799 2372.3 42.0
1 -3 -10 332.00 329.165 0 54.799 76950 244.0
-1 1 0 332.00 328.595 0 54.799 89442 264.0
5 1 8 332.00 329.974 0 54.799 34828 163.3
3 -1 2 332.00 330.673 0 54.799 44137 185.0
4 -4 -10 332.00 329.828 0 54.799 11776 94.9
6 -4 -8 332.00 330.518 0 54.799 7593.9 76.0
4 -2 0 330.29 330.292 0 54.799 24404 137.3
8 2 10 332.00 330.583 0 54.799 4996.3 61.3
5 -4 -9 332.00 330.521 0 54.799 8041.4 78.3
5 -2 1 332.00 329.829 0 54.799 14447 105.3
0 -3 -15 332.00 330.080 0 54.799 7595.4 75.4
2 -3 -7 332.00 328.760 0 54.799 11586 94.0
3 -4 -11 332.00 328.150 0 54.799 5717.4 65.6
8 -1 5 332.00 329.325 0 54.799 4011.2 54.9
4 -4 -8 332.00 327.048 0 54.799 5317.0 63.3
4 -1 3 332.00 330.688 0 54.799 9151.5 83.6
4 -3 -3 332.00 327.669 0 54.799 5031.8 61.8
9 -2 3 332.00 327.358 0 54.799 958.73 26.6
3 -2 -1 332.00 329.744 0 54.799 1318.9 31.3
8 -4 -8 332.00 331.250 0 54.799 4544.1 58.8
9 -1 4 332.00 331.550 0 54.799 723.33 23.1
5 -3 -2 332.00 327.950 0 54.799 1937.1 38.1