Original Research Article
Triglyceride-Glucose Index Simulation
S. Mehran Hosseini1
1Department of Physiology, Golestan University of Medical Sciences, Gorgan, Iran
ABSTRACT
Introduction: Since its introduction as a marker of insulin resistance, the triglyceride-glucose (TyG) index has increasingly been used in biomedical literature. However, the TyG index formula seems to be calculated in two different ways, which may consequently produce some confusion regarding the normal cut-offs and cause potential errors in comparing different data. This study tries to explore this discrepancy. Materials and Methods: The TyG index was simulated for different ranges of triglyceride (TG) and fasting blood sugar (FBS). The PubMed and Scopus databases were searched for the TyG index. The results were limited to articles that have mentioned the FBS and TG values. The TyG index was recalculated and compared using the reported FBS and TG values in two different ways. Results: The simulated and reported normal cut-off values for the TyG index in the literature were roughly around 4 and 8. This discrepancy was due to different method of calculating the TyG index, and independent from factors such as age, gender and ethnicity of sampled population. Conclusions: In the TyG index formula, the division sign must be moved out of the square bracket. Otherwise, the normal range must be considered around 8. If the normal value of TyG index is reported as 4, its calculation should be referred to a corrected form of the original formula e.g. ln[FBS(mg/dl) × TG (mg/dl)]/2.
KEYWORDS: TyG index, Insulin resistance
*Correspondence: S. Mehran Hosseini, Department of Physiology, Golestan University of Medical Sciences, Gorgan, Iran, Telephone: +98-9113736634, Email: [email protected]
INTRODUCTION
TyG index is a product of fasting blood sugar (FBS) and triglyceride (TG). It has been proposed as a numerical expression of insulin resistance (IR) [1]. The sensitivity and specificity of TyG index can compete with other markers for IR [2-5]. Unlike the homeostasis model
assessment and quantitative insulin
sensitivity check index, insulin is not included in the TyG index [6]. This simplicity has practical outcomes such as better accessibility and less cost that may be important in low-income populations at risk of metabolic syndrome and diabetes [7-9]. However, the age and gender-dependent cut-off values for TyG are not well established. Another issue of the TyG cut-off values is related to its method of computation. Any error in computation must be corrected in order to provide a unique reference that facilitates the comparison of different data. The
TyG index is calculated according to the following equation: ln[FBS(mg/dl) × TG (mg/dl)/2] [1]. Normal cut-off values reported for the TyG in the literature are roughly around 4 and 8 [1-4]. This difference is due to the position of 2 in the TyG formula. Although all studies use the above equation, their numerical calculations are not similar. In fact, most authors seems to compute TyG according to the following formula: ln[FBS(mg/dl) × TG (mg/dl)]/2. This study aimed to compare the simulated and published data using these two formulas.
MATERIALS AND METHODS
The TyG index was simulated for different ranges of TG and FBS using R (Vienna, Austria), a free software environment for statistical computing and
graphic.The ranges of FBS were selected
according to the American Diabetes Association recommendations for normal
(70-110 mg/dl), pre-diabetes or impaired glucose tolerance (100-125 mg/dl) and diabetes (more than 126 mg/dl) values. The Scopus and Pub Med databases were searched for: tyg, tyg index, “TyG index”, triglyceride-glucose index, "triglyceride-glucose index", triglyceride "triglyceride-glucose index" and "triglyceride glucose index" without any time filtering. In unrelated records, tyg was used as an abbreviation for total yield protein, tryptone yeast extract glucose agar, Polski Tygodnik Lekarski and taiyin meridian group. After excluding the unrelated results,
articles were limited to those containing the FBS, TG or TyG values. Overall, eight articles were included in the study. The TyG index was calculated and compared using the reported FBS and TG values in the two formulas.
RESULTS
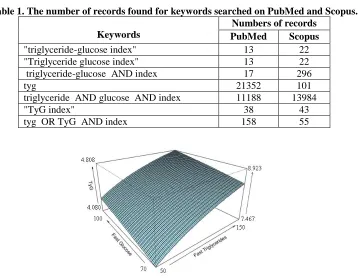
The numbers of articles found for different keywords are shown in table 1. The TyG index simulated for different ranges of TG and FBS are shown in figures 1-4.
Table 1. The number of records found for keywords searched on PubMed and Scopus.
Keywords
Numbers of records PubMed Scopus
"triglyceride-glucose index" 13 22
"Triglyceride glucose index" 13 22
triglyceride-glucose AND index 17 296
tyg 21352 101
triglyceride AND glucose AND index 11188 13984
"TyG index" 38 43
tyg OR TyG AND index 158 55
Figure1. TyG index values simulated for the normal range of FBS. The right vertical axis is scaled based on the original formula.
Figure 2. TyG index values simulated for pre-diabetes or impaired glucose tolerance FBS level. The right vertical axis is scaled based on the original formula.
Figure 3. TyG index values simulated for 70-100 and 150-200 mg/dl of FBS and TG, respectively. The right vertical axis is scaled based on the original formula.
Figure 4. TyG index values simulated for 100-125 and 150-200 mg/dl of FBS and TG, respectively. The right vertical axis is scaled based on the original formula.
The TyG index value simulated for normally proposed TG and FBS series was 7.467-8.923 based on the original formula. Obviously, when the final division in the TyG formula is applied out of the square bracket, these TyG index values fall to around 4.080-4.808. Among the eight articles studied, seven were
published in 2010-13. The original paper
that introduced the TyG index was
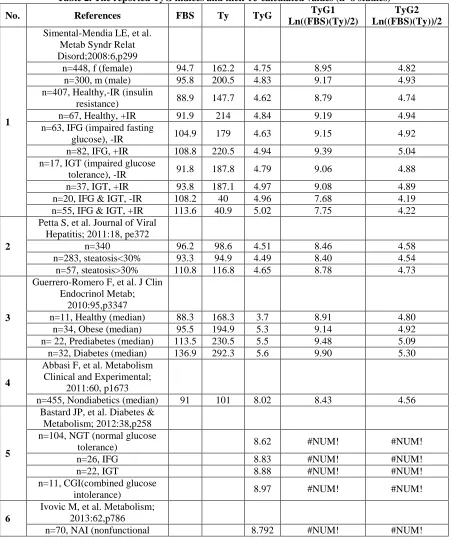
published in 2008, and was later referred by other authors. The normal cut-off values for the TyG index reported in the literature were roughly around 4 and 8, regardless of age, gender and ethnicity (Table 2). The difference between the
reported and calculated values is due to decimal places that were used in the
references, as well as some
transformation of raw data as indicated
for the reference number 8 (Table 2). Here, we round the numbers to two decimal places.
Table 2. The reported TyG indices and their re-calculated values (n=8 studies)
No. References FBS Ty TyG TyG1
Ln((FBS)(Ty)/2)
TyG2 Ln((FBS)(Ty))/2
1
Simental-Mendia LE, et al. Metab Syndr Relat Disord;2008:6,p299
n=448, f (female) 94.7 162.2 4.75 8.95 4.82
n=300, m (male) 95.8 200.5 4.83 9.17 4.93
n=407, Healthy,-IR (insulin
resistance) 88.9 147.7 4.62 8.79 4.74
n=67, Healthy, +IR 91.9 214 4.84 9.19 4.94
n=63, IFG (impaired fasting
glucose), -IR 104.9 179 4.63 9.15 4.92
n=82, IFG, +IR 108.8 220.5 4.94 9.39 5.04
n=17, IGT (impaired glucose
tolerance), -IR 91.8 187.8 4.79 9.06 4.88
n=37, IGT, +IR 93.8 187.1 4.97 9.08 4.89
n=20, IFG & IGT, -IR 108.2 40 4.96 7.68 4.19
n=55, IFG & IGT, +IR 113.6 40.9 5.02 7.75 4.22
2
Petta S, et al. Journal of Viral Hepatitis; 2011:18, pe372
n=340 96.2 98.6 4.51 8.46 4.58
n=283, steatosis<30% 93.3 94.9 4.49 8.40 4.54
n=57, steatosis>30% 110.8 116.8 4.65 8.78 4.73
3
Guerrero-Romero F, et al. J Clin Endocrinol Metab;
2010:95,p3347
n=11, Healthy (median) 88.3 168.3 3.7 8.91 4.80
n=34, Obese (median) 95.5 194.9 5.3 9.14 4.92
n= 22, Prediabetes (median) 113.5 230.5 5.5 9.48 5.09
n=32, Diabetes (median) 136.9 292.3 5.6 9.90 5.30
4
Abbasi F, et al. Metabolism Clinical and Experimental;
2011:60, p1673
n=455, Nondiabetics (median) 91 101 8.02 8.43 4.56
5
Bastard JP, et al. Diabetes & Metabolism; 2012:38,p258 n=104, NGT (normal glucose
tolerance) 8.62 #NUM! #NUM!
n=26, IFG 8.83 #NUM! #NUM!
n=22, IGT 8.88 #NUM! #NUM!
n=11, CGI(combined glucose
intolerance) 8.97 #NUM! #NUM!
6
Ivovic M, et al. Metabolism; 2013:62,p786
n=70, NAI (nonfunctional 8.792 #NUM! #NUM!
adrenal incidentaloma) n=37,SCS (subclinical
Cushing's syndrome) 8.792 #NUM! #NUM!
n=35, HC (healthy control) 8.433 #NUM! #NUM!
7
Mericq V, et al. Hormone Research in Pediatrics; 2013:79,
p 88
n= 12, SW (steroid withdrawal) 3.8 #NUM! #NUM!
n=12, SC (steroid control) 4 #NUM! #NUM!
8
Irace C, et al. Int J Clin Pract; 2013:67,p665 n=187, m (Tys were
log-transformed before analysis) 102 142 3.8 8.89 4.79
n=143, f (Tys were
log-transformed before analysis) 96 122 3.7 8.675 4.68
”TyG” is the value reported in the references. TyG1 and TyG2 are re-calculated values based on the original and modified formula. #NUM! : The TyG1 and TyG2 could not be calculated because the pre-requested
values were not reported in references 5-7.
DISCUSSION
This brief survey explored a simple but potentially important inconsistency about the TyG index value. In the TyG index formula, the division should be moved out of the square bracket. Otherwise, the normal range should be considered around 8. If the normal value of TyG index is regarded as 4, it should be referred to a modified form of the original formula i.e. ln[FBS(mg/dl) × TG (mg/dl)]/2 . While the dependence of TyG index to age and gender has been well documented, the wide observed discrepancy between TyG1 and TyG2 values in table 2 (~4 and ~8) is related to the different method of calculation. Only a limited numbers of studies have correctly computed and reported the TyG index according to its original formula. In these cases, the TyG index values were roughly around 8 [3, 5, 11]. Since most studies have reported the TyG index value ~4 [1-2, 7-8, 10], it is recommended to refer the values to a modified form of the original formula. Otherwise, the numerical differences will be inevitable.
REFERENCES
1. Simental-Mendía LE, Rodríguez-Morán
M, Guerrero-Romero F. The product of
fasting glucose and triglycerides as
surrogate for identifying insulin resistance in apparently healthy subjects. Metab Syndr Relat Disord 2008; 6(4):299-304.
2. Guerrero-Romero F, Simental-Mendía LE, González-Ortiz M, Martínez-Abundis E, Ramos-Zavala MG, Hernández-González SO, Jacques-Camarena O, Rodríguez-Morán M. The product of triglycerides and glucose, a simple measure of insulin sensitivity.
Comparison with the
euglycemic-hyperinsulinemic clamp. . J Clin Endocrinol Metab 2010; 95(7):3347-3351.
3. Abbasi F, Reaven GM. Comparison of two methods using plasma triglyceride concentration as a surrogate estimate of insulin action in nondiabetic subjects:
triglycerides × glucose versus
triglyceride/high-density lipoprotein
cholesterol. Metabolism 2011; 60(12):1673-1676.
4. Vasques AC, Novaes FS, de Oliveira Mda S, Souza JR, Yamanaka A, Pareja JC, Tambascia MA, Saad MJ, Geloneze B (2011) TyG index performs better than HOMA in a Brazilian population: a
hyperglycemic clamp validated study.
Diabetes Res Clin Pract Sep;93(3):e98-e100. 5. Ivović M, Marina LV, Vujović S,
Gajić M, Stojanović M, Radonjić NV, Gajić M, Soldatović I, Micić D. Nondiabetic patients with either subclinical Cushing's or nonfunctional adrenal incidentalomas have lower insulin sensitivity than healthy controls: clinical implications. Metabolism 2013; 62(6):786-792.
6. Borali A, Livingstone C, Kaddam I, Ferns G. Selection of the appropriate method for the assessment of insulin resistance.BMC Medical Research Methodology 2011; 11:158-168.
7. Irace C, Carallo C, Scavelli FB, De Franceschi MS, Esposito T, Tripolino C, Gnasso A. Markers of insulin resistance and carotid atherosclerosis. A comparison of the
homeostasis model assessment and
triglyceride glucose index. Int J Clin Pract 2013; 67(7):665-672.
8. Petta S, Di Marco V, Di Stefano R, Cabibi D, Cammà C, Marchesini G, Craxì A. TyG index, HOMA score and viral load in patients with chronic hepatitis C due to genotype 1. J Viral Hepat 2011; 18(7):e372-380.
9. Lucatello F, Vigna L, Carugno M, Tirelli AS, Bertazzi PA, Riboldi L. Comparison of indexes for assessing insulin resistance for the health surveillance among workers. G Ital Med Lav Ergon 2012; 34(3 Suppl):748-749.
10. Mericq V, Salas P, Pinto V, Cano F, Reyes L, Brown K, Gonzalez M, Michea L, Delgado I, Delucchi A. Steroid withdrawal in pediatric kidney transplant allows better growth, lipids and body composition: a randomized controlled trial. Horm Res Paediatr 2013; 79(2):88-96.
11. Bastard JP, Lavoie ME, Messier V,
Prud'homme D, Rabasa-Lhoret R.
Evaluation of two new surrogate indices including parameters not using insulin to assess insulin sensitivity/resistance in non-diabetic postmenopausal women: a MONET
group study. Diabetes Metab 2012;
38(3):258-263.