Implementation of quadratic dose protocol for
18F-FDG whole-body
PET imaging using a BGO-based PET/CT scanner, GE Discovery ST
Marianie Musarudin
1, Haniff Shazwan Muhammad Safwan Selvam
1,
Mohamad Aminudin Said
21
School of Health Sciences, Health Campus, Universiti Sains Malaysia, Kelantan, Malaysia
2Nuclear Medicine Department, Institut Kanser Negara, Putrajaya, Malaysia
(Received 11 June 2018, Revised 7 February 2019, Accepted 10 February 2019)
ABSTRACT
Introduction: The ability of quadratic dose protocol to maintain a good quality image for an overweight and obese patient is well reported. However, a practical approach to the implementation of this protocol in whole-body imaging in Malaysia is currently lacking. Hence, the aim of this study is to derive the quadratic dose formula that suits our PET system.
Methods: Whole-body PET imaging protocol was performed using NEMA 2012/IEC 2008 phantom. Two dose protocols were adhered, namely linear and quadratic dose protocol. A PET Discovery ST, which is BGO-based PET system was used in this study. This study was guided by technical guidelines published by Koopman et al. Finally, a comparative analysis between the effective dose yielded by linear and quadratic dose protocols was performed.
Results:Implementation of quadratic dose protocol using our PET system lengthen the scanning time to 226 s, as compared to 150 s currently used in the linear dose protocol. Meanwhile, the findings revealed that the quadratic dose protocol led to a greater effective dose for the body weight of 62 kg and above. These findings were observed in all the five groups of patient studied.
Conclusion: In conclusion, a successful trial of the quadratic dose protocol on our PET system has been established. Despite the long acquisition time and greater effective dose, implementation of quadratic dose protocol is necessary for better quantification of the image, as well as ensuring constant image quality across all patients, especially overweight and obese patients.
Key words:18F-FDG; PET protocol; Quadratic dose
Iran J Nucl Med 2019;27(2):73-80 Published: July, 2019
http://irjnm.tums.ac.ir
Corresponding author:Marianie Musarudin, School of Health Sciences, Health Campus, Universiti Sains Malaysia, 16150 Kubang Kerian, Kelantan, Malaysia. E-mail: [email protected]
O
rigi
na
l A
rticl
Ir
an
J
N
u
cl
Me
d
20
1
9
,
V
ol
27,
No
2
(
S
er
ial
N
o
53
)
h
tt
p:
//
ir
jn
m
.tu
m
s.a
c.ir
Ju
ly
,
20
19
74
INTRODUCTION
The advantages of PET and PET/CT in oncology for specific clinical conditions such as tumor staging, monitoring of response to therapy and prediction of prognosis in a variety of tumors have been proven. Over the past 15 years, PET with CT techniques has revolutionized the care of cancer patients in many developed countries and is being adopted in emerging economies. PET/CT is expanding rapidly in many countries and has quickly established its place in the diagnosis and management of several prominent diseases.
Alas, imaging with PET susceptible to the patient’s body weight related problems. The increment of the patient’s body weight leads to degradation of PET image quality. This is due to the increase in photon attenuation and photon scattering interaction as the size of the patient’s body increases. It is known that the probability of Compton scattering covers a relatively broad area for the lower atomic number of materials. Unfortunately, the human body, which highly contributes by the lower atomic number of materials causes the Compton interaction to dominate [1]. Accordingly, imaging of a relatively large patient contributes to high fraction of scattered data, thus resulting in noisy image [2].
Several methods have been proposed to overcome such a problem [2-9]. Examples of such methods are the prescribed source activity per body weight, acquisition time, time-of-flight (TOF) data acquisition and depth-of-interaction (DOI) method. Of these, the most commonly used solution to confront the effects of the patient’s body in PET imaging is the prescribed dose per body weight. Some studies did recommended higher FDG dose per body weight to maintain the image quality [10, 11]. The linear relationship between the patient’s body mass and prescribed dose had been documented in the European Association of Nuclear Medicine (EANM) guidelines. However, clinical practice has confirmed that the linear relationship between the patient’s body mass and the prescribed dose does not necessarily result in good quality images, especially for the obese patients [9]. Indeed, a study revealed that the greater dose per body weight was not able to improve the PET image quality in the overweight patient [6]. In another study, a constant dose injected in a different patient’s body weight also showed a similar trend, where image degradation was observed in the overweight patient [2]. The current practice that has been proven to maintain the quality of PET images across the patients is the quadratic injected dose [9]. This method is capable of producing a better signal-to-noise ratio (SNR) for the overweight and obese patient compared to the constant or linear dose, which is usually practiced by many institutions. The current practice for the fluorine-18 fluorodeoxyglucose (18F-FDG) whole-body imaging
at our institution is the linear dose protocol. The patient is injected with 5 MBq per kg of body weight. Even with the advantages offered by the quadratic dose protocol, it is still not the preferred method among the nuclear medicine centers here. This is probably due to the lack of practical approach in the implementation of the quadratic dose protocol in Malaysia. In accordance with that, this study was conducted at Institut Kanser Negara (IKN) by adhering to the technical guidance proposed by Koopman et al. to derive a quadratic dose formula [12]. At the end of this study, the 18F-FDG administrated and patient’s effective dose resulted from quadratic dose protocol were compared with the linear dose protocol currently practiced at IKN.
METHODS
Patient-specific 18F-FDG activity image acquisition
The aim of PET imaging is to obtain a consistent quality of images across all patients. In emission imaging, the quality of images is dependent on the total number of counts acquired, which in turn depends on various factors, including the efficiency of a scanner, administered activity, acquisition time and the size of the patient’s body [6, 7, 9, 13, 14]. In accordance with that, the amount of activity administered to the patient’s body is usually relies on the body weight of the patient, which is known as the patient-specific 18F-FDG activity.
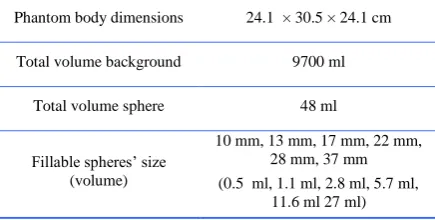
In this study, the image acquisition was carried out using a NEMA 2012/IEC 2008 PET phantom. The literature reveals that this commercial PET phantom presents a normal patient’s body [15]. Therefore, imaging of this phantom yields the data that representing a normal BMI patient. This phantom in essence consists of two major compartments, i.e. background and six spheres for lesion. The technical specification of NEMA 2012/IEC 2008 phantom is tabulated in Table 1.
Table 1: Technical specification of NEMA 2012/IEC 2008 phantom.
Phantom body dimensions 24.1 × 30.5 × 24.1 cm
Total volume background 9700 ml
Total volume sphere 48 ml
Fillable spheres’ size (volume)
10 mm, 13 mm, 17 mm, 22 mm, 28 mm, 37 mm
(0.5 ml, 1.1 ml, 2.8 ml, 5.7 ml, 11.6 ml 27 ml)
CT-Ir
an
J
N
u
cl
Me
d
20
1
9
,
V
ol
27,
No
2
(
S
er
ial
N
o
53
)
h
tt
p:
//
ir
jn
m
.tu
m
s.a
c.ir
Ju
ly
,
20
19
75
scanner, 24 detector rings PET scanner. The detector for PET is the BGO crystal. Derivation of the patient-specific 18F-FDG was adhered to the recommendation described by Koopman et al. [12]. According to this guideline, the spheres and background need to be filled with 2 kBq/ml and 20 kBq/ml of 18F-FDG activity respectively. All images were acquired by adhering to the standard whole-body nuclear medicine protocols practices at IKN. The phantom was positioned on the bed scanner with the center of each sphere located in a single transverse plane and at the center of the axial FOV (Figure 1).
Fig 1. NEMA 2012/IEC 2008 phantom positioning during the image acquisition using the GE Discovery ST.
Whole-body PET/CT phantom imaging were performed for different scan times, ranging from 1.5 minutes to 10 minutes. The images were then reconstructed using a fully 3D ordered subset expectation maximization (OSEM) algorithm due to superior noise characteristics provided by this algorithm compared to the conventional FBP algorithm. Two iterations and 21 subsets, with the standard Gaussian post-filters with 6.0 mm FWHM were used during the image reconstruction. The scatter, random, dead time, attenuation and normalization corrections were incorporated into the iterative reconstruction scheme [16]. PMOD 3.7 medical imaging analysis software was finally used to register and hence analyze the images.
Verification to EARL Standard
It should be noted that there are two demands needed to be fulfilled in the derivation of the quadratic dose equation for the whole-body PET imaging. First, multiplication of 18F-FDG activity and scan time per bed position should result in a quadratic relationship to a patient’s body weight. Second, the specification of recovery coefficients (RC) as described by European Research Ltd (EARL) should be satisfied. In accordance with that, verification of the RC value measured on the reconstructed image was performed. Comparison with the value tabulated by the EARL guideline was then established. This step was performed by comparing the value of RC measured on
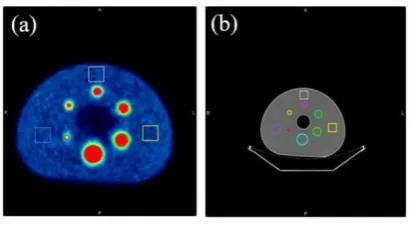
the image acquired using 10 minutes and Tmin (minimal scan time per bed position) image acquisition. This verification was necessary to assure that the RC measured on our PET image would meet the recommendation given by the European guideline. Two different RC values were calculated: RCmax and RCmean. The correction for the 18F-FDG activity decay is necessary at this stage. In this case, the correction was performed by correcting for the decay of activity as a result of time difference during the phantom preparation and phantom scanning. The RCmax value was calculated by the ratio between the maximum pixel values of the sphere on the reconstructed PET image, to the true FDG activity in the sphere. Meanwhile, RCmean was represented by the ratio between mean pixel values within a volume of interest (VOI) to the true FDG activity in the sphere. The selected VOI only included the voxels with values that include 50% of the maximum pixel value and also corrected for background uptake. Outlining of the sphere was done manually by contouring slices in which the sphere was visible. Definition of the sphere VOI was performed with the consideration and hence the guidance of CT image information. Figure 2 demonstrates the tumor volume definition as well as background region of interest (ROI) for the RC calculation.
Fig 2. The PET/CT images of the NEMA 2012/IEC 2008 phantom. (a) Axial PET (b) attenuation CT images of phantom. The square illustrates the three ROIs in an axial plane used to determine the COV.
Derivation of a patient-specific 18F-FDG activity formula
After verification of the RC to the value recommended by EARL, derivation of the Tmin value was performed. Using the series of reconstructed images, the coefficient of variation (COV) values was extracted from the reconstructed images of each scan time. The COV was calculated by the ratio between the standard deviation (σ) to the mean pixel value of the ROI defined in the background area (Equation 1).
𝐶𝑂𝑉 = 𝜎𝑅𝑂𝐼
Ir
an
J
N
u
cl
Me
d
20
1
9
,
V
ol
27,
No
2
(
S
er
ial
N
o
53
)
h
tt
p:
//
ir
jn
m
.tu
m
s.a
c.ir
Ju
ly
,
20
19
76
The measured COV as a function of the acquisition time curve was then plotted. Interpolation of the respective curve at 15% COV gave the value of Tmin. Substitution of the Tmin value to the equation derived by Koopman et al. resulted in the patient-specific 18 F-FDG activity to be administrated to the specific body weight of patients. The respective equation is described in Equation 2, whereby the product of 𝐴 . 𝑡
refers to the 18F-FDG activity in MBq and the scan time in seconds (t) practices in the clinical setting. Meanwhile, EARL recommended that the weight reference (𝑤𝑟𝑒𝑓) of 75 kg and activity reference
(𝐴𝑟𝑒𝑓) of 300 MBq was considered for the calculation.
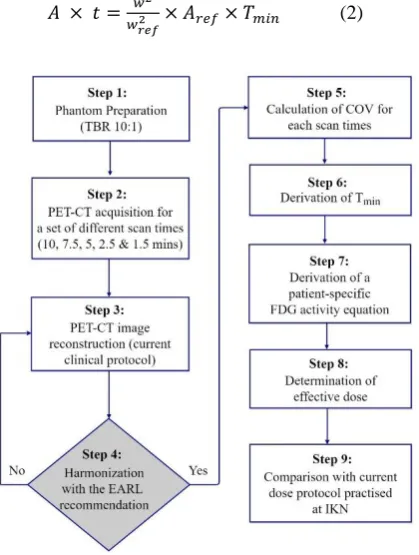
The steps to derive the quadratic dose are summarized in the flowchart shown in Figure 3.
𝐴 × 𝑡 = 𝑤2
𝑤𝑟𝑒𝑓2 × 𝐴𝑟𝑒𝑓× 𝑇𝑚𝑖𝑛 (2)
Fig 3. The summary of the steps performed to implement the quadratic dose protocol at our institution.
Estimation of effective dose for quadratic and linear dose protocol
Generally, the effective dose represents the stochastic health risk to the whole body, which is the probability of cancer induction and genetic effects of low levels of ionizing radiation. It is calculated by the tissue weighted sum of the equivalent doses in all specified tissues and organs of the human body. The effective dose (DE) of 18F-FDG to the patients can be calculated
by using the dose coefficients as recommended by the ICRP Publication 106 for a variety of organs and tissues of the adult hermaphrodite MIRD phantom. The respective parameter is described in Equation 3.
𝐷𝐸= 𝐴 × 𝑇𝑇𝐹𝐷𝐺 (3)
Whereby A refers to 18F-FDG radioactivity administrated to the patients and 𝑇𝑇𝐹𝐷𝐺 refers to the
constant value from ICRP publications 103. The effective dose for five groups of patient were estimated in this study. The groups included adult, 15 years, 10 years, 5 years, and 1-year patient. At our center, the 18F-FDG PET scans performed on children are quite common. To date, the age of the children presented to our center for 18F-FDG PET scan is in the range of two to 10 years old. In accordance with that, we also considered this group of patients in our study. Effective doses per unit activity administered of 0.019, 0.024, 0.037, 0.056 and 0.095 mSv MBq-1 were substituted in Equation 3 for each of the patient groups respectively. Finally, the quadratic activity dose protocol was determined and compared with the linear dose protocol for the respective ranges of body weight. Comparison of the total activity and effective dose was established in this study.
RESULTS EARL RC verification
The results of EARL RC verification are tabulated in Table 2.
Table 2: The RCs measured at time per bed scan at, t=600 s and t= 226 seconds.
Sphere volume (ml)
RCmean RCmax
EARL t = 600 s t=226 s EARL t = 600 s t=226 s
27.01 0.76-0.89 0.72 0.78 0.95-1.16 1.05 1.10
11.54 0.72-0.85 0.65* 0.71* 0.91-1.13 1.04 1.14*
5.60 0.63-0.78 0.60* 0.65 0.83-1.09 1.03 1.06
2.73 0.57-0.73 0.56* 0.54* 0.73-1.01 0.95 0.95
1.20 0.44-0.60 0.47 0.47 0.59-0.85 0.82 0.81
0.49 0.27-0.43 0.30 0.31 0.34-0.57 0.50 0.43
Ir
an
J
N
u
cl
Me
d
20
1
9
,
V
ol
27,
No
2
(
S
er
ial
N
o
53
)
h
tt
p:
//
ir
jn
m
.tu
m
s.a
c.ir
Ju
ly
,
20
19
77
The RCmean and RCmax are the two parameters recommended for the analyses. The results showed that several RC values measured on the image obtained by our system did not meet the recommended value tabulated by the EARL. The maximal difference of RCmean obtained by our system was 9.7% less than the minimal range specified by EARL. Meanwhile, the maximal difference of RCmax value was larger by 0.9% from the maximal value recommended by EARL. Most of the measured values, nevertheless, met the recommendation by EARL. 75.0% of them were recorded within the recommended range specified by the EARL.
Derivation of Tmin
In Figure 4, the values of calculated COV as a function of acquisition time are shown. The relationship between the measured COV and scan time is represented by the power law function. In this study, the power-law fit resulted in COV equal to 2.641 𝑇−0.53. The coefficient of determination, R2
of 0.97 shows that the fitted function is well represented the raw data. The close value of R2 value
to one indicates a good fit of the power law trend line to the data. Interpolation of the curve at COVmax equal to 0.15 gave Tmin value of 226 seconds.
Fig 4. Comparison of COV in the phantom background compartment measured at different scan durations.
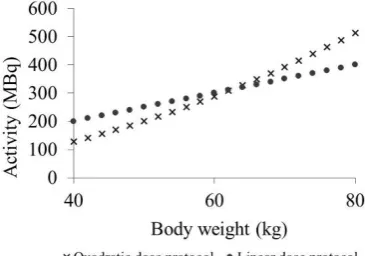
Derivation of a patient-specific 18F-FDG activity
The quadratic dose of 18F-FDG activity calculated using Equation 2 for various patient’s body weight is shown in Figure 5. The results showed that the total activity required for the whole-body imaging using the two dose protocols increases with the increment of the patient’s body weight. The linear relationship between the patient’s body weight and 18F-FDG activity is clearly represented by the linear dose protocol. The 18F-FDG activity was calculated using quadratic dose protocol started to exceed the value recommended by
the linear dose protocol at the body weight of 62 kg. Hence, quadratic dose protocol requires more 18 F-FDG activity than the linear dose protocol beyond the respective point.
Fig 5. Comparison of the FDG activity yielded by the implementation of quadratic and linear dose protocol using PET Discovery ST.
Estimation of effective dose
Figure 6 represents the effective dose estimated from both quadratic and linear dose protocols for adult, 15 years, 10 years, 5 years and 1-year patient. For the five groups of patient studied, the effective dose increased rapidly with the increment of body weight when the linear dose protocol was implemented. Meanwhile, slow increment of effective dose was observed for the quadratic dose protocol. Nevertheless, the two curves intersect at body weight of 62 kg. The 62 kg intersection was consistently observed in all groups of patient investigated. Beyond that point, the quadratic dose protocol led to a greater effective dose for all the patient groups studied.
DISCUSSION
Ir
an
J
N
u
cl
Me
d
20
1
9
,
V
ol
27,
No
2
(
S
er
ial
N
o
53
)
h
tt
p:
//
ir
jn
m
.tu
m
s.a
c.ir
Ju
ly
,
20
19
78
(a) (b)
(c) (d)
(e)
Fig 6. Effective dose estimated from both protocols against body weight (a) 1-year (b) 5 years (c) 10 years (d) 15 years (e) adult patients.
Our findings showed that some of the RCs value obtained during the EARL verification step was slightly lower and higher than the range recommended by EARL. These deviations were possibly due to the small error during the definition of the VOI which was done based on the CT information. However, these data are still acceptable provided that the following
Ir
an
J
N
u
cl
Me
d
20
1
9
,
V
ol
27,
No
2
(
S
er
ial
N
o
53
)
h
tt
p:
//
ir
jn
m
.tu
m
s.a
c.ir
Ju
ly
,
20
19
79
RC specifications is the statistical uncertainties for the shorter scan duration.
Derivation of quadratic dose, as described by Equation 2, reveals that information on the minimal time for the scanning is necessary for this purpose. In this case, the guideline on the Tmin derivation was adhered. According to the guideline, there are two ways to determine the Tmin. One of the methods is by interpolation of the measured COV as a function of acquisition time at 15% COV, which was performed in this study [12]. It was chosen due to the reason that COVmax should remain below 15% to keep the image quality and quantification accuracy within acceptable limits [3]. The power-law function is assumed to well fit the data, considering that the noise properties in PET generally can be represented by Poisson model. Nevertheless, it is known that the COV measured in the reconstructed data could be influenced by the detector dead time, normalization, attenuation correction or the reconstructed algorithm [17]. However, the 0.97 value of the coefficient of determination shows that the power-law fit our data well. Alternatively, the Tmin could be calculated using Equation 4. Substitution of a and b coefficient of the power-law function fitted to the curve gave the similar Tmin value.
𝑇𝑚𝑖𝑛 = ( 𝑎
𝑐𝑜𝑣𝑚𝑎𝑥)
1
𝑏×[𝐵𝑡𝑟𝑢𝑒]
2.0 (4)
Implementation of quadratic dose protocol using our PET system required longer Tmin than we had expected, i.e. 226 seconds compared to 150 seconds. This is due to the technology in the existing PET/CT scanner, which uses bismuth germinate (BGO) crystal detector. Meanwhile, the studies by previous researchers were performed using much faster PET crystal detector, which is cerium doped-gadolinium oxyorthosilicate (Gd2SiO5) or LSO with TOF technology [9, 12]. In PET detection, inorganic scintillation crystal is used to record the gamma rays produced following the annihilation of positrons emitted by the injected tracers. The ultimate performance of the camera is strongly tied to both physical and scintillation properties of the crystal. Both BGO and LSO have excellent physical properties for annihilation photon detections [18]. Both detectors have high density, high effective atomic number that results in efficient detection of gamma rays. However, LSO offers the best combination of properties for PET of any scintillator known today [10]. Furthermore, BGO has one significant weakness which is relatively long decay constant (300 ns) that limits the coincidence timing resolution. Hence, longer time is required to acquire sufficient detection on BGO crystal compared to the LSO. This is why in our case, the scanner with BGO crystal took a longer time to achieve COVmax compared to the LSO crystal. It should be noted that though our PET scanner has been used for many years without TOF system,
implementation of the quadratic dose protocol using this system is still possible.
In this study, the image acquisition was carried out using a NEMA 2012/IEC 2008 PET phantom. Given that this phantom is representing a normal body weight patient, thus, we did not consider for the assessment of the image quality in this study. We recommended that future works be done using phantoms that representing an overweight and obese patient. Hence, evaluation of the image quality obtained using these overweight and obese phantoms is more meaningful in presenting the effect of the quadratic dose protocol.
Effective dose estimation from both dose protocols was calculated using the whole body effective dose coefficient values published by ICRP Publication 128. Comparison between the two protocols was done for the adult, 15 years, 10 years, 5 years and 1-year patient. According to the findings shown in Figure 6, implementation of the quadratic dose protocol for the patient below than 62 kg would lower the effective dose as compared to the linear dose protocol. Even though a quadratic dose protocol led to greater effective dose to the patient greater than 62 kg, it is worth noting that the effective dose was not the only benchmark for implementation of this quadratic dose protocol. In addition to effective dose, the other factor that should be considered for implementation of this protocol is the image quality. It is known that the quadratic dose protocol results in higher dose compared to the linear and constant dose protocol because of the quadratic relationship itself [9]. By using a quadratic dose protocol, the scanning time in our center was longer up to 50% compared with the current method. Nevertheless, this disadvantage could be accepted, given that a consistent quality of the image would be obtained. In addition, patients with a body weight of 62 kg and less would receive a lower effective dose as well as good quality of image.
CONCLUSION
Ir
an
J
N
u
cl
Me
d
20
1
9
,
V
ol
27,
No
2
(
S
er
ial
N
o
53
)
h
tt
p:
//
ir
jn
m
.tu
m
s.a
c.ir
Ju
ly
,
20
19
80
eventually needs more time for data acquisition. In addition to that, the implementation of this protocol led to a lower effective dose to the patient with a body weight of 62 kg and less. Despite the long acquisition time and greater effective dose offers by the quadratic dose protocol (for the patient greater than 62 kg), implementation of this protocol is necessary for better quantification of the image especially for the overweight and obese patient. In line with the principle of radiation protection systems, the benefit that will be yielded by the implementation of this protocol exceeds the said deficiencies. In addition, the image quality for the overweight and obese patient will also be improved. Hence, implementation of this protocol is necessary for more constant image quality across all patients.
Acknowledgments
We would like to thank Universiti Sains Malaysia and Institut Kanser Negara. This research registered with Malaysia National Medical Research Register NMRR-17-2594-38080.
REFERENCES
1. Reilly D, Ensslin N, Smith HJr, Nelson G, Kreiner S. Passive nondestructive assay of nuclear materials. Washington, DC: Los Alamos National Laboratory; 1991.
2. Nagaki A, Onoguchi M, Matsutomo N. Patient weight-based acquisition protocols to optimize (18)F-FDG PET/CT image quality. J Nucl Med Technol. 2011 Jun;39(2):72-6.
3. Boellaard R, O'Doherty MJ, Weber WA, Mottaghy FM, Lonsdale MN, Stroobants SG, Oyen WJ, Kotzerke J, Hoekstra OS, Pruim J, Marsden PK, Tatsch K, Hoekstra CJ, Visser EP, Arends B, Verzijlbergen FJ, Zijlstra JM, Comans EF, Lammertsma AA, Paans AM, Willemsen AT, Beyer T, Bockisch A, Schaefer-Prokop C, Delbeke D, Baum RP, Chiti A, Krause BJ. FDG PET and PET/CT: EANM procedure guidelines for tumour PET imaging: version 1.0. Eur J Nucl Med Mol Imaging. 2010 Jan;37(1):181-200.
4. Cheng DW, Ersahin D, Staib LH, Della Latta D, Giorgetti A, d'Errico F. Using SUV as a guide to 18F-FDG dose
reduction. J Nucl Med. 2014 Dec;55(12):1998-2002.
5. Ghanem MA, Kazim NA, Elgazzar AH. Impact of obesity on nuclear medicine imaging. J Nucl Med Technol. 2011 Mar;39(1):40-50.
6. Masuda Y, Kondo C, Matsuo Y, Uetani M, Kusakabe K. Comparison of imaging protocols for 18F-FDG PET/CT in
overweight patients: optimizing scan duration versus administered dose. J Nucl Med. 2009 Jun;50(6):844-8.
7. Yoshida E, Kitamura K, Nishikido F, Shibuya K, Hasegawa T, Yamaya T, Inadama N, Murayama H. Feasibility study of a highly sensitive LaBr3 PET scanner based on the
DOI-dependent extended-energy window. Nucl Instrum Methods Phys Res A. 2009;604(1-2):363-5.
8. Fakhri GE, Santos PA, Badawi RD, Holdsworth CH, Abbeele ADVD, Kijewski MF. Impact of acquisition geometry, image processing, and patient size on lesion
detection in whole-body 18F-FDG PET. J Nucl Med
Technol. 2007;48(12):1951–60.
9. de Groot EH, Post N, Boellaard R, Wagenaar NR, Willemsen AT, van Dalen JA. Optimized dose regimen for whole-body FDG-PET imaging. EJNMMI Res. 2013 Aug 12;3(1):63.
10. Everaert H, Vanhove C, Lahoutte T, Muylle K, Caveliers V, Bossuyt A, Franken PR. Optimal dose of 18F-FDG required for whole-body PET using an LSO PET camera. Eur J Nucl Med Mol Imaging. 2003 Dec;30(12):1615-9.
11. Tatsumi M, Clark PA, Nakamoto Y, Wahl RL. Impact of body habitus on quantitative and qualitative image quality in whole-body FDG-PET. Eur J Nucl Med Mol Imaging. 2003;30(1):40-5.
12. Koopman D, van Osch JA, Jager PL, Tenbergen CJ, Knollema S, Slump CH, van Dalen JA. Technical note: how to determine the FDG activity for tumour PET imaging that satisfies European guidelines. EJNMMI Phys. 2016 Dec;3(1):22.
13. Nagaki A, Onoguchi M, Matsutomo N. Patient weight-based acquisition protocols to optimize 18F-FDG PET/CT
image quality. J Nucl Med Technol. 2011;39(2):72-6.
14. Lois C, Jakoby BW, Long MJ, Hubner KF, Barker DW, Casey ME, Conti M, Panin VY, Kadrmas DJ, Townsend DW. An assessment of the impact of incorporating time-of-flight information into clinical PET/CT imaging. J Nucl Med. 2010 Feb;51(2):237-45.
15. Taniguchi T, Akamatsu G, Kasahara Y, Mitsumoto K, Baba S, Tsutsui Y, Himuro K, Mikasa S, Kidera D, Sasaki M. Improvement in PET/CT image quality in overweight patients with PSF and TOF. Ann Nucl Med. 2015 Jan;29(1):71-7.
16. Tong S, Alessio AM, Kinahan PE. Image reconstruction for PET/CT scanners: past achievements and future challenges. Imaging Med. 2010;2(5):529-45.
17. Halpern BS, Dahlbom M, Auerbach MA, Schiepers C, Fueger BJ, Weber WA, Silverman DH, Ratib O, Czernin J. Optimizing imaging protocols for overweight and obese patients: a lutetium orthosilicate PET/CT study. J Nucl Med. 2005 Apr;46(4):603-7.