The Efficiency of Formal Microfinance in Indonesia:
Using Data Envelopment Analysis Application
Farida Farida*1, Irwan R. Osman2, Agus Kurniawan Lim3, Nur Wahyuni4
Received: 2017, September 12 Accepted: 2017, November 4
Abstract
ne of the key success factors of the financial institution sustainability is operational efficiencies. Using Data Envelopment Analysis (DEA), this paper measures the relative efficiency of the executing banking units of people business credit (KUR) program in Indonesia. Sample data of this study were obtained from all banking units from banks providing KUR located in the district of Pati, Central Java - district with the largest KUR receiver. This study consists of two stages of analyses: (1) it is found that 18 of the 35 banking units (51.43%) are in the scale efficiency, with units receiving 100% efficiency score being called efficient; (2) an output target is shown for the purpose of maximizing the output of the KUR disbursement without additional inputs.
Keywords: Bank, Microfinance, DEA, Efficiency, Sustainability. JEL Classification: G21, C88, H21.
1. Introduction
Microfinancing is perceived as a less profitable business unit in the banking industry due to costs and obstacles associated with it (Demirgüç-Kunt and Klapper, 2012). Many studies reveal that micro-credits have many advantages for the society, however financial institutions cannot sustain this line of business. Low profit margins are not uncommon in practice due to its operational inefficiencies. As such, productivities and efficiencies in the banking industry are some
1. Faculty of Economics, Persada YAI University, Jakarta, Indonesia (Corresponding Author: [email protected]).
2. Faculty of Economics, STIE YAI, Jakarta, Indonesia ([email protected]). 3. Faculty of Economics, Persada YAI University, Jakarta, Indonesia ([email protected]).
key important indicators to analyze. According to (Parasuraman, 2010), banks should consistently improve its capacity to convert savings and term deposits into loans. Many instances are that micro credit can incur expenses higher than income it generates.
Micro credits are commonly targeted to low income household businesses and it is regarded as one of the programs to fight against poverty. Micro credits are usually in the form of informal lending provided by non-banking financial institutions. Since 2007 Indonesia has a micro-credit program called “Kredit Usaha Rakyat or KUR” targeted to un-bankable yet feasible micro-household businesses. With the innovation of easy requirements with no collaterals, KUR was able to reach low income household businesses which did not own bank accounts. Historically, KUR has relatively low figures of non-performing loan (Farida et al., 2015). The KUR has a credit limit of IDR 25 million with a tenor of 3 years for the working capital and 5 years for the start-up capital. KUR was distributed by a few numbers of banks appointed by the national government, however not all appointed banks had the capacity to serve micro household businesses. There were many banks serving only to large accounts, for the reason of efficiency or assumption that micro-household businesses have higher risks. Over 90% of KUR was distributed by a national-wide bank with the largest networks across Indonesia: Bank Rakyat Indonesia (BRI). The purpose of this study is to analyze the efficiency and productivity of BRI’s KUR since the program should provide benefits for both supply and demand side. An efficient banking institution is an important factor to assure sustainability and create values for customers. From economic view, high productivity would have better sustainability in the competition, given that profit margin would shrink, thus inefficient financial institutions would be forced to leave the competition (Burger et al., 2008).
the agricultural enterprises credit program. Their drawbacks such as complex procedure, high interest and collaterals, as well as high cost on late repayments, lead to the discontinuation of the programs (Farida et al., 2015).
Thus, this study aims to evaluate the efficiency of the executing banking units of KUR program, to find which banking units are becoming a role model for others, and to compare between their productivity and its output target. This study is using data envelopment analysis (DEA) application, a non-parametric approach. The research location is in the Pati District of Central Java Province as the largest KUR disbursement in Indonesia. Samples are taken from all of the 35 banking units, which spread from urban to rural.
2. Literature Review
Efficiency and effectiveness are interrelated concepts in the management theory. Effectiveness is concerned with maximizing outputs and efficiency is related with minimizing costs. Falkena et al., (2004) classified banking efficiencies into: allocative efficiencies and technical efficiency. Allocative efficiency is the extent to which available resources are utilized to produce maximum results. A company achieves technical efficiency if outputs can be produced with the least input possible.
Two methods are used to measure bank efficiencies: parametric and non-parametric. By parametric method, many studies apply stochastic frontier approach (SFA) such as (Baten and Kamil, 2010; Tahir and Haron, 2010). Meanwhile, efficiency measurement using Data Envelopment Analysis (DEA) has been widely used in banking (Tahir et al., 2009; Fethi and Pasiouras, 2010; Moradi-Motlagh et al., 2011; Suzuki and Sastrosuwito, 2011; Gordo, 2013). DEA is also used to measure efficiencies in many other areas such as rural economic development (Vennesland, 2005), poultry farm (Heidari et al., 2011), transportation (Bhagavath, 2006). Fethi and Pasiouras (2010) suggests that DEA is predominantly used in measuring bank performance.
output may not be as meaningful to compare scores between two independent studies (Bhagavath, 2006).
DEA approach does not have a formal consensus on the definition of the output-input variables used in the banking efficiency studies (Gordo, 2013). Madhanagopal and Chandrasekaran (2014) point out that DEA uses several inputs and outputs to analyze efficiencies, however, it does not offer any guides in choosing each variable, thus, input and output have to be chosen by the user. Nonetheless, the number of Decision Making Units or DMU is suggested to have minimum of 3 times of the sum of variables. In general, two approaches where used in DEA model: financial intermediaries and production approach. The first approach is the function of banks as intermediaries which collect funds from depositors and lend out to gain some margins. In this instance, the output is the loan, and the inputs are costs incurred such as: bank interest paid to depositors, employee salaries, and other operational costs. Efendic (2011) has studied to analyse efficiencies of conventional banks and islamic banks, the input variables are customer savings, fixed assets and employee costs, whilst output variables are net loan and other aset revenues. Input and output variables used by Efendic are similar to (Varias and Sofianopoulou, 2012)’s study in Greek banking system to evaluate the efficiencies of commercial banks. Tahir et al. (2009) evaluated efficiencies of domestic and foreign banks in Malaysia and found that domestic banks are more efficient. In (Tahir et al., 2009), the input variables are total deposits and overhead costs, and the output variables are revenues from banks’ assets. For the second approach, customer deposits are treated as outputs, and operational costs including employee costs are treated as input. Sathye (2001) treated employee wages, capital, and loanable funds as inputs, whilst loan and customer deposits were the outputs. Loan types were not classified in Sathye’s study. The result found that efficiencies of Australian banks were below the average of the world’s banks.
accounts have different costs; (iii) banks has multi service which size can be better measure by the value in its currency.
3. Methodology
There are several models developed in the DEA methodology (Charnes et al., 1978 and Banker et al., 1984). Charnes et al. (1978) applied input-oriented models assuming a Constant Return to Scales (CRS). This approach was further developed using output-oriented models with the assumption of Variable Return to Scales (VRS) introduced by Banker, Charnes, and Cooper (1984). The calculation result VRS DEA model is referred to the efficiency of the technique (Technical Efficiency = TE). In measuring the efficiency, each unit of economic activity or Decision Making Unit (DMU) is obtained from the maximisation of a weighted average of the ratio of output to input, which was formulated in the following form (Charnes et al., 1978):
Max h0 =
m i i i s r r r x v y u 1 0 1 0 (1) s.t =
m i i i s r r r x v y u 1 0 1 0≤ 1; j = 1, …, n
ur, vi ≥ 0; r = 1,...,s; i = 1, ..., m
In this study, input variables are denoted as xi from 35 banks units
(the third-party savings, interest expense, gift and warranty expense, provision for bad debt expense, employee expenses, general and administrative expenses, and other operational expenses). The output variables are denoted as yr from 35 unit banks (amount of disbursed
KUR, fees revenue, service revenue, and net interest income).
SE = 𝑇𝐸 𝐶𝑅𝑆𝑇𝐸 𝑉𝑅𝑆 (2)
This DEA efficiency value is defined not by absolute standards but relatively amongst bank units. This feature distinguishes the DEA from the parametric approach such as stochastic frontier approach (SFA), which requires some forms of some certain model functions. In addition, DEA is used in this study because each bank unit has similar characteristics. The purpose of DEA is to identify which units operate on the efficient frontier. If both the input and output of the banks unit are located on the frontier set then, the bank unit is considered efficient, and it also becomes the envelope covering the existing data sets. In other words, they cover up other inefficienct bank units which are located within the frontier or in the “envelope”.
The relative efficiency in this study to measure the efficiency can be illustrated by output-oriented in Figure 1. If there are two outputs, ie Y1 and Y2, the combination at point A is inefficient because it is below the production possibilities curve. The distance from point A to the frontier in this study is a function of the distance output Farrel (Fo), introduced by Farrell in 1957 (Vennesland, 2005), representing technical inefficiency- the level outputs which should be improved without increasing the current (existing) input. When Fo is equal to 1, then the bank unit is considered efficient. However, if the Fo score is above 1, the bank units is inefficient.
Figure 1: Ilustration of frontier in DEA Source: Vennesland (2005).
Fo (Xkʹ , Ykʹ ǀ C,S) = Max λkʹ (3) s.t
k k k kY Z 1 ,1 ≥ λkY1,k (disbursed KUR) (4)
k k k kY Z 1 ,2 ≥ λkY2,k (Fees Revenue) (5)
k k k kY Z 1 ,3 ≥ λkY3,k (Services Revenue) (6)
k k k kY Z 1 ,4 ≥ λkY4,k (Net Income Revenue) (7)
k k k kY Z 1 ,1 ≤ XkY1,k (The Third-Party Savings) (8)
k k k kY Z 1 ,2 ≤ XkY2,k (Interest Expense) (9)
k k k kY Z 1 ,3 ≤ XkY3,k (Gift Expense) (10)
k k k kY Z 1 ,4 ≤ XkY4,k (Provision for Bad Debt Expense) (11)
k k k kY Z 1 ,5 ≤ XkY5,k (Employees Expense) (12)
k k k kY Z 1 ,6 ≤ XkY6,k (General/Administration Expense) (13)
k k k kY Z 1 ,7 ≤ XkY7,k (Others Operational Expense) (14)
Zk ≥ 0 (CRS) k = 1…K (15)
output can be increased again with the same inputs or no additional cost. Zk is the intensity variable. The role of Z in this model is to
establish a reference technology. Intensity variables make frontier, describe hypothesis from bank units performances which use the same input to produce more output.
4. Result and Discussion 4.1 Descriptive Analysis
The study was conducted upon 35 commercial banks providing KUR, which are appointed by Government in District of Pati. In this study, each bank was represented by an initial. The amount KUR disbursed in Pati between 2013 and 2014 can be shown by Figure 2:
Figure 2: The Amount of KUR Disbursed
Meanwhile, Mulyoharjo and Gabus decreased in both the number of customers and average KUR amount per customer. The performance of the bank units can be seen in table 1:
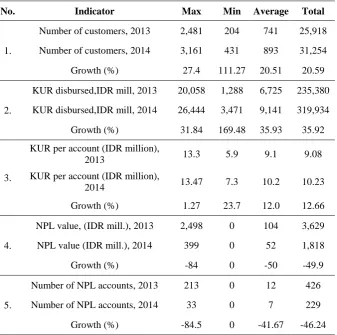
Table 1: Performance of Bank Units Providing KUR
No. Indicator Max Min Average Total
1.
Number of customers, 2013 2,481 204 741 25,918
Number of customers, 2014 3,161 431 893 31,254
Growth (%) 27.4 111.27 20.51 20.59
2.
KUR disbursed,IDR mill, 2013 20,058 1,288 6,725 235,380
KUR disbursed,IDR mill, 2014 26,444 3,471 9,141 319,934
Growth (%) 31.84 169.48 35.93 35.92
3.
KUR per account (IDR million),
2013 13.3 5.9 9.1 9.08
KUR per account (IDR million),
2014 13.47 7.3 10.2 10.23
Growth (%) 1.27 23.7 12.0 12.66
4.
NPL value, (IDR mill.), 2013 2,498 0 104 3,629
NPL value (IDR mill.), 2014 399 0 52 1,818
Growth (%) -84 0 -50 -49.9
5.
Number of NPL accounts, 2013 213 0 12 426
Number of NPL accounts, 2014 33 0 7 229
Growth (%) -84.5 0 -41.67 -46.24
IDR 26.4 billion or 2,631 customers. Unit Sukolilo (SL) had the largest number of customers - 3,161 account or IDR 23.1 billion in 2014. This implies that the average KUR per customer in unit Dukuhseti (DS) was larger than that of unit Sukolilo (SL), IDR 10 million and IDR 7.3 million per customer respectively. The lowest KUR disbursed was unit Ngablak (NG) by IDR 3.4 billion or 467 customers. Unit Gabus (GS) had the least number of customers by 431 customers or IDR 5.0 billion. This implies that the average of KUR per customer in Gabus (GS) was higher than that of Ngablak (NG), IDR 11.8 million and IDR 7.4 million respectively.
The success of bank lending can also be observed from the level of non-performance loan (NPL). NPL in 2014 declined by 49.9% from IDR 3.6 billion in 2013 to IDR 1.8 billion in 2014. Unit Juwana I (J1) had the highest NPL rate in 2014 by IDR 2.4 billion or 213 customers. Meanwhile, in 2014, unit Pati Kota I (PK1) had the highest NPL by IDR 399 million or 33 customers. The best performance by NPL was achieved by unit Sukolilo (SL), which also had the largest number of customers. In addition to KUR disbursed, the performance of bank unit can also be observed from its revenues seen in table 2.
Table 2: Performance of Bank Units Providing KUR by Revenues
No Indicator Max Min Average Total
1.
Third party funds or savings (IDR
billion), 2013 55.5 3.8 23.9 836.6
Third party funds or savings (IDR
billion), 2014 66.7 6.6 27.7 971.1
Growth (%) 20.18 73.68 15.9 16.0
2.
Term deposits (IDR billion), 2013 4.9 0.34 1.97 69.2
Term deposits (IDR billion, 2014 8.5 0.62 2.4 84.9
Growth (%) 73.4 9.5 21.8 22.68
3.
Interest revenue (IDR billion), 2013 12.79 0.6 5.2 181.99
Interest revenue (IDR billion, 2014 15.3 1.6 5.9 206
No Indicator Max Min Average Total
4.
Provision revenue (IDR million), 2013 376.3 10.0 97.6 3,419.4
Provision revenue (IDR million), 2014 406.8 20.1 102.3 3,581
Growth (%) 8.1 101 4.8 4.7
5.
Service revenue (IDR million), 2013 884.9 44.7 392.4 13,734
Service revenue (IDR million), 2014 965.4 141.3 475 16,626
Growth (%) 9.0 216.1 21 21
6.
Other operational revenues (IDR
million), 2013 146 0.004 47.6 1,668
Other operational revenues (IDR
million), 2014 212.8 0.011 66.9 2,342.9
Growth (%) 45.7 175 40.5 40.4
7.
Non-operational revenues (IDR million), 2013
1,379.
3 19.8 709 24,874
Non-operational revenues (IDR million), 2014
1,805.
8 96.4 907.2 31,753.5
Growth (%) 30.9 386.6 27.9 27.6
Figure 3: Operational Revenues of Bank Units Providing KUR
Total operating revenues of Juwono I (J1) declined from IDR 7.7 billion in 2013 to IDR 6.9 billion in 2014. The decrease was due to a significant decline in interest income significant from IDR 7.0 billion in 2013 to IDR 6.1 billion in 2014. Margorejo(MR)’s operational revenue decreased slightly from IDR 6.29 billion to IDR 6.25 billion in 2014. The decline was due to a decline of interest revenue, provision revenue and other operating revenue. Operational revenues of Ngablak (NG) declined slightly from IDR 5.44 billion to IDR 5.21 billion, while Pucakwangi (PW) from IDR 4.12 billion to IDR 4.09 billion. Unit Ngablak’s operational revenues decreased slightly due to the decrease of interest revenue from IDR 5.0 billion in 2013 to IDR 4.75 billion in 2014, however, provision revenue, service revenue and other operational revenue increased. Unit Pucakwangi’s decline was due to the decline of interest revenue and provision revenue, but service revenue and other operational revenue increase significantly.
2013 to Rp 492 million in 2014. Overall, non-operational revenuerose by 27.6 percent from IDR 24.8 billion in 2013 to IDR 31.7 billion in 2014, with an average non-operational revenue figure of IDR 907.2 million in 2014.
Figure 4: Non-Operational Revenue from Bank Units Providing KUR
Performance of bank units providing KUR observed from type of expenses incurred can be shown in table 3.
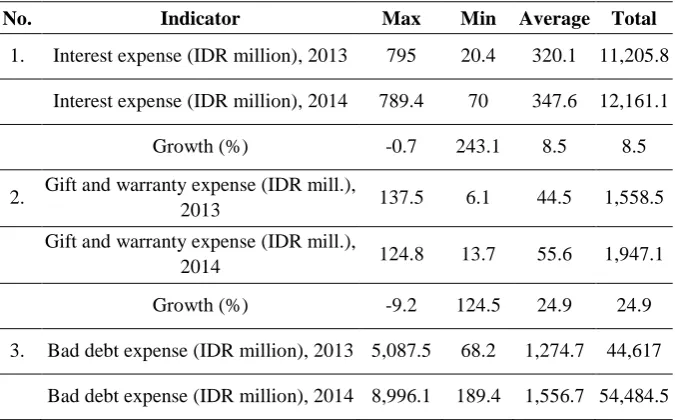
Table 3: Performance of bank units providing KUR from operating expenses
No. Indicator Max Min Average Total
1. Interest expense (IDR million), 2013 795 20.4 320.1 11,205.8
Interest expense (IDR million), 2014 789.4 70 347.6 12,161.1
Growth (%) -0.7 243.1 8.5 8.5
2. Gift and warranty expense (IDR mill.),
2013 137.5 6.1 44.5 1,558.5
Gift and warranty expense (IDR mill.),
2014 124.8 13.7 55.6 1,947.1
Growth (%) -9.2 124.5 24.9 24.9
3. Bad debt expense (IDR million), 2013 5,087.5 68.2 1,274.7 44,617
No. Indicator Max Min Average Total Growth (%) 76.8 177.7 22.1 22.1
4. Employees expenses (IDR million),
2013 1,088.3 212.3 663.8 23,234.8
Employees expenses (IDR million),
2014 1,444.3 491.7 900.3 31,513.9
Growth (%) 32.7 131.6 35.6 35.6
5. General and administrative expenses
(IDR million), 2013 1,433 327.3 709.6 24,838.7
General and administrative expenses
(IDR million), 2014 1,855.7 434,8 808.8 28,309.5
Growth (%) 29.4 32.8 13.9 13.9
6. Other operating expenses (IDR
million), 2013 2,402.2 46.7 626.3 21,923
Other operating expenses (IDR
million), 2014 2,357.6 154.3 610.9 21,383.5
Growth (%) -1.8 230.4 -2.4 -2.4
Figure 5: Operational Expenses from Bank Units Providing KUR
Figure 5 depicts the majority increase of expenses in 2014 in bank units, but unit Bulumanis (BM), Kayen (KY), Margorejo (MR), Karangwotan (KW) and Pucakwangi (PW). The decline experienced by unit Pucakwangi (PW) and Margorejo (MR) was parallel with the decline in operational revenues. Meanwhile, the decline of expenses in unit Bulumanis (BM) and Kayen (KY) was due to the decline in bad debt expenses, showing improving credit quality of customers from both units. On the other hand, unit of Karangwotan (KW) expense decline due to the decline in interest expense, bad debt expense, and other operational expense. In this study, the definition of inefficiency ratio is that the total operational expense over total operational revenue. The lower the figure, the more efficient the bank unit. The lowest ratio was 46.4% and the largest 179.4% in 2014. If the figure exceeds 100%, it implies that the unit bears more costs than the revenue it generates. Out of 35 bank units in this study, only one unit with inefficiency ratio exceeding 100%: Juwono I (JI).
4.2 Efficiency Analysis
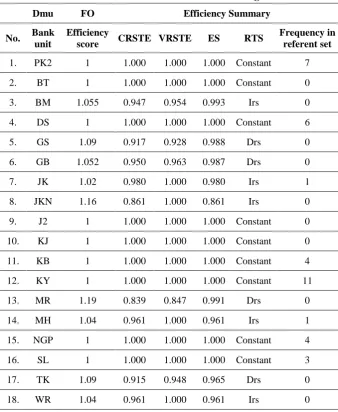
approach. If the ES score is below 1, it shows that the bank unit is inefficient. FO is the distance function output Farrell, or strong disposability of outputs. It implies that the output can be improved with the identical output without an additional cost, the amount of output can be set arbitrarily (Fӓre and Grosskopf, 2000). If the DMU is not equal to 1, for example DMU number 3 (BM/Bulumanis) having CRSTE of 0.947, it implies that Bulumanis (BM) has to have the capacity to increase the output by 5.5% without an additional input. Other DMU interpretations follow.
Table 4: Result of DEA of Unit Banks Providing KUR
Dmu FO Efficiency Summary
No. Bank unit
Efficiency
score CRSTE VRSTE ES RTS
Frequency in referent set 1. PK2 1 1.000 1.000 1.000 Constant 7
2. BT 1 1.000 1.000 1.000 Constant 0
3. BM 1.055 0.947 0.954 0.993 Irs 0
4. DS 1 1.000 1.000 1.000 Constant 6
5. GS 1.09 0.917 0.928 0.988 Drs 0
6. GB 1.052 0.950 0.963 0.987 Drs 0
7. JK 1.02 0.980 1.000 0.980 Irs 1
8. JKN 1.16 0.861 1.000 0.861 Irs 0
9. J2 1 1.000 1.000 1.000 Constant 0
10. KJ 1 1.000 1.000 1.000 Constant 0
11. KB 1 1.000 1.000 1.000 Constant 4
12. KY 1 1.000 1.000 1.000 Constant 11
13. MR 1.19 0.839 0.847 0.991 Drs 0
14. MH 1.04 0.961 1.000 0.961 Irs 1
15. NGP 1 1.000 1.000 1.000 Constant 4
16. SL 1 1.000 1.000 1.000 Constant 3
17. TK 1.09 0.915 0.948 0.965 Drs 0
Dmu FO Efficiency Summary No. Bank
unit
Efficiency
score CRSTE VRSTE ES RTS
Frequency in referent set 19. WN 1.12 0.890 0.891 0.999 Irs 0
20 J1 1.06 0.941 0.944 0.997 Drs 0
21. PK1 1.14 0.877 0.884 0.992 Irs 0
22. TY 1.08 0.930 0.934 0.996 Irs 0
23. AL 1 1.000 1.000 1.000 Constant 0
24. GW 1 1.000 1.000 1.000 Constant 1
25. KW 1 1.000 1.000 1.000 Constant 4
26. NG 1.06 0.935 0.948 0.986 Drs 0
27. PH 1.01 0.989 0.995 0.993 Irs 0
28. PK 1 1.000 1.000 1.000 Constant 6
29. PL 1.13 0.883 0.929 0.951 Irs 0
30. PS 1 1.000 1.000 1.000 Constant 5
31. PW 1.08 0.926 1.000 0.926 Irs 0
32. TM 1 1.000 1.000 1.000 Constant 0
33. TR 1 1.000 1.000 1.000 Constant 1
34. TH 1 1.000 1.000 1.000 Constant 6
35. CS 1 1.000 1.000 1.000 Constant 1
Mean 1.04 0.964 0.976 0.987
Note:
crste: constant return scala technical efficiency vrste: variable return scale technical efficiency
se : scale efficiency = crst/vrst, Irs: increasing, Drs: decreasing
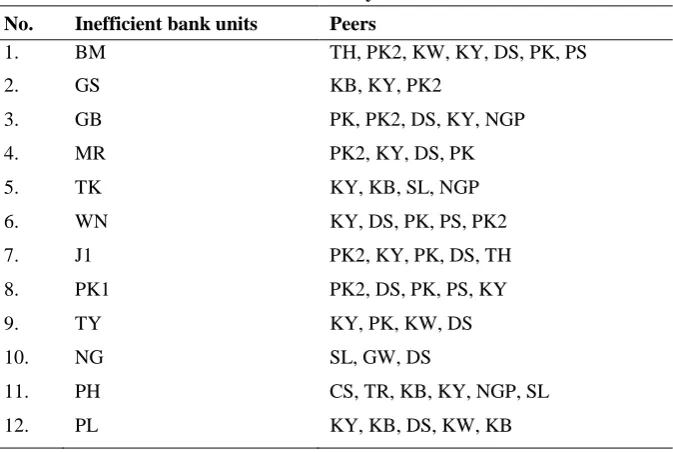
unit of Bulumanis (BM)- an inefficient unit- can refer to unit of Tambaharjo (TH), Pati Kota 2 (PK2), Karang Wotan (KW), Kayen (KY), Dukuhseti (DS), Pakis (PK), and Plaosan (PS).
Table 5: Summary of Peers No. Inefficient bank units Peers
1. BM TH, PK2, KW, KY, DS, PK, PS
2. GS KB, KY, PK2
3. GB PK, PK2, DS, KY, NGP
4. MR PK2, KY, DS, PK
5. TK KY, KB, SL, NGP
6. WN KY, DS, PK, PS, PK2
7. J1 PK2, KY, PK, DS, TH
8. PK1 PK2, DS, PK, PS, KY
9. TY KY, PK, KW, DS
10. NG SL, GW, DS
11. PH CS, TR, KB, KY, NGP, SL
12. PL KY, KB, DS, KW, KB
Efficient bank units have implemented good systems. Amongst efficient bank units, some have better performance. From the above summary of peers (table 5) or from frequency in referent set in table 4, the most noticeable units are Kayen (KY) by 11 times, unit of Pati Kota 2 (PK2) by 7 times, and unit of Dukuhseti (DS), Pakis (PK), and Tambaharjo (TH) by 6 times each. This shows that unit of Kayen (KY) can produce the most optimum from its output. The most frequent units which show up from the above table shows that the unit is the most efficient, namely unit Kayen (KY). Some of the reasons for Kayen’s efficiency are: (i) high absorption of third party funds by IDR 66.7 billion (highest); (ii) high KUR disbursement by IDR 17.7 billion (second highest); (iii) large customer numbers (third largest); (iv) the decrease of expense in the event of increase of revenues. Inefficient bank units should be able to learn from other efficient bank units to optimize their outputs from the inputs they possess.
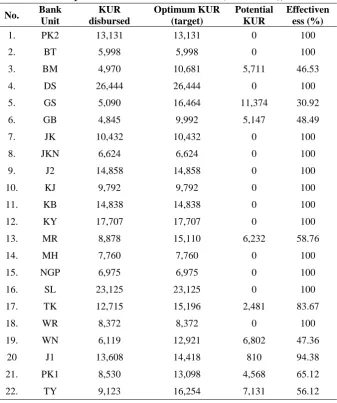
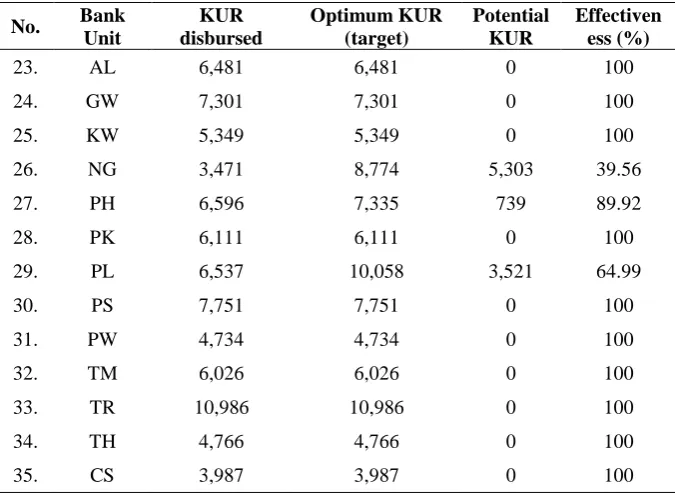
bank units need to make technical changes to improve their output by increasing their KUR disbursement. Therefore it is necessary to know the optimal output level or the amount of disbursable KUR without increasing the existing input. Bank units which KUR disbursements have not reached optimum level need to improve its customer outreach either from quantity or quality side. It is not advisable that quantity is prioritized whilst neglecting quality (delinquency). The extent to which how each bank units need to improve can be show in table 6 below.
Table 6: Optimisation of KUR Disbursement (IDR Million), 2014 No. Bank
Unit
KUR disbursed
Optimum KUR (target)
Potential KUR
Effectiven ess (%)
1. PK2 13,131 13,131 0 100
2. BT 5,998 5,998 0 100
3. BM 4,970 10,681 5,711 46.53
4. DS 26,444 26,444 0 100
5. GS 5,090 16,464 11,374 30.92
6. GB 4,845 9,992 5,147 48.49
7. JK 10,432 10,432 0 100
8. JKN 6,624 6,624 0 100
9. J2 14,858 14,858 0 100
10. KJ 9,792 9,792 0 100
11. KB 14,838 14,838 0 100
12. KY 17,707 17,707 0 100
13. MR 8,878 15,110 6,232 58.76
14. MH 7,760 7,760 0 100
15. NGP 6,975 6,975 0 100
16. SL 23,125 23,125 0 100
17. TK 12,715 15,196 2,481 83.67
18. WR 8,372 8,372 0 100
19. WN 6,119 12,921 6,802 47.36
20 J1 13,608 14,418 810 94.38
21. PK1 8,530 13,098 4,568 65.12
No. Bank Unit
KUR disbursed
Optimum KUR (target)
Potential KUR
Effectiven ess (%)
23. AL 6,481 6,481 0 100
24. GW 7,301 7,301 0 100
25. KW 5,349 5,349 0 100
26. NG 3,471 8,774 5,303 39.56
27. PH 6,596 7,335 739 89.92
28. PK 6,111 6,111 0 100
29. PL 6,537 10,058 3,521 64.99
30. PS 7,751 7,751 0 100
31. PW 4,734 4,734 0 100
32. TM 6,026 6,026 0 100
33. TR 10,986 10,986 0 100
34. TH 4,766 4,766 0 100
35. CS 3,987 3,987 0 100
Table 6 shows that unit of Gabus (GS) has the largest potential to disburse KUR in term of funds. Its capacity to absorb third-party funds (savings) is the second largest amongst 35 bank units. However, its capacity to disburse the credit is far from optimum. Its productivity figure was only 30.92% from existing capacity. This means that Gabus has more challenges to disburse KUR, except that interest expense to third-party funds is higher than its revenue. Gabus’ inefficiencies were due to the following reasons: (i) high absorption of third-party funds. It increased from the previous year whilst the KUR disbursement declined; (ii) Decline of customer number in parallel with average KUR per customer; (iii) the least number of customer in comparison with other bank units.
5. Conclusion
KUR distribution by majority of bank units has not been efficient. From 35 bank units, only 51.43% reached efficiency; whilst the remaining 48.57% were deem to improve their KUR distribution with existing input. Inefficiencies do not imply that bank units suffer operational losses. Efficiencies in this study are not absolute, but rather relative to other bank units. Only 1 bank unit - Juwono 1 (J1) - had expenses exceeding revenue. The main reason of the inefficiency was the disbursed KUR less than the optimal target. The more optimized the KUR distribution, the more micro-household businesses are served and the more profits are earned. Considering analogous characteristics of the bank units, inefficient units can refer to efficient ones. Unit of Kayen (KY), Pati 2 (PK2), Dukuhseti (DS), Pakis (PS) and Tambaharjo (TH) can be the role models for other units. Furthermore, inefficient units such as unit of Gabus (GS), can potentially improve to become efficient given their adequate inputs- large amount of third-party funds, human capitals with robust recruiting, training and development system similar to efficient units. Employee rotations or trainings can potentially boost the target achievement. This is because the goals of an organization can be achieved depending on the ability of employees to perform tasks and adapt to environmental changes (khanmohammadiotaqsara et al., 2012). Hence, trainings can potentially increase employee productivity.
References
Banker, R. D., Charnes, R. D., Cooper, W. W. (1984). Some Models for Estimating Technical and Scale Inefficiencies in Data Envelopment Analysis. Management Sciences, 30, 1078-1092.
Baten, A., & Kamil, A. A. (2010). A Stochastic Frontier Model on Measuring Online Bank Deposits Efficiency. African Journal of
Business Management, 4(12), 2438-2449.
Bhagavath, V. (2006). Technical Efficiency Measurement by Data Envelopment Analysis: An Application in Transportation. Alliance Journal of Business Research, 2(1), 60-72.
Burger, A., Мурманн, Ю., Бургер, А., & Moormann, J. (2008). Productivity in Banks: Myths & Truths of the Cost Income Ratio. Retrieved from
https://www.researchgate.net/profile/Hai_Chin_Yu2/publication/2281
19602_Public_Debt_Bank_Debt_and_Non-Bank_Private_Debt_in_Emerging_and_Developed_Financial_Market s/links/0fcfd50e122893a677000000.pdf#page=85.
Charnes, A., Cooper, W. W., & Rhodes, E. (1978). Measuring the Efficiency of Decision Making Units. European Journal of Operational Research, 2(6), 429-444.
Demirgüç-Kunt, A., & Klapper, L. F. (2012). Financial Inclusion in Africa: An Overview. Retrieved from
https://elibrary.worldbank.org/doi/pdf/10.1596/1813-9450-6088.
Efendic, V. (2011). Efficiency of the Banking Sector Of Bosnia– Herzegovina with Special Reference to Relative Efficiency of the Existing Islamic Bank. In 8th International Conference on Islamic
Economics and Finance, Doha–Qatar, 18th–20th December.
Retrieved from
Falkena, H., Davel, G., Hawkins, P., Llewellyn, D., Luus, C., Masilela, E., & Shaw, H. (2004). Competition in South African Banking. Task Group Report for the National Treasury and the South
African Reserve Bank. Retrieved from
http://www.academia.edu/download/29086960/ciball.pdf.
Farida, F., Siregar, H., Nuryartono, N., & Intan, E. K. (2015). Micro Enterprises’ Access to People Business Credit Program in Indonesia: Credit Rationed or Non-Credit Rationed? International Journal of Economic Perspectives, 9(2), 57-70.
Fethi, M. D., & Pasiouras, F. (2010). Assessing Bank Efficiency and Performance with Operational Research and Artificial Intelligence Techniques: A Survey. European Journal of Operational Research,
204(2), 189-198.
Gordo, G. (2013). Estimating Philippine Bank Efficiencies Using Frontier Analysis. Philippine Management Review, 20, Retrieved from http://www.journals.upd.edu.ph/index.php/pmr/article/view/3594.
Heidari, M. D., Omid, M., & Akram, A. (2011). Using Nonparametric Analysis (DEA) for Measuring Technical Efficiency in Poultry Farms.
Revista Brasileira de Ciência Avícola, 13(4), 271-277.
Hermes, N., Lensink, R., & Meesters, A. (2011). Outreach and Efficiency of Microfinance Institutions. World Development, 39(6), 938–948. https://doi.org/10.1016/j.worlddev.2009.10.018.
Khanmohammadiotaqsara, M., Khalili, M., & Mohseni, A. (2012). The Role of Practical Training in Productivity and Profitability of Organizations in the Third Millennium. Procedia - Social and Behavioral Sciences, 47, 1970-1975.
Madhanagopal, R., & Chandrasekaran, R. (2014). Selecting Appropriate Variables for DEA Using Genetic Algorithm (GA) Search Procedure. International Journal of Data Envelopment
Moradi-Motlagh, A., Saleh, A. S., Abdekhodaee, A., & Ektesabi, M. (2011). Efficiency, Effectiveness and Risk in Australian Banking Industry. World Review of Business Research, 1(3), 1-12.
Parasuraman, A. (2010). Service Productivity, Quality and Innovation: Implications for Service Design Practice and Research. International Journal of Quality and Service Sciences, 2(3), 277-286.
Sathye, M. (2001). X-Efficiency in Australian Banking: An Empirical Investigation. Journal of Banking & Finance, 25, 613-630.
Suzuki, Y., & Sastrosuwito, S. (2011). Efficiency and Productivity Change of the Indonesian Commercial Banks. International
Proceedings of Economics Development and Research, 7, 10-14.
Tahir, I. M., Bakar, N. M. A., & others. (2009). Evaluating Efficiency of Malaysian Banks Using Data Envelopment Analysis. International
Journal of Business and Management, 4(8), 96-106.
Tahir, I. M., & Haron, S. (2010). Cost and Profit Efficiency of Islamic Banks: International Evidence Using the Stochastic Frontier Approach. Banks and Bank Systems, 5(4), 78-83.
Varias, A. D., & Sofianopoulou, S. (2012). Efficiency Evaluation of Greek Commercial Banks Using Data Envelopment Analysis. Lecture
Notes in Management Science, 4, 254-261.
Vennesland, B. (2005). Measuring Rural Economic Development in Norway Using Data Envelopment Analysis. Forest Policy and Economics, 7(1), 109-119.
Zerai, B., & Rani, L. (2012). Is There a Tradeoff between Outreach and Sustainability of Micro Finance Institutions? Evidence from Indian Microfinance Institutions (MFIs). European Journal of