2017 3rd International Conference on Electronic Information Technology and Intellectualization (ICEITI 2017) ISBN: 978-1-60595-512-4
Automatic Algorithm for River Gradient
Based on Directed Topology
Chengming Li, Wei Wu and Xiaoli Liu
ABSTRACT
River gradient is an important aspect and also a technical difficulty in expressing water system elements in geographic mapping. There are few studies on automatic algorithm for river gradient. This paper addresses this issue by proposing a new automatic algorithm for river gradient using the tree-shaped constrained stroke. Based on the in-depth study of the data structure of directed topology, this method focuses on recognizing the patterns of estuary, constructing the tree-shaped constrained stroke, establishing river hierarchies, and studying the hierarchical gradient of the main stem and tributaries. It realizes automatic river gradient and has been tested in practice. The results show that this algorithm does not require human intervention in river network identification, estuary recognition, river stratification, and river gradient, which is highly automatic and largely improves the mapping efficiency. The gradient effect is better than manual work.
INTRODUCTION
The river system is one important element in maps, which is represented by the thinner to thicker gradient lines. There are two aspects in the study of river gradation: the study of symbol drawing for river gradient and the study of constructing the river tree structure.
At present, there have been several studies of river tree structure. Wu[1] focus on the automatic construction of the river tree and propose a river tree model with ________________________
the iterative characteristics of the river. However, their method determines the main stem based on length recognition or manual design. Ai[2] studies the planar structure of river networks and its automatic establishment, but ignores the semantic relationship between rivers. Guo[3] analyzes the characteristics of the river system and automatically establishes the tree-shaped river system. Nevertheless, he fails to consider the problem that the angle at confluence does not meet the requirement for flow calculation. Thomson[4] proposes the method of constructing river stroke based on the principle of perceptual organization. However, instead of proposing a complete solution, they only introduce the treatment of some aspects in the establishment river tree.
Studies of symbol drawing for river gradient include the following work. Cai [5] studies the drawing algorithm for step-like single-line rivers. He[6] studies the overall drawing method for single-line rivers. Zhang[7] focus on automatic drawing of the river system using the tree structure. At the same time, there are many mapping software that provide river gradient tools according to the actual needs in drawing. For instance, MapGis can design gradient symbols; ArcGis and WJ-III can also draw gradient symbols based on river attributes.
The algorithms and tools of symbol drawing for river gradient have been relatively mature. The key to studying river gradient lies in determining the hierarchy of the river system and assigning gradient values to the streams in the river (i.e. the width of the river at the beginning and ending nodes). In order to determine how to assign gradient values to a stream, we need to study the hierarchical relationships between the current stream and other streams in the river tree structure.
The existing algorithms of river gradient are not highly automatic, and requires a lot of additional correction. This paper addressing the problems above in four aspects. Following the general rules of river system gradient and based on the data structure of directional topology, this paper studies the recognition of river estuary patterns, the construction of tree-shaped constraint stroke, the hierarchical relationship in the river system, and the hierarchical gradient of the main stem and tributaries.
RIVER GRADING
Process of river gradient: First automatically identify the pattern of river estuary, and then build the “bottom to top” tree-shaped constraint stroke starting from the estuary and find confluence points. Next, build the tree-shaped constraint stroke starting from the confluence point. Find the hierarchical relationship of the river system, and finally the hierarchical gradient of the main stem and tributaries.
Identify the Pattern of River Estuary
establish a correct relationship in the river hierarchy. In the case of unknown direction, according to the natural characteristics of the river, it is generally believed that the tributary intersects the main stem in an acute angle at the confluence. Guo[8] proposes that if the intersection angles on both sides are less than 90 degrees, then the intersection point belongs to downstream. Thus, most scholars establish the river tree from the origins of the river system (tracing from the upstream to the downstream).
Figure1. River estuary. Figure2. Sketch of a stroke. Figure3. Sketch of a stroke.
At the confluence of main tributaries of the tree-shaped river system, there are multiple upstreams but only one downstream. Thus, it is easier to trace from the downstream to establish a hierarchical relationship in the tree-shaped river system. Therefore, based on the knowledge of the correct flow direction in existing river system, this paper starts from the estuary and builds the tree-shaped constraint stroke from the downstream to the upstream. Conditions for determining river estuary include:
(1) The degree of association at the node is 1, where the degree of association refers to the number of arcs associated to the node;
(2) The node is the ending node of the associated arc;
(3) The starting node of the associated arc is the ending node of other arcs associated to this starting node.
Node A in Figure 1 is a river estuary. Normally, a river system has only one estuary. However, there might be a number of estuaries in a river system due to data collection errors, or maybe the actual situation is that there are multiple estuaries. Then we should choose the one that can trace the longest tree-shaped constraint stroke to ensure that there is only one estuary.
Tree-shaped Constraint Stroke
Based on the principle of perceptual organization, we add river flow (RiverFlow), features (FeatureID), and layers (LayerID) as constraint factors and construct the tree-shaped constraint stroke of the river, referred to as rivStroke. As shown in Figure3, it is traced from Arc A of the Yellow River to Arc B of the Yellow River.
Hierarchical Structure of the River System
The hierarchical structure of the river hierarchy is concealed in the iterative process of constructing river Stroke. River estuary is where rivers enter the lake water systems or other water systems. It is usually the widest place in the whole river, and also the main river in the river system. All river Strokes traced out of the river estuary are first-order rivers. The tributaries from first-order rivers are second-order rivers, so the river Strokes traced from the confluence points of first-second-order rivers are second-order rivers. By the same rule, rivers traced from the confluence point of a certain river order are of the next order.
Figure4. River hierarchy.
Hierarchical Gradient of the Main Stem And Tributaries
After completing the tree-shaped constraint river stroke, the hierarchical relationship between the main stem and tributaries in the river system has all been integrated into the structure, and the river flows are also clear, so we can draw river gradient. In drawing the gradient, single-line river is represented by the gradient line, with the line changing from being thinner at the upstream to thicker at the downstream (generally from 0.1mm to 0.4mm). When the single-line river enters the two-line water system, the tributary is also changes from thinner line to thicker line. When intersecting with rivers of higher orders, usually the width of its ending part should not exceed that of the higher orders, i.e., the width of tributary should not exceed that of the main stem. To automatically draw rivers using computers, the key is to assign gradient values to the stream, i.e., the width value of the starting and ending point of the stream.
The width at the starting point the river is generally equal to 0.1mm. The hierarchy and length of rivers determine the different width at the ending point, so the key issue is to determine the ending width of the river. Usually, we first determine the ending width of the main stem through length control; on the basis of the main stem control, we can determine the ending width of tributaries by studying the ratio of tributary length and hierarchical control indicators. In this way, the river gradient will be more natural, and also to meet the principle that tributary should not be wider than the main stem.
(1) Method of main stem gradient
This paper uses topology to break the river into arcs and calculate the gradient value of each arc. Use the length information to calculate the river width at each node (i.e., the confluence point) on the main stem arcs. For example, if the largest width gradient value for a 10000-meter-long river is about 0.4 mm, then for a 5000-meter-long main stem, the gradient value is 0.25 mm at the confluence point, and 0.1mm at the source. Gradient values at other confluence points can be calculated using the gradient value formula.
(2) Method of tributary gradient
For the tributary, we conduct overall control over the main stem and calculate using hierarchical control indicators. For instance, for tributaries shorter than 1000 meters, the gradient should range from 0.1mm to 0.12mm; for rivers longer than 1000 meters and shorter than 2000 meters, the gradient should range from 0.12mm to 0.15mm. Compare the calculated gradient value with that at the main stem confluence point. The principle is that the maximum width of the tributary can exceed the width of its corresponding confluence point into the main stem.
EXPERIMENT AND ANALYSIS
programming language. The experiment environment is a personal computer with Windows 7 system (64-bit), which has Intel Core i7-4790 (3.60GHz) CPU, and 10GB RAM. The space of (solid) hard drive is 900GB. The data for experiment is the monitored geographical information of the water system. We perform the gradient experiment on various counties, cities, districts, and provinces. In the example of one city, there are 13005 water system elements. As for efficiency, the gradation process takes 15 seconds. As for accuracy, there are 12494 gradients, and the gradient accuracy is 96%. For the remaining 4% of inaccuracy, mostly is due to missing rivers caused by coding errors caused by the lack of river, and a small part is due to the wrong original information of river flow, as shown in Table I. In general, the gradient effect is better than artificial gradient, as shown in Figure 5.
TABLE I. COMPARISON OF RIVER GRADIENT RESULTS.
Layer Name Number of
original elements
Number of gradient elements
Gradient accuracy
Perennial river 6934 6587 0.95%
Dry river 6076 5912 97%
Intermittent river 4 4 100%
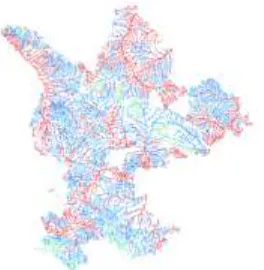
[image:6.612.124.269.486.625.2]Figure 5 shows the gradient effect of a river system. We can see that the gradient effect is obvious and the gradient trend is stable and reasonable, which is better than artificial gradient effect. Figure 6 shows the overall effect of river system gradient. Figure 5 is in the upper right part of Figure 6. In order to easily understand the hierarchical relationship in the river system, the first-order and second-order streams in Figure 6 is marked in red, third-order to fifth-order streams in blue, and other orders in green. We can clearly observe the hierarchical relationship in the river system.
[image:6.612.343.475.487.622.2]CONCLUSIONS
In the practice of geographic census, through the research and development of the automatic river gradient technology, we can build tree-shaped constraint stroke at the river estuary and quickly establish the river structure. This can avoid problem that the actual data quality is different and the consequent problem that the angle information is unable to meet the flow requirement for calculation. In this way, we can achieve the fully automatic gradient and greatly improve the working efficiency to 96%. This not only meets the mapping requirements, but the gradient effect is also superior to artificial gradient effect. However, this method is based on the correct direction of river flows and the nonlinear gradient model, which needs to be further studied and improved in the future.
ACKNOWLEDGEMENTS
This research was supported by the National SciTech Support Plan (2015BAJ06B01)
REFERENCES
1. Wu H. 1996. “Structured Approach to Implementing Automatic Cartographic Generalization,”
Journal of Wuhan Technical University of Surveying & Mapping, 21(3):277-285.
2. Ai Z. 1995. “The river net structural model and its construction in geography information system,” Surveying & Mapping of Sichuan, 2:75-79.
3. Guo Q. 1999. “Analysing the Characters of the Networks of Rivers and Structuralizing the Tree-like Network of Rivers Automatically,”Surveying & Mapping of Geology & Mineral Resources,
4:799.
4. Thomson R C, Brooks R. 2001. “Exploiting Perceptual Grouping for Map Analysis, Understanding and Generalization: The Case of Road and River Networks,” presented at the 4th International Workshop on Graphics Recognition Algorithms and Applications. September 7-8, 2001.
5. Cai X. 1997. “Algorithm of drawing stream symbol,” Bulletin of Surveying and Mapping, 11:7-29.
6. He Z. 2004. “Designing technique of complicated linear symbols in GIS symbol database,”
Editorial Board of Geomatics & Information Science of Wuhan University, 29(2):132-134.
7. Zhang Y. 2004. “Structured Design of Dendritic River Networks Based on Graph,” Editorial
Board of Geomatics & Information Science of Wuhan University, 29(6):537-536.
8. Guo Q, Huang Y. 2008. “Automatic reasoning on main streams of tree river networks,”