ORIGINAL RESEARCH ARTICLE
A PROPOSAL OF SIMULATION OF WHEAT GRAIN PRODUCTIVITY
BY NITROGEN AND METEOROLOGICAL ELEMENTS
1*
Ana Paula Brezolin Trautmann,
2José Antonio Gonzalez da Silva,
1Osmar Bruneslau Scremin,
1
Anderson Marolli,
1Rubia Diana Mantai,
1Ângela Teresinha Woschinski De Mamann,
1Ari
Higino Scremin and
2e Natiane Carolina Ferrari Basso
1
Departament of Exact Science and Engineering, Regional Northwest University of Rio Grande do Sul, 3000
Comércio Street, Ijuí, RS, 98700-000, Brazil
2
Department of Agrarian Studies, Regional Northwest University of Rio Grande do Sul, 3000 Comércio Street,
Ijuí, RS, 98700-000, Brazil
ARTICLE INFO ABSTRACT
The development of efficient simulation models can facilitate the crop planning and the crop predictability analysis. The objective of the study is to propose a simulation model of wheat grain productivity by the nitrogen supply management with variables related to the plant and the meteorological elements, in high succession systems and reduced N-residual release. In the study, two experiments were conducted in 2013, 2014 and 2015, one to quantify the biomass productivity and another one to stablish grain productivity. The design was a randomized block with four replicates in factorial 4 x 3, for N-fertilizer doses (0, 30, 60, 120 kg ha-1) and nutrient supply forms [single condition (100%) at the phenological stage V3 (third leaf expanded); fractionated, (70 and 30%) in the phenological stage V3/V6 (third and sixth leaf expanded); fractionated (70 and 30%) in the phenological stage V3/E (third leaf expanded and in the beginning of grain filling)], and respectively, in soy/wheat and corn/wheat systems. The proposed model that interacts polynomial regression with multiple linear regression is efficient in the simulation of wheat grain productivity in the single and fractionated supply of nitrogen with weather elements in the systems of high and low release of N-residual.
Corresponding author:
Copyright ©2017,Ana Paula Brezolin Trautmann et al. This is an open access article distributed under the Creative Commons Attribution License, which permits unrestricted use, distribution, and reproduction in any medium, provided the original work is properly cited.
INTRODUCTION
Wheat is the second most produced and consumed cereal in the world, with significant importance in the global agricultural economy due to the great demand of its derivatives in the production of food (Camponogara et al., 2016; Santos et al., 2016). Wheat grain productivity is dependent on cultivation techniques, genetic potential of cultivars, and edaphoclimatic conditions (Pinnow et al., 2013; Ferrari et al., 2016). Among the cultivation techniques, nitrogen management is decisive on wheat productivity (Chavarria et al., 2015). The cultivars of wheat of high genetic potential are highly dependent on nitrogen fertilization and appropriate weather conditions to obtain high productivity (Rosa et al., 2009; Silva et al., 2014). Nitrogen fertilization becomes necessary because of the insufficient quantity in the soil, generating the need for the nutrient supply in the form of fertilizers (Costa et al., 2013; Pietro-Souza et al., 2013). It is worth noting that the weather conditions and cropping systems alter the use efficiency of nitrogen on the biomass and wheat grain productivity (Arenhardt et al., 2015, Ferrari et al., 2016). The quantity and appropriate timing of nitrogen supply in wheat must be better explored. Small doses limit the productivity and high doses increase the production costs and favor lodging (Ma et al., 2010; Arenhardt et al., 2015), apart from environmental contamination by nutrient losses (Theago et al., 2014; Arenhardt et al., 2015). The higher efficiency of the nitrogen in the
ISSN: 2230-9926
International Journal of Development Research
Vol. 07, Issue, 07, pp.13985-13992, July,2017
Article History:
Received 05th April, 2017
Received in revised form 29th May, 2017 Accepted 26th June, 2017
Published online 31st July, 2017
Citation: Ana Paula Brezolin Trautmann, José Antonio Gonzalez da Silva, Osmar Bruneslau Scremin, Anderson Marolli, Rubia Diana Mantai,
Ângela Teresinha Woschinski De Mamann, Ari Higino Scremin and e Natiane Carolina Ferrari Basso. 2017. “A proposal of simulation of wheat grain
productivity by nitrogen and meteorological elements”, International Journal of Development Research, 7, (07), 13985-13992.
ORIGINAL RESEARCH ARTICLE Open Access
Keywords:
Triticum Aestivum, Succession Systems, Regression,
coverage is directly linked to adequate soil moisture, condition not always obtained at the time of fertilization (Santos et al., 2016; Silva et al., 2016b). Therefore, research aimed at the fertilization improvement suggests that fractionated nitrogen supply can reduce losses with greater use of the nutrient to the elaboration of biomass and grains (Ferrari et al., 2016). Although there are several estimation models of grain productivity in cereals (Souza et al., 2013; Rosa et al., 2015), few studies have been carried out to simulate the productivity of wheat involving, simultaneously, variables related to the plant, the weather condition and important managements that influence productivity (Silva et al., 2016b; Mantai et al., 2017). Therefore, the simulation of grain productivity of wheat by the analysis of the biomass productivity and harvest index, with the determination of the thermal sum and precipitation in the crop cycle and involving the management of nitrogen in different doses and provided in single and fractionated way, can contribute to the development of an efficient simulation model of crop predictability in agricultural systems. The objective of the study is to propose a simulation model of wheat grain productivity by nitrogen supply management with variables related to plant and meteorological elements, in high succession systems and reduced N-residual release.
MATERIALS AND METHODS
The field experiments were conducted in the years 2013, 2014 and 2015, in Augusto Pestana (28° 26' 30" South and 54° 00' 58" West), Rio Grande do Sul, Brazil. The soil of the experimental area is classified as typical dystrophic red latosol and the climate is classified as Cfa, according to Köppen classification, with hot summer and without dry season. Ten days before sowing, soil analysis was performed and identified in the average of the years the following chemical characteristics (Tedesco et al., 1995): i) soy/wheat system (pH= 6.5, P= 23.6 mg dm-3, K= 295 mg dm-3, OM= 2.9%, Al= 0 cmolc dm-3, Ca= 6.8 cmolc dm-3, and Mg= 3.1 cmolc dm-3) and; ii) corn/wheat system (pH= 6.1, P=49.1 mg dm-3, K= 424 mg dm-3, OM= 3.0%, Al= 0 cmolc dm-3, Ca= 6.3 cmolc dm-3 and Mg= 2.5 cmolc dm-3). Sowing was carried out according to the wheat technical indications, mechanically, with experimental units using 5 rows of 5 m in length and spaced 0.20 m apart, totaling 5 m2. In sowing were applied 30 and 20 kg ha-1 of P2O5 and K2O, respectively, based on the soil P and K contents for expected grain productivity of 3 t ha-1 and N at the base with
10 kg ha-1, the remainder aiming to contemplate the doses proposed in coverage, with nitrogen made available in the form of urea. The seeds have been submitted to germination and vigor tests in laboratory in order to provide the desired density of 400 viable seeds per m2. During the execution of the study were performed applications of the fungicide tebuconazole in the dosage of 0.75 L ha-1. Weed control was performed with metsulfuron-metil herbicide at the dose of 4g ha-1. In the study, BRS Guamirim low-growing, early-season, resistant to lodging, of commercial class type “bread”, with high productive potential was used. This cultivar represents the standard biotype commonly desired by the triticulturists of southern Brazil.
In each cultivation system (soybean/wheat, corn/wheat), two experiments were conducted, one to quantify biomass production and another for grain productivity. In both experiments the design was of randomized blocks with four replicates in a 4 x 3 factorial scheme for N fertilizer doses (0, 30, 60 and 120 kg ha-1) and forms of nutrient supply [single way (100%) in the V3 phenological
stage (third leaf expanded); fractionated (70 and 30%) in the V3/V6 phenological stages (third and sixth leaves expanded); and
fractioned (70 and 30%) in the V3/E phenological stages (third leaf expanded and early grain filling)], respectively, totaling 192
experimental units. It is noteworthy that in all the years of cultivation the application of N-fertilizer in V3, V6 and E, occurred at
30, 60 and 90 days after emergence of wheat, respectively. The harvest of the experiments to estimate the productivity of biomass and grains occurred manually by cutting the three central lines of each plot, near the harvest point (125 days), with grain moisture of 15% (Silva et al., 2015). The plots directed to the grain harvest were harvested with a stationary harvester and sent to the laboratory for correction of grain moisture to 13%, after weighing and estimation of grain productivity (GP, kg ha-1). The plots for biomass analysis were directed to a forced air heater at 65 ºC until reaching constant weight for weighing and estimation of biomass productivity (BP, kg ha-1). The values of the general averages, along with the information of temperature and rainfall, were used to classify the years as unfavorable, intermediate and favorable to the crop. The meteorological data of thermal sum and pluviometric precipitation were obtained through a meteorological station located at about 500 meters from the experiments. The thermal sum (Ts) was obtained from the emergence of plants by the following model:
(1)
where Tmax = maximum temperature; Tmin = minimum temperature; n = number of days of the sowing-harvest period; Bt = base
temperature. The base temperature used in the study was 4 ºC, according to results found by Pedro Júnior et al. (2004). Catering to the assumptions of normality and homogeneity via Bartlett tests, variance analysis for detection of main and interaction effects was carried out. The adjustment of the polynomial regression equation in the estimation of the harvest index (HI) was performed as a function of the nitrogen rates, in each supply condition (V3, V3/V6 and V3/E), given by:
(2)
where a, b and c are coefficients obtained by polynomial regression and x and x2 are the nitrogen rates. For the composition of the multiple linear regression model in the estimation of wheat biomass productivity, involving meteorological variables (thermal sum and precipitation) and nitrogen doses, the potential variables were chosen through the StepWise technique. This procedure iteratively constructs a sequence of regression models by adding and removing variables, selecting the ones with larger relation to the main variable (y), using the statistic of partial F, according to the model:
where SQR is the quadratic sum of the regression and MQ x , x is the quadratic average of the error in the model containing the
variables x1 and xj. The variables selected through StepWise were used to determine the multiple linear regression equation, for
the simulation of wheat biomass productivity (BP), given by an equation of the type
(4)
where b , b , b , b , … , b are coefficients obtained by multiple linear regression and x, x , x , x , … , x are variables classified as significant by the StepWise model. The equation is described in matrix form as:
(5)
From these matrices is obtained the value of the regression coefficients, considering
(6)
and the variance of these coefficients obtained by the matrix of covariance of the vector of regression coefficients:
(7)
(8)
where n is the number of equations and p is the number of parameters. The hypothesis test verified H : β = 0 vs H : β ≠ 0, ≠ 0, expressed by:
(9)
Since wheat grain productivity is the product between biomass productivity and harvest index (GP = BP x HI), equation 10 represents the proposed model for the simulation of grain productivity of wheat, given by the combination of equation 4 with equation 2, expressed by:
(10)
All statistical procedures have been performed using the software Genes.
RESULTS AND DISCUSSION
In Figure 1C, at the moment of supply of nitrogen at the V3 stage in 2015, the average maximum temperature was the highest in
relation to the other years. High temperatures were observed without rainfall before or after fertilization, favoring losses of nutrients by volatilization, implying reduction of the development of fertilizers and spikes per area. The N-fertilizer application in the phenological stage V6 was followed by high volume of rainfall, favoring the loss of nutrient by leaching. At the phenological
stage E, little quantity of the supply was assimilated by the plant due to the long period of rainfall followed by high temperatures. These facts, along with productivity averages (Tables 1), classify the year of 2015 as intermediate (IY) to the crop. In 2013 (Figure 1A), the occurrence of rainfall in days prior to N-fertilizer supply, at the phenological stages V3, V6 and E, implied in soil moisture
favorable to the nutrient management and, in addition, with milder temperatures in the vegetative cycle, favoring the production of tillers and distribution of photoassimilates to the productivity. Under these conditions and according to Table 1, the total rainfall volume was similar to the historical average, with adequate rainfall distribution throughout the cycle (Figure 1). These characteristics were decisive in the higher productivity, characterizing 2013 as a favorable year (FY) to the crop. In 2014 (Figure 1B), there were high temperatures followed by excessive rainfall in the beginning of the crop development cycle, a condition also observed near to the grain harvest.
These facts justify the lower productivity (Table 1), either due to the loss of nutrients because of leaching in V3, with a reduced
Figure 1. Rainfall and maximum temperature in the crop cycle of wheat with the days of nitrogen application. DE = date of emergence: 2013 (17 June);
(25 June) 2015 (27 June). DAE = days after emergence. V3 = full condition (100%) of the nitrogen dose in the third leaf expanded. V3/V6 = fractioned
condition (70 and 30%) of the nitrogen dose in the third and sixth leaves expanded, and V3/E = fractioned condition (70 and 30%) of the nitrogen dose in
the third leaf expanded and beginning of grain filling
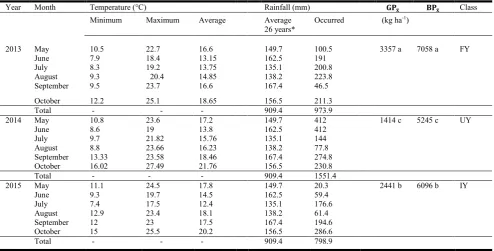
Table 1. Temperature and rainfall in the cultivation months and the average of productivity
Year Month Temperature (°C) Rainfall (mm) Class
Minimum Maximum Average Average 26 years*
Occurred (kg ha-1)
2013 May 10.5 22.7 16.6 149.7 100.5 3357 a 7058 a FY
June 7.9 18.4 13.15 162.5 191
July 8.3 19.2 13.75 135.1 200.8
August 9.3 20.4 14.85 138.2 223.8
September 9.5 23.7 16.6 167.4 46.5
October 12.2 25.1 18.65 156.5 211.3
Total - - - 909.4 973.9
2014 May 10.8 23.6 17.2 149.7 412 1414 c 5245 c UY
June 8.6 19 13.8 162.5 412
July 9.7 21.82 15.76 135.1 144
August 8.8 23.66 16.23 138.2 77.8
September 13.33 23.58 18.46 167.4 274.8
October 16.02 27.49 21.76 156.5 230.8
Total - - - 909.4 1551.4
2015 May 11.1 24.5 17.8 149.7 20.3 2441 b 6096 b IY
June 9.3 19.7 14.5 162.5 59.4
July 7.4 17.5 12.4 135.1 176.6
August 12.9 23.4 18.1 138.2 61.4
September 12 23 17.5 167.4 194.6
October 15 25.5 20.2 156.5 286.6
Total - - - 909.4 798.9
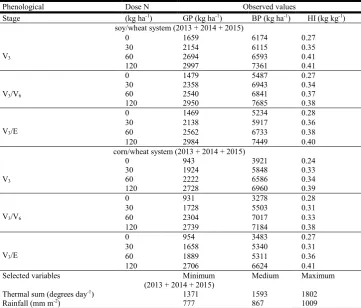
[image:4.595.30.525.499.750.2]Table 2. Average values of biological productivity, grain productivity and wheat harvest index under the conditions of nitrogen supply in the succession systems
Phenological Dose N Observed values
Stage (kg ha-1) GP (kg ha-1) BP (kg ha-1) HI (kg kg-1)
soy/wheat system (2013 + 2014 + 2015)
V3
0 1659 6174 0.27
30 2154 6115 0.35
60 2694 6593 0.41
120 2997 7361 0.41
V3/V6
0 1479 5487 0.27
30 2358 6943 0.34
60 2540 6841 0.37
120 2950 7685 0.38
V3/E
0 1469 5234 0.28
30 2138 5917 0.36
60 2562 6733 0.38
120 2984 7449 0.40
corn/wheat system (2013 + 2014 + 2015)
V3
0 943 3921 0.24
30 1924 5848 0.33
60 2222 6586 0.34
120 2728 6960 0.39
V3/V6
0 931 3278 0.28
30 1728 5503 0.31
60 2304 7017 0.33
120 2739 7184 0.38
V3/E
0 954 3483 0.27
30 1658 5340 0.31
60 1889 5311 0.36
120 2706 6624 0.41
Selected variables Minimum Medium Maximum
(2013 + 2014 + 2015)
Thermal sum (degrees day-1) 1371 1593 1802
Rainfall (mm m-2) 777 867 1009
N Dose = dose of nitrogen (kg ha-1); V
3 = full condition (100%) of the nitrogen dose in the third leaf expanded, V3/V6 = fractional condition (70 and 30%) of the
nitrogen dose in the third and sixth leaves expanded; V3/E = fractional condition (70 and 30%) of the nitrogen dose in the third leaf expanded and beginning of
[image:5.595.59.542.435.569.2]grain filling; GP = grain productivity (kg ha-1); BP = biomass productivity (kg ha-1); HC = harvest index (kg kg-1)
Table 3. Polynomial regression equation for estimation of the harvest index under the conditions of nitrogen supply in the cropping systems
Phenological Equation P R2
Stage 2
Ndose
Ndose G
F E
HI (bix) (%)
soy/wheat system (2013 + 2014 + 2015)
V3 0.27 3.1103Ndose 1.6105Ndose2 * 99
V3/V6 0.26 2.6103Ndose 1.4105Ndose2 * 99
V3/E 0.28 2.4103Ndose 1.2105Ndose2 * 96
corn/wheat system (2013 + 2014 + 2015)
V3 0.24 1.9103Ndose 8.5106Ndose2 * 89
V3/V6 0.23 2.4103Ndose 1.1105Ndose2 * 99
V3/E
Ndose
3
10 1 . 1 24 .
0 * 90
V3 = Full condition (100%) of the nitrogen dose in the third leaf expanded; V3/V6 = Fractional condition (70 and 30%) of the nitrogen dose in the third and sixth
leaves expanded; V3/E = fractional condition (70 and 30%) of the nitrogen dose in the third leaf expanded and beginning of the grain filling; R2 = Coefficient of
determination; P (bix) = Probability of significance of the slope of the line; Ndose = dose of nitrogen
Table 4. Identification of potential variables via StepWise for the composition of multiple linear regression model to the simulation of wheat biomass productivity
Source of Middle Square/StepWise Model
Variation V3 V3/V6 V3/E
soy/wheat system (2013 + 2014 + 2015)
Regression 645508750* 723117769* 448795250*
Doses (N) (Ndose) 25524628* 26858344* 21340402*
Thermal Sum (TS) 185376* 275689* 17932755*
Rainfall (Rain) 11466795* 12608601* 13007953*
Error 2053370 3056952 2172296
corn/wheat system (2013 + 2014 + 2015)
Regression 381279637* 493176333* 397702003*
Doses (N) (Ndose) 33204366* 55227835* 48673854*
Thermal Sum (TS) 134971* 1587386* 1093195*
Rainfall (Rain) 40916448* 51662350* 76799602*
Error 1570385 1797387 1273198
Days of the cycle (Days) = Days of biomass cuts (30, 60, 90 and 120 days); Thermal sum (TS) degrees day-1; Precipitation (Prec) mm m-2; Doses (N) (Nose) = Nitrogen doses - 0, 30, 60, 120 kg N ha-1; V
3 = Full condition (100%) of the nitrogen dose in the third leaf; expanded V3/V6 = Fractional condition (70%/30%) of
the nitrogen dose in the third and sixth leaves expanded; V3/E = Fractional condition (70%/30%) of the nitrogen dose in the third leaf expanded and beginning of
[image:5.595.99.497.625.760.2]Table 5. Multiple regression equation to estimate biomass productivity under nitrogen supply conditions in cropping systems
Phenological Equation
Stage BP = A ± B ± C ± D soy/wheat system (2013 + 2014 + 2015)
V3 9122.20 + 10.74 2.58 + 1.13
V3/V6 9846.90 + 15.95 4.63 + 3.95
V3/E 9236.76 + 18.42 2.66 + 0.43
corn/wheat system (2013 + 2014 + 2015) V3 10344.76 + 23.08 1.69 3.50
V3/V6 13899.41 + 30.69 4.55 2.90
V3/E 14031.39 + 23.36 4.13 4.03
V3 = Full condition (100%) of the nitrogen dose in the third leaf expanded; V3/V6 = Fractional condition (70 and 30%) of the nitrogen dose in the third and sixth
leaves expanded; V3/E = fractional condition (70 and 30%) of the nitrogen dose in the third leaf expanded and beginning of grain filling; Ts = Thermal sum
(degrees days-1); Rain = Rainfall (mm); N dose = Nitrogen doses; A, B, C, D = regression coefficients; BP = biomass productivity (kg ha-1)
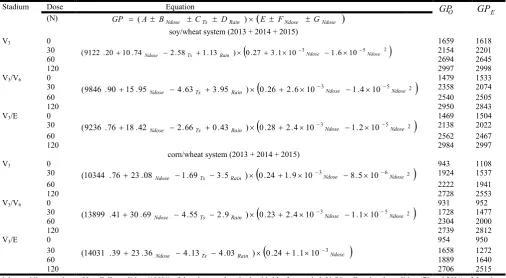
Table 6. Mathematical model for estimating grain productivity in each nitrogen supply condition in cropping systems
Stadium Dose Equation
O
GP GPE
(N) GP (A BNdose CTs DRain )
E FNdose GNdose
soy/wheat system (2013 + 2014 + 2015)
V3 0 1659 1618
30
3 5 2
10 6 . 1 10 1 . 3 27 . 0 ) 13 . 1 58 . 2 74 . 10 20 . 9122
( Ndose Ts Rain Ndose Ndose
2154 2201
60 2694 2645
120 2997 2998
V3/V6 0 1479 1533
30 (9846 .90 15.95 4.63 3.95 )
0.26 2.6 10 3 1.4 10 5 2
Ndose Ndose
Rain Ts
Ndose
2358 2074
60 2540 2505
120 2950 2843
V3/E 0 1469 1504
30 (9236 .76 18.42 2.66 0.43 )
0.28 2.4 10 3 1.2 10 5 2
Ndose Ndose
Rain Ts
Ndose
2138 2022
60 2562 2467
120 2984 2997
corn/wheat system (2013 + 2014 + 2015)
V3 0 943 1108
30 (10344 .76 23.08 1.69 3.5 )
0.24 1.9 10 3Ndose 8.5 10 6Ndose 2
Rain Ts Ndose
1924 1537
60 2222 1941
120 2728 2553
V3/V6 0 931 952
30 (13899 .41 30.69 4.55 2.9 )
0.23 2.4 10 3Ndose 1.1 10 5Ndose2
Rain Ts Ndose
1728 1477
60 2304 2000
120 2739 2812
V3/E 0 954 950
30
Ndose Rain Ts Ndose 3 10 1 . 1 24 . 0 ) 03 . 4 13 . 4 36 . 23 39 . 14031
( 1658 1272
60 1889 1640
120 2706 2515
N dose = Nitrogen doses; V3 = Full condition (100%) of the nitrogen dose in the third leaf expanded; V3/V6 = Fractional condition (70 and 30%) of the nitrogen
dose in the third and sixth leaves expanded; V3/E = fractional condition (70 and 30%) of the nitrogen dose in the third leaf expanded and beginning of grain
filling; Ts = Thermal sum (degrees days-1); Rain = Rainfall (mm); GPO = Observed grain productivity (kg ha-1); GPE = Estimated grain productivity (kg ha-1)
The nitrogen efficiency to the obtention of high productivities in wheat depends on the availability of water in the soil, because water deficiency limits the plant's response to fertilizer application (Martin et al., 2006). Therefore, the favorable climate for the cultivation of wheat, described as one with milder temperatures and with quality of radiation in favor of tillering and filling of grains, without occurrence of rains in great quantity and intensity, but promoting an adequate moisture stored in the soil (Pereira et al., 2015; Marolli et al., 2017). The proposal of simulation of wheat grain productivity per agricultural year does not contemplate efficient models, considering the strong variation between the years of cultivation, interfering in the use of nitrogen to the elaboration of the productivity (Table 1, Figure 1). Therefore, the cumulative effect of the variability among the unfavorable, intermediate and favorable years were considered for the obtention of the values of thermal sum, precipitation and productivity of biomass and grains. Table 2 presents the averages of biomass productivity, grain productivity and wheat harvest index in each nitrogen supply condition in the succession systems, as well as the minimum, medium and maximum values of the meteorological variables. Table 3 shows the models that aim to estimate the wheat harvest index under the conditions of single and fractionated nitrogen supply in the different succession systems. Regardless of the phenological stage and the cultivation system, the models showed a quadratic tendency, except in the fractional condition in V3/E in the corn/wheat system, which presented a linear
[image:6.595.46.553.230.508.2]considering the increase in the coefficient of determination, resulting from its inclusion in the multiple linear regression model (Mantai et al., 2016). The use of this method leads to the exclusion of some variable models initially defined due to the reduced importance they present (Ribeiro and Jorge 2014). Balbinot et al. (2005), in corn, selected through StepWise the components spike mass, number of grains per row, number of rows per spike and number of plants and ears per area as the most appropriate in the simulation of grain productivity. Mantai et al. (2016), simulated the oat productivity through the multiple model with the variables, selected through the StepWise technique, panicle harvest index, number of grains and spikelets in the panicle and nitrogen. Godoy et al. (2015), in rice, selected through the StepWise technique, copper, nitrogen, iron and acid phosphatase for composition of the multiple model to the productivity simulation. Table 5 shows the equations of multiple linear regression for simulation of wheat biomass productivity in the conditions of nitrogen supply with the meteorological elements in the cropping systems. In this simulation were used the values presented in Table 2 along with the potential variables validated by the StepWise technique (Table 4).
The identification of components that influence productivity is decisive in the elaboration of simulation models (Leal et al., 2015). The multiple linear regression models make possible to identify these variables with efficiency to compose the simulation model (Silva et al., 2016a). Mercante et al. (2010), used the multiple linear regression method, considering the NDVI and GVI vegetation indexes, proposing accurate models of soy productivity prediction. Lacerda et al. (2015), estimated by multiple linear regression the soy and corn productivity, according to the total amounts of N, P2O5 and K2O. Souza et al. (2013), simulated wheat grain
productivity through the Jensen model, using the coefficients obtained by multiple linear regression. Through the multiple linear regression model, Pinto et al. (2016), estimated the irrigated rice productivity by sprinkling (kg ha-1), considering the water tension and chemical and physical attributes of the soil. Table 6 shows the models for simulation of grain productivity of wheat under the conditions of nitrogen supply in the cropping systems. In this simulation, the model combines multiple linear regression models (Table 5) and polynomial regression (Table 3), which simulate biomass productivity and harvest index, respectively. For such simulation, were used the values presented in Table 2. The grain productivity values observed showed linear increase with the increment of chemical fertilizer, regardless of the succession system. This tendency of grain productivity increase was also obtained through the proposed model. In addition, the results simulated by the model are very close to those observed in real conditions of cultivation. Therefore, it proved to be an accurate model to estimate the productivity of wheat considering the conditions of nitrogen fertilization along with meteorological factors in the systems of high and reduced N-residual release. Due to the importance of estimating crop productivity, mathematical models can provide data to feed crop productivity forecasting systems, allowing the identification of factors that act along the crop cycle (Rosa et al., 2009). In addition, simulation models are tools that allow to analyze scenarios, considering the various combinations of factors that influence crop productivity (Gomes et al., 2014). However, the possibility of integrating two or more models is a way of obtaining a more efficient model, making possible the estimation of parameters, learning and simulations (Silva et al., 2014).
Conclusion
The proposed model that interacts polynomial regression with multiple linear regression is efficient in the simulation of grain productivity of wheat in single and fractionated nitrogen supply with meteorological elements in the systems of high and low N-residual release.
Acknowledgment
To CAPES, CNPq, FAPERGS and UNIJUÍ for the resources to the development of the research and for the scientific, technological initiation and productivity scholarships.
REFERENCES
Almeida B, Silva E, Silva F, Costa AM 2016. The impact of milk productivity and morphologic quality in dairy farms economic viability. Revista de Ciências Agrárias, 39:291-299.
Arenhardt EG, Silva JAG, Gewehr E, Oliveira AC, Binelo MO, Valdiero AC, Gzergorczick ME, Lima ARC 2015. The nitrogen supply in wheat cultivation dependent on weather conditions and succession system in southern Brazil. African Journal of Agricultural Research, 10:4322-4330.
Arf O, Rodrigues RAF, Nascente AS, Lacerda MC 2015. Row spacing and nitrogen fertilization as affecting upland rice development under no-tillage. Revista Ceres, 62:475-482.
Balbinot JrAA, Backes RL, Alves AC, Ogliari JB, Fonseca JA 2005. Contribution of yield components on grain yield in maize open pollinated varieties. Revista Brasileira Agrociência, 11:161-166.
Camponogara AS, Oliveira GA, Georgin J, Rosa ALD 2016. Assessment of Wheat Yield When Subject to Various Sources of Nitrogen. Revista Eletrônica em Gestão, Educação e Tecnologia Ambiental 20:524 532.
Chavarria G, Rosa WP, Hoffmann L, Durigon M R 2015. Growth regulator in wheat: effects on vegetative development, yield and grain quality. Revista Ceres, 62:583-588.
Condé ABT, Coelho MAO, Yamanaka CH, Corte HR 2010. Adaptability and stability of wheat genotypes under drought conditions in Minas Gerais. Pesquisa Agropecuária Tropical, 40:45-52.
Costa L, Zucareli C, Riede CR 2013. Splitting of nitrogen fertilization on the yield performance of wheat genotypes. Revista Ciência Agronômica, 44:215-224.
Espindula MC, Rocha VS, Souza MA, Grossi JAS, Souza LT 2010. Doses, sources and time of nitrogen application on irrigated wheat under no-tillage. Ciência de Agrotecnologia, 34:1404-1411.
Godoy SG, Stone LF, Ferreira EPB, Cobucci T, Lacerda MC 2015. Correlation between upland rice yield under no-tillage system and soil attributes. Revista Brasileira de Engenharia Agrícola e Ambiental, 19:19–125.
Gomes ACS, Robaina AD, Peiter MX, Soares FC, Parizi ARC 2014. Model to estimate the yield for soybean. Ciência Rural, 44:43-49. Lacerda JJJ, Resende ÁV, Furtini Neto AE, Hickmann C, Conceição OPda 2015. Fertilization, grain yield and profitability of the rotation
between soybean and corn in soil with improved fertility. Pesquisa Agropecuária Brasileira, 50:769-778.
Leal AJF, Miguel EP, Baio FHR, Neves DC, Leal UAS 2015. Artificial neural networks for corn yield prediction and definition of site-specific crop management through soil properties. Bragantia 74:436-444.
Ma BL, Wu TY, Tremblay N, Deen W, Mclaughlin NB, Morrison M, Stewart G 2010. On-farm assessment of the amount and timing of nitrogen fertilizer on ammonia volatilization. Agronomy Journal, 102:131-144.
Mantai RD, Silva JAG, Arenhardt EG, Heck TG, Sausen ATZR, Krüger CAMB, Cardoso AM, Goi Neto CJ, Krysczun DK 2015. The effect of nitrogen dose on the yield indicators of oats. African Journal of Agricultural Research, 10:3773-3781.
Mantai RD, Silva JAG, Arenhardt EG, Scremin OB, Mamann ÂTW, Frantz RZ, Valdiero AC, Pretto R, Krysczun DK 2016. Simulation of oat grain (Avena sativa) using its panicle components and nitrogen fertilizer. African Journal of Agricultural Research, 11:3975-3983.
Mantai RD, Silva JAG, Marolli A, Mamann ÂTW, Sawicki S, Krüger CAMB 2017. Simulation of oat development cycle by photoperiod and temperature. Revista Brasileira de Engenharia Agrícola e Ambiental, 21:3-8.
Marolli A, Silva JAG, Mantai RD, Brezolin AP, Gzergorczick ME, Lambrecht DM 2017. Oat yield through panicle components and growth regulator. Agriambi, 2:261-266.
Martin TN, Fross LAS, Nunes UR, Marchesan E, Stecca JDL, Cunha VdosS 2016. Economic recommendations for reseeding wheat crops. Acta Scientiarum Agronomy, 38:345-353.
Mercante E, Lamparelli RAC, Uribe-Opazo MA, Rocha JV (2010). Linear regression models to soybean yield estimate in the west region of the state of Paraná, Brazil, using spectral data. Engenharia Agrícola, 30:504-517.
Pádua EJ, Guerra AR, Zinn YL 2015. Modeling Bulk Density Of Subsoil Under Native Vegetation In Minas Gerais, Brazil. Revista Brasileira de Ciência do Solo, 39:725-736.
Pedro Júnior MJ, Camargo MBP, Moraes AVC, Felício JC, Castro JL 2004. Base-temperature, growing degree-days and crop growth cycle duration of triticale cultivars. Bragantia, 63:447-453.
Pereira MWG, Arêdes AF, Teixeira EC 2015. Economic evaluation of growing wheat in the states of Rio Grande do Sul and Parana. Revista Brasileira de Ciências Agrárias, 10:591-610.
Pietro-Souza W, Bonfim-Silva EM, Schlichting AF, Silva MC 2013. Initial development of wheat under different nitrogen levels in an Oxisol of the ‘Cerrado’. Revista Brasileira de Engenharia Agrícola e Ambiental, 17:575–580.
Pimentel AJB, Guimarães JFR, Souza MA, Resende MDV, Moura LM, Rocha Jurior ASC, Ribeiro G 2014. Estimation of genetic parameters and prediction of additive genetic value for wheat by mixed models. Pesquisa Agropecuária Brasileira, 49:882-890. Pinnow C, Benin G, Viola R, Silva CLS, Gutkoski LC, Cassol LC 2013. Baking quality of wheat in response to green manure and
nitrogen rates. Bragantia, 72:20-28.
Pinto MAB, Parfitt JMB, Timm LC, Faria LC, Scivittaro WB 2016. Sprinkler-irrigated rice yield in lowlands as a function of water availability and soil attributes. Pesquisa Agropecuária Brasileira, 51:1584-1593.
Ribeiro NAB, Jorge SMF 2014. Determinants of indebtedness in local government: an exploratory study of municipalities in northern Portugal. Revista Innovar, 24:61-78.
Romitti MV, Dornelles EF, Silva JAG, Marolli A, Mantai RD, Scremin OB, Arenhardt EG, Brezolin AP, Reginatto DC, Scremin AH, Lima ARC, Silva DR 2017. The sowing density on oat productivity indicators. African Journal of Agricultura Research, 12:905-915. Rosa HT, Walter LC, Streck NA, Alberto CM 2009. Thermal time methods and sowing dates in phyllochron determination in wheat
cultivars. Pesquisa Agropecuária Brasileira, 44:1374-1382.
Rosa HT, Walter LC, Streck NA, Carli C, Ribas GG, Marchesan E 2015. Simulation of rice growth and yield in Rio Grande do Sul with the SimulArroz. Revista Brasileira de Engenharia Agrícola e Ambiental, 19:1159–1165.
Santos SMC, Antonangelo JA, Deus ACF, Fernandes DM 2016. Perdas de amônia por volatilização em resposta a adubação nitrogenada do feijoeiro. Revista de Agricultura Neotropical, 3:16–20.
Silva AAV, Silva IAF, Teixeira Filho MCM, Buzetti S, Teixeira MCM 2014. Estimate of wheat grain yield as function of nitrogen fertilization using neuro fuzzy modeling. Revista Brasileira de Engenharia Agrícola e Ambiental, 18:180–187.
Silva CA, Agostini PdaS, Callegari MA, Santos RdeKSdos, Novais AK, Pierozan CR, Pereira Junior AM, Bastos J, Gasó JG 2016a. Factors affecting the performance of pigs in the growing and finishing phases. Pesquisa Agropecuária Brasileira, 51:1780-1788. Silva JAG, Arenhardt EG, Krüger CAMB, Lucchese OA, Metz M, Marolli A 2015. The expression of the components of wheat yield by
technological class and nitrogen use. Revista Brasileira de Engenharia Agrícola e Ambiental, 19:27-33.
Silva JAG, Goi Neto CJ, Fernandes SBV, Mantai RD, Scremin OB, Pretto R 2016b. Nitrogen efficiency in oats on grain yield with stability. Revista Brasileira de Engenharia Agrícola e Ambiental, 20:1095-1100.
Souza JLM, Gerstemberger E, Araujo MA 2013. Calibration of agrometeorological models for predicting the wheat crop productivity, considering soil tillage systems, in Ponta Grossa Region, State of Parana, Brazil. Revista Brasileira de Meteorologia, 28:409-418. Tedesco MJ, Gianello C, Bissani CA, Bohnen H, Volkweiss SJ 1995. Analysis of soil, plants and other materials. Porto Alegre:
Departamento de Solos, 1995. 174p. (Boletim técnico, 5).
Theago EQ, Buzetti S, Teixeira Filho MCM, Andreotti M, Megda MM, Benett CGS 2014. Doses, sources and time of nitrogen application on irrigated wheat under no-tillage. Revista Brasileira de Ciência do Solo, 38:1826-1835.
Trevizan K, Gregoleti E, Hoffmann AF 2015. Trinexapac-ethyl decrease lodging and increase yield of wheat cultivar TBIO Pioneer. Revista de Agronomia e Medicina Veterinária, 2:01-11.
Trindade MdaG, Stone LF, Heinemann AB, Cánovas AD, Moreira JAA 2006. Nitrogen and water as factors of wheat productivity in cerrado region. Revista Brasileira de Engenharia Agrícola e Ambiental, 10:24–29.