BIROn - Birkbeck Institutional Research Online
Davies, M.N. and Toseland, C.P. and Moss, David S. and Flower, D.R. (2006)
Benchmarking pKa prediction.
BMC Biochemistry 7 (articl), ISSN
1471-2091.
Downloaded from:
Usage Guidelines:
Please refer to usage guidelines at
or alternatively
research output of Birkbeck College
http://eprints.bbk.ac.uk
Davies, Matthew N.; Toseland, Christopher P.; Moss,
David S. and Flower, Darren R. (2006). Benchmarking pK
prediction.
a
BMC Biochemistry
7
, article18.
This is an exact copy of a paper published in
BMC Biochemistry
(ISSN
1471-2091). Copyright and all rights therein are retained by authors or by other
copyright holders. All persons downloading this information are expected to
adhere to the terms and constraints invoked by copyright. ©
2006 Davies et
al; licensee BioMed Central Ltd. This is an Open Access article distributed
under the terms of the Creative Commons Attribution License
(
http://creativecommons.org/licenses/by/2.0
) ,which permits unrestricted use,
distribution, and reproduction in any medium, provided the original work is
properly cited. The electronic version of this article is the complete one and
can be found online at
http://www.biomedcentral.com/1471-2091/7/18
Citation for this copy:
Davies, Matthew N.; Toseland, Christopher P.; Moss, David S. and Flower,
Darren R. (2006). Benchmarking pK prediction.
aLondon: Birkbeck ePrints.
Available at:
http://eprints.bbk.ac.uk/archive/00000510
Citation as published:
Davies, Matthew N.; Toseland, Christopher P.; Moss, David S. and Flower,
Darren R. (2006). Benchmarking pK prediction.
aBMC Biochemistry
7
,
article18.
http://eprints.bbk.ac.uk
BioMedCentral
BMC Biochemistry
Open Access
Research article
Benchmarking pK
a
prediction
Matthew N Davies*
†1, Christopher P Toseland
†1, David S Moss
2and
Darren R Flower
1Address: 1Edward Jenner Institute for Vaccine Research, Compton, Berkshire, RG20 7NN, UK and 2School of Crystallography, Birkbeck College, Malet Street, London WC1E 7HX, UK
Email: Matthew N Davies* - [email protected]; Christopher P Toseland - [email protected]; David S Moss - [email protected]; Darren R Flower - [email protected]
* Corresponding author †Equal contributors
Abstract
Background: pKa values are a measure of the protonation of ionizable groups in proteins.
Ionizable groups are involved in intra-protein, protein-solvent and protein-ligand interactions as well as solubility, protein folding and catalytic activity. The pKa shift of a group from its intrinsic
value is determined by the perturbation of the residue by the environment and can be calculated from three-dimensional structural data.
Results: Here we use a large dataset of experimentally-determined pKas to analyse the performance of different prediction techniques. Our work provides a benchmark of available software implementations: MCCE, MEAD, PROPKA and UHBD. Combinatorial and regression analysis is also used in an attempt to find a consensus approach towards pKa prediction. The tendency of individual programs to over- or underpredict the pKa value is related to the underlying
methodology of the individual programs.
Conclusion: Overall, PROPKA is more accurate than the other three programs. Key to developing accurate predictive software will be a complete sampling of conformations accessible to protein structures.
Background
A proper understanding of protein pKa values is essential to a proper understanding of pH-dependent characteris-tics of protein function. If the pKa of a particular group is known then one can determine its protonation state at a given pH, helping to determine several important proper-ties including protein solubility, protein folding and cata-lytic activity. Knowledge of the pKa values of the residues
of an active site can help to identify the reaction mecha-nism of an enzyme or aid in the interpretation of experi-mental results [1-4]. The pKa value is -log10(Ka) where Ka,
is the ionization constant, a measure of a titratable group's ability to donate a proton:
The pKa value is therefore equal to the pH when there is an equal concentration of the protonated and deprotonated groups in solution. Each residue with a titratable group has a model or 'intrinsic' pKa value, defined as the pKa value when all the other groups are fixed in their neutral state. Ionizable groups may be divided into acidic, which
Published: 02 June 2006
BMC Biochemistry 2006, 7:18 doi:10.1186/1471-2091-7-18
Received: 21 November 2005 Accepted: 02 June 2006
This article is available from: http://www.biomedcentral.com/1471-2091/7/18
© 2006 Davies et al; licensee BioMed Central Ltd.
This is an Open Access article distributed under the terms of the Creative Commons Attribution License (http://creativecommons.org/licenses/by/2.0), which permits unrestricted use, distribution, and reproduction in any medium, provided the original work is properly cited.
K H A
HA
a =
( )
+ −
[ ][ ]
Page 2 of 12 are neutral in their protonated state, and basic, which are
positively charged in their protonated state. The proto-nated and the non-protoproto-nated forms of a residue can be very different chemically. In the case of His, the proto-nated form is hydrophilic and positively charged while the non-protonated form has a hydrophobic and aro-matic character. Consequently the nature of the interac-tion made by an ionizable group may differ significantly at a pH above or below the pKa.
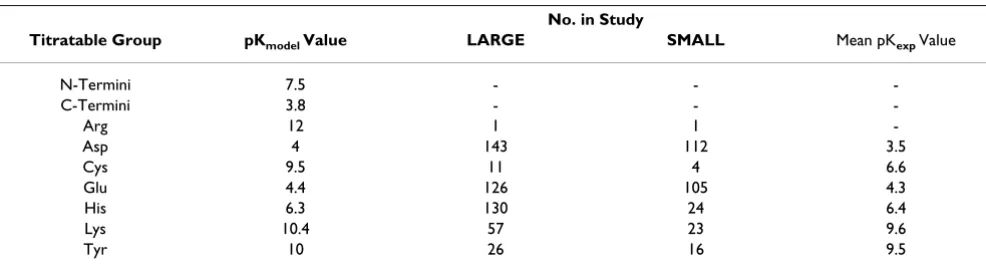
Table 1 shows the intrinsic or 'model' pKa values for all protein titratable groups [5]. However, in real protein-sol-vent systems, interactions between a residue and its envi-ronment will cause the titratable group's pKa value to deviate from that of the model. Hence the intrinsic pKa
value, pKModel, combined with the environmental pertur-bation, ΔpKa, describes the real pKa value of a group [6-9].
pKa = pKModel + ΔpKa (2)
The pKa shift caused by the environment is not easily quantified. This is especially true of ionizable residues within protein active sites as they often have markedly higher or lower values than the intrinsic pKa [5]. The three main factors that contribute towards environmental per-turbation of the pKa value are inter-molecular hydrogen bonding, the desolvation effect and Coulombic interac-tions. Previous studies have identified hydrogen bonding as the most important determinant of pKa values [6]. The hydrogen bonding strength is both distance and angle dependent and therefore the extent of the perturbation is heavily dependent on the position of the interacting resi-dues relative to each other. This is less of a factor with side chain hydrogen bonds than with main chain as the former is more flexible and therefore more likely to adopt an optimal orientation for hydrogen bond interactions. The desolvation effect is also important; this describes the energy that is required to move a group from a state of full solvation to a position within the folded protein. Desol-vation effects within the protein interior preferentially increases the energies of the negatively-charged, base
forms, which will increase the pKa value, while in the case of His, Lys and Arg, the desolvation preferentially increases the energy of the positively-charged, acid forms, which will decrease the pKa values. The extent of the shift is dependent on the degree to which the group is buried within the protein. The third of the major factors, which may cause a pKa shift, are Coulombic interactions
between ionizable groups. The pair-wise interactions are dependent on the charges of the respective groups, but also on their location as only residues that are buried pro-duce significant charge-charge interactions.
It is possible to predict the pKa value of a given protein res-idue from three-dimensional structural data. The pKa shift may be calculated from the difference in energy between the group's charged and neutral forms and added to the pKmodel value to estimate its true value. Several different algorithms have been developed to generate predicted pKa values based on structural data.
The majority of papers which have assessed the reliability of pKa predictive algorithms have only examined a limited number of proteins, making an evaluation of their accu-racy very difficult [6,10-13]. The largest of these [13] looked at 260 experimental pKa values taken from 41 pro-teins. Here we use a large pKa dataset of 100 proteins, which is more than double that of the most extensive pre-vious paper [13], to analyse the predictive capabilities of the MCCE [14,15], MEAD [16], PROPKA [17] and UHBD [18] programs. The programs differ in their methodology and we assessed the merits of each. An enhanced approach to the problem of pKa prediction is proposed.
Results and discussion
[image:4.612.57.550.595.729.2]Technical difficulties with the UHBD program, due to errors in the protonation of histidine residues, prevented the successful processing of all 100 proteins; in total only 43 could be completed. This lead to the creation of two separate datasets, the Large dataset (containing 492 resi-dues and excluding the UHBD program) and the Small Dataset (containing 280 residues and including the
Table 1: Model pKa values for all protein basic and acidic titratable groups. See reference 5.
No. in Study
Titratable Group pKmodel Value LARGE SMALL Mean pKexp Value
N-Termini 7.5 - -
-C-Termini 3.8 - -
-Arg 12 1 1
-Asp 4 143 112 3.5
Cys 9.5 11 4 6.6
Glu 4.4 126 105 4.3
His 6.3 130 24 6.4
Lys 10.4 57 23 9.6
BMC Biochemistry 2006, 7:18 http://www.biomedcentral.com/1471-2091/7/18
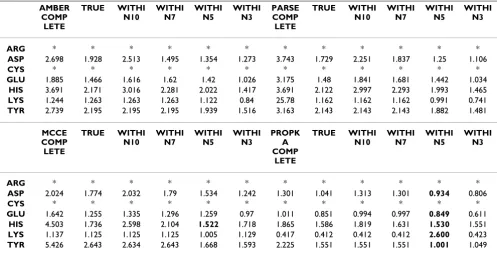
UHBD program). Several of the programs produced out-liers, in some cases outside of the physically possible pH 0–14 range. Outliers were removed from the dataset using a variety of different parameters to see the effect upon the overall accuracy of prediction Datasets were generated where all predicted values were lesser or greater than the intrinsic values by 3, 5, 7 and 10 pH units were removed as well a dataset where only physically possible values were included. This data is presented in Table 2 and Table 3. It may been seen from the data that in general the best results were obtained by using values within a range of 5 pH units. Using those parameters, 89 residues were removed from the Large dataset leaving 403 and 39 resi-dues were removed from the Small dataset leaving 241 residues. It is unlikely that the pKa of a titratable residues can deviate more than 5 pH units from the residue's intrinsic value (see Table 1).
The majority of the outliers in both datasets were gener-ated by the MEAD program, particularly when the PARCE force field was used. Considerably more residues are present within the +/- 1 unit bands for MCCE, UHBD and PROPKA. Thus there is a clear division between the per-formance of MEAD and that of the other programs. The
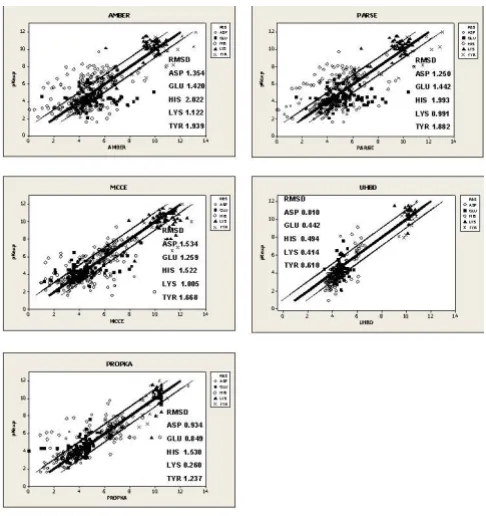
same trend may be seen in the Root Mean Squared Devi-ation (RMSD) values (Table 2, 3). PROPKA is more accu-rate for Asp, Glu, Lys and Tyr with RMSD values of 0.934, 0.849, 0.260 and 1.001 respectively. His is more accu-rately predicted by MCCE with an RMSD of 1.522. With respect to the Small dataset in Table 3, PROPKA is the best predictor for all residues except Glu and His, where UHBD performs best: RMSD of 0.442 and 0.494 respectively. The overall accuracy of each program to a level of <0.5 pKa units is 27% AMBER, 34% PARSE, 42% MCCE, 40% UHBD (242 dataset) and 48% PROPKA. When the error range is increased to <1 unit, the difference between the programs is more distinct: 56% AMBER, 56% PARSE, 71% MCCE, 67% UHBD (Small dataset) and 81% PROPKA (Table 4, 5). Scatter plots for each program are shown in Figure 1.
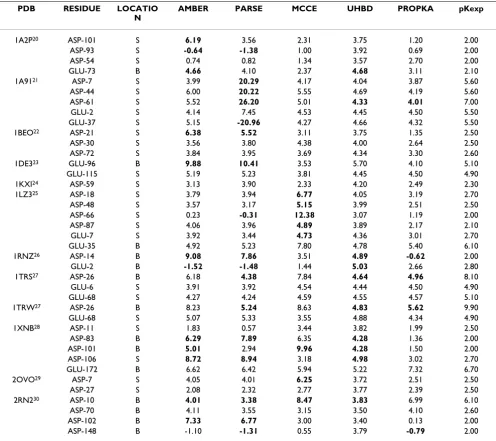
[image:5.612.58.555.409.665.2]From a previous study [19], 39 carboxyl residues found within protein active sites were selected. These are shown in Table 6[20-30]. The 27 Asp and 12 Glu residues have experimental values that differ from the model pKa value by at least 1 unit. Values for Asp and Glu range from 2.0 – 9.9 and 2.1 – 6.7 respectively. PROPKA and UHBD are distinct within the <0.5 and <1 unit error bands (Table 7),
Table 2: Overview of the prediction accuracy of the Large Dataset (404 Residues) I. The table shows the RMSD values for each of the residues from the whole dataset and the dataset following removal of non-physical values and of all outliers outside of a range of 3, 5, 7 and 10 pH units. Figures marked in bold indicate significant results (P = 0.05).
AMBER COMP LETE TRUE WITHI N10 WITHI N7 WITHI N5 WITHI N3 PARSE COMP LETE TRUE WITHI N10 WITHI N7 WITHI N5 WITHI N3
ARG * * * * * * * * * * * *
ASP 2.698 1.928 2.513 1.495 1.354 1.273 3.743 1.729 2.251 1.837 1.25 1.106
CYS * * * * * * * * * * * *
GLU 1.885 1.466 1.616 1.62 1.42 1.026 3.175 1.48 1.841 1.681 1.442 1.034 HIS 3.691 2.171 3.016 2.281 2.022 1.417 3.691 2.122 2.997 2.293 1.993 1.465 LYS 1.244 1.263 1.263 1.263 1.122 0.84 25.78 1.162 1.162 1.162 0.991 0.741 TYR 2.739 2.195 2.195 2.195 1.939 1.516 3.163 2.143 2.143 2.143 1.882 1.481
MCCE COMP LETE TRUE WITHI N10 WITHI N7 WITHI N5 WITHI N3 PROPK A COMP LETE TRUE WITHI N10 WITHI N7 WITHI N5 WITHI N3
ARG * * * * * * * * * * * *
ASP 2.024 1.774 2.032 1.79 1.534 1.242 1.301 1.041 1.313 1.301 0.934 0.806
CYS * * * * * * * * * * * *
GLU 1.642 1.255 1.335 1.296 1.259 0.97 1.011 0.851 0.994 0.997 0.849 0.611 HIS 4.503 1.736 2.598 2.104 1.522 1.718 1.865 1.586 1.819 1.631 1.530 1.551 LYS 1.137 1.125 1.125 1.125 1.005 1.129 0.417 0.412 0.412 0.412 2.600 0.423 TYR 5.426 2.643 2.634 2.643 1.668 1.593 2.225 1.551 1.551 1.551 1.001 1.049
Outliers
Page 4 of 12 with PROPKA performing best with an accuracy of
66.67% within the <1 unit band. However a large discrep-ancy exists between the <1 and <0.5 bands for all of the programs, with an approximate 50% drop in accuracy. For the Asp residues, PROPKA predicts far better than the other programs, with values of 37.04%, compared to 18.52% for MCCE and 0% for UHBD at the <0.5 level. However, for Glu residues program performance is closer, with values of 25 % for PARSE, MCCE and UHBD and 33% for AMBER and PROPKA at the <0.5 level. When the error level is extended to <1, PROPKA is far better, with a value of 83.33% compared to its nearest rivals UHBD, AMBER and PARSE with values of 50%. PROPKA shows
an accuracy of 85% to within 1 pKa unit for surface resi-dues, whereas the same accuracy is limited to 53% with the MCCE program for buried residues, a considerable reduction. The accuracy values obtained for MCCE were also comparable with those that recently appeared on the program's website, which show an RMSD of 0.77 and an accuracy range of 98% within the <2 pH unit range and 84% accuracy within the <1 pH unit range [31].
[image:6.612.56.556.120.504.2]Given the capacity of the predictive programs to under or over predict the true pKa value (see Discussion), the possi-bility of using a consensus approach to integrate the vari-ous programs was investigated. Using the Small dataset,
Table 3: Overview of the prediction accuracy of the Small Dataset (242 Residues) I. The table shows the RMSD values for each of the residues from the whole dataset and the dataset following removal of non-physical values and of all outliers outside of a range of 3, 5, 7 and 10 pH units. Figures marked in bold indicate significant results (P = 0.05).
AMBER COMP LETE TRUE WITHI N10 WITHI N7 WITHI N5 WITHI N3 PARSE COMP LETE TRUE WITHI N10 WITHI N7 WITHI N5 WITHI N3
ARG * * * * * * * * * * * *
ASP 2.078 1.787 2.079 2.077 1.691 1.781 3.774 1.582 2.142 1.912 1.53 1.267
CYS * * * * * * * * * *
GLU 1.641 1.416 1.603 1.603 1.294 1.047 3.041 1.474 1.71 1.71 1.334 1.051 HIS 2.786 1.689 1.689 1.689 1.347 1.118 2.736 1.809 1.81 1.81 1.488 1.402 LYS 1.291 1.29 1.291 1.291 1.291 1.291 1.278 1.278 1.278 1.278 1.278 1.278 TYR 2.06 1.297 1.297 1.297 1.933 0.766 2.368 1.262 1.262 1.262 1.871 0.792
MCCE COMP LETE TRUE WITHI N10 WITHI N7 WITHI N5 WITHI N3 UHBD COMP LETE TRUE WITHI N10 WITHI N7 WITHI N5 WITHI N3
ARG * * * * * * * * * * * *
ASP 1.915 1.735 1.921 1.731 1.319 1.419 0.95 0.824 0.838 0.842 0.89 0.641
CYS * * * * * * * * * *
GLU 1.575 1.185 1.237 1.237 1.188 0.893 0.508 0.478 0.493 0.493 0.442 0.395 HIS 1.985 1.584 1.584 1.584 1.056 1.593 0.634 0.453 0.453 0.453 0.494 0.428 LYS 1.152 1.152 1.152 1.152 1.152 1.152 0.412 0.412 0.412 0.412 0.412 0.412 TYR 6.027 1.373 1.373 1.373 1.456 1.419 0.687 0.582 0.582 0.582 0.61 0.631
PROPK A COMP LETE TRUE WITHI N10 WITHI N7 WITHI N5 WITHI N3
ARG * * * * * *
ASP 1.827 1.826 1.806 1.809 0.879 0.745
CYS * * * * *
GLU 0.987 0.773 0.959 0.959 0.781 0.632 HIS 2.235 2.11 2.11 2.11 1.724 2.172 LYS 0.394 0.394 0.394 0.394 0.394 0.394 TYR 1.533 0.992 0.991 0.991 0.572 1.011
Outliers
BMC Biochemistry 2006, 7:18 http://www.biomedcentral.com/1471-2091/7/18
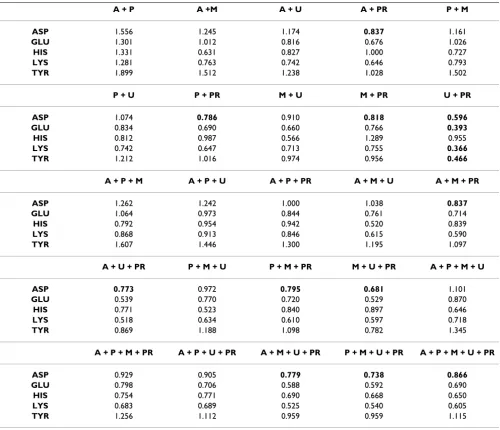
combinations of the prediction values were calculated and the accuracy tested as before. From this dataset, 25 combinations (Table 8) were tried. One, UHBD + PROPKA, leads to improvements in all residues except histidine. The His RMSD value of 0.955, from this combi-nation, is far better than all of the programs except UHBD, which has a value of 0.494. The overall accuracy of this combination was not a surprise due to the individual per-formance of each program. A further attempt to integrate the programs was made by using Partial Least Squared (PLS) regression. The PLS model generated had a correla-tion coefficient (r2) of 0.9 and a cross-validated
correla-tion coefficient (q2) of 0.89. The resulting equations were
applied to the Small dataset and the accuracy results are shown in Table 9. The accuracy improved greatly in the <0.5 range to almost 58%, significantly greater than either the other programs run individually or the combination method (UHBD + PROPKA). Again, a disparity between the predictive capabilities of MEAD and the other pro-grams may be seen. AMBER and PARSE have coefficients of -0.03129 and -0.0001836 respectively, which are com-paratively small compared to the other coefficients (0.239, 0.4282 and 0.4108 for MCCE, UHBD and PROPKA respectively). The results above would indicate a more significant relationship between the PROPKA and UHBD predictions and the experimental pKa values. This data fits with the trends seen in the other analysis.
How-ever, multiple linear regression is not an ideal way to increase predictive accuracy as combining programs will cause the propagation of experimental errors within a given dataset.
The disparity between the predictive capabilities of the program relates to the algorithm that used for the calcula-tion. MEAD, UHBD and MCCE are all based upon an elec-trostatic continuum model that solves the linearised Poisson-Boltzmann equation numerically [32,33]. The electrostatic potential φ(r)can be calculated by the Pois-son-Boltzmann equation:
∇ε (r)∇φ (r) - κ2 (r)ε (r)φ (r) = -4πρ (r) (3)
Whereε is the dielectric constant, r is the position vector,
Φis the electrostatic potential, ρ is the charge distribution and κ is a parameter that represents the effect of mobile ions in solution. All three programs work on the assump-tion that the major determinant of the pKa shift from the
model values are the electrostatic effects of burying titrat-able groups in low dielectric medium. A model of the macromolecule-solvent system is used with dielectric con-stants of 80 for the solvent and 4 for the protein. The details of the atomic structure are incorporated into the placement of charges and dielectric boundaries. The calcu-lation accounts for the desolvation energy, the titratable group's interaction with partial charges and the group's interaction with other titratable groups in the protein. MEAD consistently performs more poorly than the other two Poisson-Boltzmann-based programs. This may be because, in addition to the basic calculation, UHBD and MCCE also incorporate a Monte Carlo function to sample the multiple conformations of each titratable site. The Monte Carlo method achieves convergence by random sampling of side chain conformers. This allows the MCCE and UHBD programs to make a more realistic calculation of the charge-charge interactions than MEAD. The RMSD values of the two MEAD data sets – PARSE and AMBER – are comparable, both producing similar RMSD values and numbers of outliers. However, Table 2 shows that the PARSE force field generates outliers that deviate much fur-ther from the experimentally-determined values than those of AMBER. Although the parameters of the two force fields are similar; the atomic radii of the hydrogens for PARSE are slightly larger which may have created inaccu-rate charge-charge interactions that have increased the cal-culated pKa value (this would also account for the program's propensity to generate outliers). This is espe-cially noticeable for Lys where the respective RMSD values of AMBER and PARSE are 1.2 and 25.8.
Although the PROPKA and MCCE programs are of com-parable accuracy, the data suggests that the former tends to under-predict pKa values whilst the latter over-predicts
[image:7.612.54.297.85.343.2]Correlation plots for the individual programs Figure 1
Correlation plots for the individual programs. The bold line indicates perfect prediction (pKpred = pKexp). The
Page 6 of 12 them (Figure 1). This observation may reflect the different
approaches towards the calculation of the pKa value in the
two programs. PROPKA [17] takes a different approach to the other three programs, calculating the pKa shift by using empirical rules that incorporate effects from hydro-gen bonds, desolvation and Coulombic interactions. The
extent of the pKa shift caused by hydrogen bonding is pro-portional to the number of hydrogen bonds formed by the titratable group [19]. The desolvation effect is calcu-lated from the solvent accessible surface and the 'depth of burial' (the distance of the group from the protein sur-face). Lastly, the strength of the Coulombic charge-charge interactions is dependent on the distance between the charges and on the state of the surrounding ionizable res-idues. This process, however, is only applied to buried pairs of ionizable residues. Therefore PROPKA's tendency to under-predict pKa values may be caused by the pro-gram's emphasis on the dominance of hydrogen bonding in determining the extent of the shift. Hydrogen bonds have the effect of lowering pKa values [34] and the pre-dicted values may reflect that. Conversely, MCCE's ten-dency to over-predict may be the result of charge-charge interaction forcing an increase in the pKa value. The majority of the over-predicted values are surface residues and, unlike PROPKA, the MCCE program does not take into account the lessened effects of charge-charge interac-tions when the respective residues are not buried within the protein interior. Consequently, PROPKA and MCCE tend to be more accurate for surface and buried residues respectively.
Side chains located at active sites are of particular interest as they often have unusually high or low pKa values. In
[image:8.612.54.558.121.406.2]Comparative performance of the prediction methods Figure 2
[image:8.612.59.295.513.656.2]Comparative performance of the prediction meth-ods. The accuracy ranges (0.5 – 2) apply to the deviation from the measured pKa value. The percentage score repre-sents the number of residues predicted in each range.
Table 4: Overview of the prediction accuracy of the Large Dataset (404 Residues) II Three tables show the accuracy of the predictions to the measured pKexp within the ranges of <2 to <0.5. This is taken as the number of residues predicted within each range. Figure
marked in bold indicate significant results (P = 0.05).
TOTAL (404)
AMBER PARSE MCCE PROPKA
% % % %
<2 322 80 320 79 357 88 371 92
<1.5 283 70 282 70 328 81 354 88
<1 213 53 221 55 283 70 317 78
<0.5 108 27 139 34 168 42 195 48
SURFACE (337)
AMBER PARSE MCCE PROPKA
% % % %
<2 285 85 284 84 311 92 329 98
<1.5 255 76 253 75 290 86 317 94
<1 196 58 200 59 248 74 285 85
<0.5 98 29 132 39 151 45 184 55
BURIED (66)
AMBER PARSE MCCE PROPKA
% % % %
<2 37 56 36 55 46 70 42 64
<1.5 28 42 29 44 38 58 37 56
<1 17 26 21 32 35 53 32 48
BMC Biochemistry 2006, 7:18 http://www.biomedcentral.com/1471-2091/7/18
some instances, the electrostatic charge of the active site can be radically different from that the rest of the protein as a means to 'steer' a ligand towards the binding cleft [35]. For a program to work as an effective pKa prediction tool it must be able to predict unusual pKa values accu-rately. Generally speaking, the accuracy of prediction decreased the further the measured pKa value was from the side chain's intrinsic pKa. Again, PROPKA proved to be the
most consistent of the programs. This is not surprising as the design of the model and assignment of parameters were based upon a large dataset of carboxyl pKa values. Overall, the active site data was encouraging at the <1 unit level. However, once reduced to <0.5, the accuracy of all of the programs decreased. This highlights a key area for the development of new models and programs.
An interesting correlation is seen with respect to the regression coefficients and the general performance of the programs. Coefficients are generally an indicator of the relative importance of the contributing terms in a regres-sion equation. The comparative performance of PROPKA, the combination methods and the regression model is seen in Figure 2. PROPKA is equally effective as these additional methods, although the regression data
per-forms better than the best combination. A Molecular Dynamics simulation of one of the proteins from the dataset (Barnase wild type ribonuclease (pdb code: 1A2P)) showed a standard deviation of ± 1.4 for the pKa value over a one-nanosecond period. This indicates that a dynamic structure has a large capacity for extreme pKa shifts. This suggests that any accurate prediction pKa method would need to incorporate conformational varia-bility into the algorithm.
Conclusion
PROPKA is the most accurate method for all residues except Glu and His, where it is narrowly surpassed by UHBD and MCCE, respectively. Furthermore, the pro-gram also produces by far the best values for surface resi-dues, most likely by taking sufficient account of hydrogen bonding. However, MCCE predicts buried residues far better than PROPKA, possibly by a more accurate evalua-tion of the charge-charge interacevalua-tion with the conformers optimised by the Monte Carlo procedure. It must be noted that in all cases, the prediction of the buried residues is less accurate than for surface residues, indicating it is eas-ier to calculate the interaction of a solvated or partially solvated residue than one densely packed within the
pro-Table 5: Overview of the prediction accuracy of the Small Dataset (242 Residues) II. Three tables show the accuracy of the predictions to the measured pKexp. This is taken as the number of residues predicted within each range. Figures marked in bold indicate significant
results (P = 0.05).
TOTAL (242)
AMBER PARSE MCCE UHBD PROPKA
% % % % %
<2 195 81 191 79 216 89 225 93 230 95
<1.5 174 72 171 71 201 83 209 86 220 91
<1 131 54 135 56 172 71 161 67 195 81
<0.5 63 26 87 36 110 45 97 40 125 52
SURFACE (209)
AMBER PARSE MCCE UHBD PROPKA
% % % % %
<2 179 86 176 84 193 92 199 95 205 98
<1.5 163 78 159 76 181 87 186 89 199 95
<1 126 60 125 60 156 75 152 73 181 87
<0.5 60 29 83 40 100 48 94 45 122 58
BURIED (33)
AMBER PARSE MCCE UHBD PROPKA
% % % % %
<2 16 48 15 45 23 70 26 79 25 76
<1.5 11 33 12 36 20 61 23 70 21 64
<1 5 15 10 30 16 48 9 27 14 42
[image:9.612.56.561.119.432.2]Page 8 of 12 tein interior. Overall, the best standalone program is
PROPKA, which also produced the fewest outliers and is computationally much faster than the other programs. What the program lacks is a capacity to fully explore the conformational space available to the protein, which may ultimately limit its capacity to predict pKa value. The reli-ability of the predictive programs tends to vary with both the residue type and its spatial location. For glutamic acid residues, UHBD produced the best results while for Histi-dine and for all buried residues, MCCE performed well. The comparatively poor prediction of the 'unusual' pKa values by all of the programs was disappointing. Their ability to only predict a third of the residues to a high degree of accuracy highlights an area requiring further development. The variation in pKa values observed in our
molecular dynamics simulation strongly suggests a com-plete sampling of conformations accessible to protein structures may be useful in creating accurate predictive software.
Methods
100 proteins for which pKa values had been determined
experimentally were taken from PPD, a database of pro-tein ionization constants [36,37]. The full list of the pdb
[image:10.612.56.552.101.542.2]files comprising the dataset is included as an additional file [See PDB codes]. A wide range of both protein size and function was represented in the dataset. The protein struc-tures were taken from the RCSB protein data bank [38]. In order to run the MEAD program, pdb files were protonated by using the leap program and the AMBER 94 force field
Table 6: Carboxyl sites of interest. B = Buried, S = Surface. Figures marked in bold indicate predictions >2 units from the pKexp.
PDB RESIDUE LOCATIO
N
AMBER PARSE MCCE UHBD PROPKA pKexp
1A2P20 ASP-101 S 6.19 3.56 2.31 3.75 1.20 2.00
ASP-93 S -0.64 -1.38 1.00 3.92 0.69 2.00
ASP-54 S 0.74 0.82 1.34 3.57 2.70 2.00
GLU-73 B 4.66 4.10 2.37 4.68 3.11 2.10
1A9121 ASP-7 S 3.99 20.29 4.17 4.04 3.87 5.60
ASP-44 S 6.00 20.22 5.55 4.69 4.19 5.60 ASP-61 S 5.52 26.20 5.01 4.33 4.01 7.00
GLU-2 S 4.14 7.45 4.53 4.45 4.50 5.50
GLU-37 S 5.15 -20.96 4.27 4.66 4.32 5.50 1BEO22 ASP-21 S 6.38 5.52 3.11 3.75 1.35 2.50
ASP-30 S 3.56 3.80 4.38 4.00 2.64 2.50
ASP-72 S 3.84 3.95 3.69 4.34 3.30 2.60
1DE323 GLU-96 B 9.88 10.41 3.53 5.70 4.10 5.10
GLU-115 S 5.19 5.23 3.81 4.45 4.50 4.90 1KXI24 ASP-59 S 3.13 3.90 2.33 4.20 2.49 2.30
1LZ325 ASP-18 S 3.79 3.94 6.77 4.05 3.19 2.70
ASP-48 S 3.57 3.17 5.15 3.99 2.51 2.50
ASP-66 S 0.23 -0.31 12.38 3.07 1.19 2.00
ASP-87 S 4.06 3.96 4.89 3.89 2.17 2.10
GLU-7 S 3.92 3.44 4.73 4.36 3.01 2.70
GLU-35 B 4.92 5.23 7.80 4.78 5.40 6.10
1RNZ26 ASP-14 B 9.08 7.86 3.51 4.89 -0.62 2.00
GLU-2 B -1.52 -1.48 1.44 5.03 2.66 2.80 1TRS27 ASP-26 B 6.18 4.38 7.84 4.64 4.96 8.10
GLU-6 S 3.91 3.92 4.54 4.44 4.50 4.90
GLU-68 S 4.27 4.24 4.59 4.55 4.57 5.10
1TRW27 ASP-26 B 8.23 5.24 8.63 4.83 5.62 9.90
GLU-68 S 5.07 5.33 3.55 4.88 4.34 4.90
1XNB28 ASP-11 S 1.83 0.57 3.44 3.82 1.99 2.50
ASP-83 B 6.29 7.89 6.35 4.28 1.36 2.00
ASP-101 B 5.01 2.94 9.96 4.28 1.50 2.00 ASP-106 S 8.72 8.94 3.18 4.98 3.02 2.70 GLU-172 B 6.62 6.42 5.94 5.22 7.32 6.70 2OVO29 ASP-7 S 4.05 4.01 6.25 3.72 2.51 2.50
ASP-27 S 2.08 2.32 2.77 3.77 2.39 2.50
2RN230 ASP-10 B 4.01 3.38 8.47 3.83 6.99 6.10
ASP-70 B 4.11 3.55 3.15 3.50 4.10 2.60
BMC Biochemistry 2006, 7:18 http://www.biomedcentral.com/1471-2091/7/18
(subsequent versions of the force field proved to be incompatible) and changed into pqr format using the online PDB2PQR converter [39,40]. Separate sets of files were created based on the AMBER99 and PARSE force fields. MEAD and UHBD were run on an IBM Blade Center Cluster, which consists of 5 Blade Centers contain-ing 67 Dual Xeon (3.06Ghz, 1Gb) Blades. The MCCE cal-culations were carried out on an SG Octane. The majority of the pdb files did not need any modification. However, 1D3K, 1GU8, 1HRH and 1DRH were protonated with the
leap program and the AMBER 03 force field in order to remove inconsistencies in the pdb files. Additionally, 1DUK, 1NFN and 2CI2 underwent minimization with
sander using a steepest descent method that continued for 20,000 1 fs time steps or until the root mean square devi-ation between successive time-steps had fallen below 0.01Å in order to eliminate steric clashes. The PROPKA program was run online from its server [41]; no modifica-tion was required to run the files. Values for all Asp, Glu, His, Tyr, Lys residues were predicted. Arg was excluded from the calculation due to lack of experimental data. Arginines's high pKa precludes establishing a titratable
curve as the protein denatures at high pH. Cys was also excluded from the calculations due to a lack of experimen-tal data.
The resultant data was also analysed using the Partial Least Squares (PLS) method. PLS is an extension of Multiple Linear Regression (MLR) that where a set of coefficients are developed from dependent variables, in this case the pKa prediction values, by comparison with the independ-ent variables, the experimindepend-ental pKa values. The PLS analy-sis was performed using the program GOLPE (Generating Optimal Linear PLS Estimations)[42].
Authors' contributions
[image:11.612.54.564.106.425.2]MND formatted the data carried out the calculations for all of the pKa programs mentioned. CPT assembled the data set and carried out statistical analysis on the output of the pKa programs. DSM supervised the pKa calculations using the MEAD and UHBD programs at Birkbeck Col-lege. DRF instigated and supervised the entire project. MND, CPT and DRF drafted the manuscript. All authors have read and accepted the manuscript.
Table 7: Accuracy of prediction for the carboxyl sites. The accuracy was tested to the <2 to <0.5 ranges. The individual accuracy of the residues is given in the bottom two tables. Figures marked in bold indicate the greatest accuracy.
TOTAL (242)
AMBER PARSE MCCE UHBD PROPKA
% % % % %
<2 26 66.67 20 51.28 30 76.92 30 76.92 34 87.18 <1.5 19 48.72 15 38.46 25 64.10 20 51.28 32 82.05 <1 10 25.64 10 25.64 17 43.59 8 20.51 26 66.67 <0.5 6 15.38 4 10.26 8 20.51 3 7.69 14 35.90
SURFAC E (209)
AMBER PARSE MCCE UHBD PROPKA
% % % % %
<2 17 62.96 13 48.15 10 70.37 19 70.37 22 81.48 <1.5 10 37.04 8 29.63 16 59.26 11 40.74 20 74.07 <1 4 14.81 4 14.81 12 44.44 2 7.41 16 59.26 <0.5 2 7.41 1 3.70 5 18.52 0 0.00 10 37.04
BURIED (33)
AMBER PARSE MCCE UHBD PROPKA
% % % % %
Page 10 of 12
Table 9: Accuracy of the multiple regression. The accuracy is given as the number of predictions within a range of the pKexp. For comparison the UHBD + PROPKA combination is added. Figures marked in bold indicate improvements.
TOTAL (242)
REGRESSION UHBD + PROPKA
% %
<2 234 96.69 233 96
<1.5 228 94.21 226 93
<1 205 84.71 197 81
[image:12.612.53.553.609.699.2]<0.5 140 57.85 124 51
Table 8: Overview of the combination methods (242 Residues). The residue RMSD values are given for all of the 25 combinations consisting of AMBER (A), PARSE (P), MCCE (M), UHBD (U) and PROPKA (P). Figures marked in bold indicate an improvement while the asterisk indicates the best score.
A + P A +M A + U A + PR P + M
ASP 1.556 1.245 1.174 0.837 1.161
GLU 1.301 1.012 0.816 0.676 1.026
HIS 1.331 0.631 0.827 1.000 0.727
LYS 1.281 0.763 0.742 0.646 0.793
TYR 1.899 1.512 1.238 1.028 1.502
P + U P + PR M + U M + PR U + PR
ASP 1.074 0.786 0.910 0.818 0.596
GLU 0.834 0.690 0.660 0.766 0.393
HIS 0.812 0.987 0.566 1.289 0.955
LYS 0.742 0.647 0.713 0.755 0.366
TYR 1.212 1.016 0.974 0.956 0.466
A + P + M A + P + U A + P + PR A + M + U A + M + PR
ASP 1.262 1.242 1.000 1.038 0.837
GLU 1.064 0.973 0.844 0.761 0.714
HIS 0.792 0.954 0.942 0.520 0.839
LYS 0.868 0.913 0.846 0.615 0.590
TYR 1.607 1.446 1.300 1.195 1.097
A + U + PR P + M + U P + M + PR M + U + PR A + P + M + U
ASP 0.773 0.972 0.795 0.681 1.101
GLU 0.539 0.770 0.720 0.529 0.870
HIS 0.771 0.523 0.840 0.897 0.646
LYS 0.518 0.634 0.610 0.597 0.718
TYR 0.869 1.188 1.098 0.782 1.345
A + P + M + PR A + P + U + PR A + M + U + PR P + M + U + PR A + P + M + U + PR
ASP 0.929 0.905 0.779 0.738 0.866
GLU 0.798 0.706 0.588 0.592 0.690
HIS 0.754 0.771 0.690 0.668 0.650
LYS 0.683 0.689 0.525 0.540 0.605
BMC Biochemistry 2006, 7:18 http://www.biomedcentral.com/1471-2091/7/18
Additional material
Acknowledgements
We should like to thank Dr Channa Hattotuwagama, Dr David Houlder-shaw and Dr Andy Purkiss for their helpful advice and assistance. The Edward Jenner Institute for Vaccine Research wishes to thank its sponsors: GlaxoSmithKline, the Medical Research Council, the Biotechnology and Biological Sciences Research Council, and the UK Department of Health.
References
1. Raquet X, Lounnas V, Lamotte-Brasseur J, Frere JM, Wade RC: pKa calculations for class A beta-lactamases: methodological and mechanistic implications. Biophys J 1997, 73:2416-26.
2. Lamotte-Brasseur J, Lounnas V, Raquet X, Wade RC: pKa calcula-tions for class A beta-lactamases: influence of substrate bind-ing. Protein Sci 1999, 8:404-9.
3. Lamotte-Brasseur J, Dubus A, Wade RC: pKa calculations for class
C beta-lactamases: the role of Tyr-150. Proteins 2000, 40:23-8. 4. Nielsen JE, McCammon JA: Calculating pKa values in enzyme
active sites. Protein Sci 2003, 12:1894-901.
5. Warshel A: Calculations of enzymatic reactions: Calculations of pKa proton transfer reactions, and general acid catalysis
reactions in enzymes. Biochemistry 1981, 20:3167-3177. 6. Mehler EL, Guarnieri F: A self-consistent, microenvironment
modulated screened coulomb potential approximation to calculate pH-dependent electrostatic effects in proteins. Bio-phys J 1999, 77:3-22.
7. Edgcomb SP, Murphy KP: Variability in the pKa of His side-chains
correlates with burial within proteins. Proteins 2002, 49:1-6. 8. Harris TK, Turner GJ: Structural basis of perturbed pKa values
of catalytic groups in enzyme active sites. IUBMB Life 2002,
53:85-98.
9. Li H, Robertson AD, Jensen JH: The determinants of carboxyl pKa values in turkey ovomucoid third domain. Proteins 2004,
55:689-704.
10. Demchuk E, Wade RC: Improving the continuum dielectric approach to calculating pKas of ionizable groups in proteins.
J Phys Chem 1996, 100:17373-17387.
11. Nielsen JE, Vriend G: Optimizing the hydrogen-bond network in Poisson-Boltzmann equation-based pKa calculations.
Pro-teins 2001, 43:403-412.
12. Georgescu RE, Alexov EG, Gunner MR: Combining conforma-tional flexibility and continuum electrostatics for calculating pKas in proteins. Biophys J 2002, 83:1731-1748.
13. Wisz MS, Hellinga HW: An empirical model for electrostatic interactions in proteins incorporating multiple geometry-dependent dielectric constants. Proteins 2003, 51:360-377. 14. Alexov EG, Gunner MR: Incorporating protein conformational
flexibility into the calculation of pH-dependent protein prop-erties. Biophys J 1997, 72:2075-2093.
15. Alexov EG, Gunner MR: Calculated protein and proton motions coupled to electron transfer: electron transfer from QA- to QB in bacterial photosynthetic reaction centers. Biochemistry
1999, 38:8253-8270.
16. Bashford D: An object-oriented programming suite for elec-trostatic effects in biological molecules. Scientific Computing in Object-Oriented Parallel Environments 1997, 1343:233-240.
17. Li H, Robertson AD, Jensen JH: Very Fast Empirical Prediction and Rationalization of Protein pKa values. Proteins 2005,
55:689-704.
18. Madura JD, Briggs JM, Wade RC, Davis ME, Luty BA, Ilin A, Antosie-wicz J, Gilson MK, Bagheri B, Scott LR, McCammon JA: Electrostat-ics and Diffusion of Molecules in Solution: Simulations with the University of Houston Brownian Dynamics Program. Comp Phys Comm 1995, 91:57-95.
19. Forsyth WR, Antosiewicz JM, Robertson AD: Empirical relation-ships between protein structure and carboxyl pKa values in
proteins. Proteins 2002, 48:388-403.
20. Oliveberg M, Arcus VL, Fersht AR: pKa values of carboxyl groups in the native and denatured states of barnase: the pKa values of the denatured state are on average 0.4 units lower than those of model compounds. Biochemistry 1995, 134:9424-9433. 21. Assadi-Porter FM, Fillingame RH: Proton-translocating carboxyl
of subunit c of F1Fo H(+)-ATP synthase: the unique environ-ment suggested by the pKa determined by 1H NMR.
Biochem-istry 1995, 34:16186-16193.
22. Gooley PR, Keniry MA, Dimitrov RA, Marsh DE, Keizer DW, Gayler KR, Grant BR: The NMR solution structure and characteriza-tion of pH dependent chemical shifts of the beta-elicitin, cryptogein. J Biomol NMR 1998, 12:523-534.
23. Perez-Canadillas JM, Campos-Olivas R, Lacadena J, Martinez del Pozo A, Gavilanes JG, Santoro J, Rico M, Bruix M: Characterization of pKa values and titration shifts in the cytotoxic ribonuclease
alpha-sarcin by NMR. Relationship between electrostatic interactions, structure, and catalytic function. Biochemistry
1998, 37:15865-15876.
24. Chiang CM, Chang SL, Lin HJ, Wu WG: The role of acidic amino acid residues in the structural stability of snake cardiotoxins. Biochemistry 1996, 35:9177-9186.
25. Bartik K, Redfield C, Dobson CM: Measurement of the individual pKa values of acidic residues of hen and turkey lysozymes by two-dimensional 1H NMR. Biophys J 1994, 66:1180-1184. 26. Cohen JS, Griffin JH, Schechter AN: Nuclear magnetic resonance
titration curves of histidine ring protons. IV. The effects of phosphate and sulfate on ribonuclease. J Biol Chem 1973,
248:4305-4310.
27. Qin J, Clore GM, Gronenborn AM: Ionization equilibria for side-chain carboxyl groups in oxidized and reduced human thioredoxin and in the complex with its target peptide from the transcription factor NF kappa B. Biochemistry 1996, 35:7-13. 28. Joshi MD, Hedberg A, McIntosh LP: Complete measurement of the pKa values of the carboxyl and imidazole groups in Bacil-lus circulans xylanase. Protein Sci 1997, 6:2667-2670.
29. Schaller W, Robertson AD: pH, ionic strength, and temperature dependences of ionization equilibria for the carboxyl groups in turkey ovomucoid third domain. Biochemistry 1995,
34:4714-4723.
30. Oda Y, Yamazaki T, Nagayama K, Kanaya S, Kuroda Y, Nakamura H:
Individual ionization constants of all the carboxyl groups in ribonuclease HI from Escherichia coli determined by NMR. Biochemistry 1994, 33:5275-84.
31. [http://www.sci.ccny.cuny.edu/~mcce/].
32. Nicholls A, Honig B: A rapid finite difference algorithm, utiliz-ing successive over-relaxation to solve the Poisson-Boltz-mann equation. J Comput Chem 1991, 12:435-445.
33. Rocchia W, Alexov E, Honig B: Extending the applicability of the nonlinear Poisson-Boltzmann equation: Multiple dielectric constants and multivalent ions. J Phys Chem 2001,
105:6507-6514.
34. Rocchia W, Sridharan S, Nicholls A, Alexov E, Chiabrera A, Honig B:
Rapid Grid-based Construction of the Molecular Surface for both Molecules and Geometric Objects: Applications to the Finite Difference Poisson-Boltzmann Method. J Comp Chem
2002, 23:128-137.
35. Bashford D, Gerwert K: Electrostatic calculations of the pKa values of ionizable groups in Bacteriorhodopsin. J Mol Biol
1992, 224:473-486.
36. Toseland CP, McSparron H, Flower DR: PPD v1.0 – An inte-grated, web-accessible database of protein ionization con-stants. Nucleic Acids Res 2006, 34:199-203.
37. [http://www.jenner.ac.uk/PPD]. 38. [http://www.rcsb.org/pdb].
39. Dolinsky TJ, Nielsen JE, McCammon JA, Baker NA: PDB2PQR: an automated pipeline for the setup of Poisson-Boltzmann elec-trostatics calculations. Nucleic Acids Res 2004, 32:665-667. 40. [http://agave.wustl.edu/pdb2pqr/].
Additional File 1
PDB codes, a full list of the pdb codes for the three-dimensional structures comprising the dataset.
Click here for file
Publish with BioMed Central and every scientist can read your work free of charge "BioMed Central will be the most significant development for disseminating the results of biomedical researc h in our lifetime."
Sir Paul Nurse, Cancer Research UK
Your research papers will be:
available free of charge to the entire biomedical community
peer reviewed and published immediately upon acceptance
cited in PubMed and archived on PubMed Central
yours — you keep the copyright
Submit your manuscript here:
http://www.biomedcentral.com/info/publishing_adv.asp
BioMedcentral
Page 12 of 12
41. [http://ghemical.chem.uiowa.edu/].