BIROn - Birkbeck Institutional Research Online
Gilligan, K.A. and Hodgkiss, A. and Thomas, Michael S.C. and Farran,
E.K. (2018) The developmental relations between spatial cognition and
mathematics in primary school children.
Developmental Science 22 (4),
e12786. ISSN 1363-755x.
Downloaded from:
Usage Guidelines:
Please refer to usage guidelines at or alternatively
1
The developmental relations between spatial cognition and
mathematics in primary school children
Running Title:
The relationship between spatial cognition and mathematics
Authors:
Katie A. Gilligan abc*, Alex Hodgkiss dbc, Michael S. C. Thomas ec & Emily K. Farran abc
a School of Psychology, University of Surrey, Guilford, Surrey, GU27XH, UK
b Department of Psychology and Human Development, UCL Institute of Education,
University College London, 25, Woburn Square, London WC1H 0AA, UK
c Centre for Educational Neuroscience, University of London, UK
d Department of Education, University of Oxford, Oxford, OX2 6PY, UK
e Department of Psychological Sciences, Birkbeck, University of London, Malet Street,
London WC1E 7HX, UK
*Corresponding author: [email protected]; +44 (0)1483 684888
Acknowledgements:
Funding for this research was provided by The Bloomsbury Colleges Ph.D. Scholarship
Programme and the Economic and Social Research Council (ESRC), and was supported by
the National Centre for Curriculum and Assessment (NCCA) Ireland.
Conflict of Interest Statement:
2
The developmental relations between spatial cognition and
mathematics in primary school children
Research Highlights
Spatial skills explained 5-14% of the variation across three mathematics performance
measures (standardised mathematics skills, approximate number sense and number
line estimation skills).
Spatial scaling (extrinsic-static thinking) was a significant predictor of all
mathematics outcomes at all ages between 6-10 years.
Different spatial sub-domains were differentially associated with mathematics in a
task and age dependent manner.
Spatial training is proposed as a means of improving both spatial and mathematical
thinking.
Abstract
Spatial thinking is an important predictor of mathematics. However, existing data do not
determine whether all spatial sub-domains are equally important for mathematics outcomes
nor whether mathematics-spatial associations vary through development. This study
addresses these questions by exploring the developmental relations between mathematics and
spatial skills in children aged 6 -10 years (N = 155). We extend previous findings by
assessing and comparing performance across Uttal et al.'s (2013), four spatial sub-domains.
Overall spatial skills explained 5-14% of the variation across three mathematics performance
measures (standardised mathematics skills, approximate number sense and number line
3 gender. Spatial scaling (extrinsic-static sub-domain) was a significant predictor of all
mathematics outcomes, across all ages, highlighting its importance for mathematics in middle
childhood. Other spatial sub-domains were differentially associated with mathematics in a
task and age dependent manner. Mental rotation (intrinsic-dynamic skills) was a significant
predictor of mathematics at 6 and 7 years only which suggests that at approximately 8 years
of age there is a transition period regarding the spatial skills that are important for
mathematics. Taken together, the results support the investigation of spatial training,
particularly targeting spatial scaling, as a means of improving both spatial and mathematical
thinking.
Key Words
Mathematics, Spatial Cognition, Development
Introduction
Spatial thinking has previously been identified as a significant predictor of Science,
Technology, Engineering and Mathematics (STEM) success in adults (Shea, Lubinski, &
Benbow, 2001; Wai, Lubinski, & Benbow, 2009). More recently, behavioural links between
spatial and mathematical skills have also been reported in pre-school and primary school
children (e.g., Gilligan, Flouri, & Farran, 2017; Verdine et al., 2014). Despite reported
associations between spatial and mathematical skills at both behavioural and neural levels
(Cutini, Scarpa, Scatturin, Dell’Acqua, & Zorzi, 2014; Hubbard, Piazza, Pinel, & Dehaene,
2005; Winter, Matlock, Shaki, & Fischer, 2015) not all studies that have attempted transfer of
spatial training gains to mathematics are successful (Cheng & Mix, 2014; (Hawes, Moss,
Caswell, Naqvi, & MacKinnon, 2017; Hawes, Moss, Caswell, & Poliszczuk, 2015; Lowrie,
4 thinking are often treated as unitary constructs. However, it is unlikely that all spatial and
mathematical sub-domains are associated to the same degree. A precursor to effective
training must involve more, fine grained evaluation of spatial skills and their relations to
particular aspects of mathematics. This would enable effective selection of training targets,
increasing the likelihood of developing successful training interventions.
Defining spatial thinking
As described by Newcombe (2018) “any kind of action in a spatial world is in some sense
spatial functioning, and hence can sensibly be called spatial cognition”. Given the wide scope
of spatial cognition, it is unsurprising that spatial research has been complicated by variations
in both the terminology and typology used in the domain. For example, attempts at defining a
typology for spatial thinking have been approached from an array of perspectives including
psychometric, cognitive and theoretical approaches (Linn & Petersen, 1985). In this study,
spatial thinking is explored in the context of Uttal et al.'s (2013) theoretical classification of
spatial skills (also see Newcombe & Shipley, 2015). The selection of this model was based
on the extensive neurological, behavioral and linguistic evidence supporting it (Chatterjee,
2008; Hegarty, Montello, Richardson, Ishikawa, & Lovelace, 2006; Palmer, 1978; Talmy,
2000).
Using two fundamental distinctions between intrinsic and extrinsic, and static and dynamic
representations respectively, Uttal et al. (2013) propose a two by two classification of spatial
thinking. Intrinsic representations relate to the structure and size of individual objects, their
parts and the relationship between these parts. Conversely, extrinsic representations are those
pertaining to object locations, the relationship between different objects, and the position of
5 representations require transformations or manipulations such as scaling, rotating, folding or
bending. For static spatial representations, no movement or transformation is required. In
combination, Uttal et al.'s (2013) two by two classification renders four spatial sub-domains
including intrinsic-static, intrinsic-dynamic, extrinsic-static and extrinsic-dynamic
sub-domains (see Fig. 1). In the current study, developmental and individual differences in spatial
thinking are measured across each of Uttal et al.'s (2013) spatial categories using a
carefully-selected task to target each individual sub-domain.
Defining mathematical thinking
Like spatial thinking, mathematics is not a unitary construct but requires a multitude of skills
and competencies. This study uses von Aster and Shalev's (2007) model of numerical
cognition which posits that individuals are equipped with an innate, core system for
representing number, the approximate number system (ANS). The ANS stores approximate
representations of numerical magnitude in the brain without symbols (Feigenson, Dehaene, &
Spelke, 2004; Cordes, Gelman, Gallistel, & Whalen, 2001). These representations are
proposed to be stored on a Mental Number Line (Dehaene, Bossini, & Giraux, 1993; de
Hevia, Vallar, & Girelli, 2006; Le Corre & Carey, 2007). Evidence for an ANS includes
findings that very young infants are capable of discriminating, representing, and
remembering particular small numbers of items (von Aster & Shalev, 2007).
Von Aster & Shalev's (2007) model states that the ANS provides a foundation from which
the symbolic number system develops. The symbolic number system is the way in which
symbolic numerals are represented in the brain (Carey, 2004; Dehaene, 2011; Le Corre &
Carey, 2007; Mussolin, Nys, Content, & Leybaert, 2014) and symbolic number skills are
6 Nugent, & Numtee, 2007; LeFevre et al., 2010; Siegler & Opfer, 2003). The exact process,
by which the ANS might give rise to the symbolic number system, is unknown. The ANS
Mapping Account, suggests that the ANS is the foundation onto which symbolic
representations such as number symbols and number words are mapped (Ansari, 2008;
Halberda & Feigenson, 2008; Feigenson et al., 2004; Mundy & Gilmore, 2009; Siegler &
Booth, 2004; von Aster & Shalev, 2007). Alternatively, the Dual Representation View
proposes that learning number words and symbols leads to new “exact” numerical
representations with exact ordinal content, that are fundamentally distinct from the ANS
(Carey, 2004; 2009; Lyons, Ansari, & Beilock, 2012; Piazza et al., 2010; Piazza, Pica, Izard,
Spelke, & Dehaene, 2013; Rips, Bloomfield, & Asmuth, 2008).
Regardless of their origins, the ANS and the symbolic number systems are proposed to act in
combination as a platform for the development of more complex mathematical skills such as
multi-digit calculation, word problem solving, algebra, measurement and data handling skills
(Barth, La Mont, Lipton, & Spelke, 2005; Butterworth, 1999; Feigenson et al., 2004; Piazza,
2010; Träff, 2013). In support of this, many studies have reported that both the ANS and
symbolic number skills, are strong concurrent and longitudinal predictors of general
mathematics performance (for examples see: Aunola, Leskinen, Lerkkanen, & Nurmi, 2004;
Clarke & Shinn, 2004; Halberda, Mazzocco, & Feigenson, 2008; Hannula, Lepola, &
Lehtinen, 2010; Mazzocco, Feigenson, & Halberda, 2011). Based on this theory, this study
includes a measure of both ANS and symbolic skills, in addition to a standardised
mathematics measures that picks up on more complex mathematical skills including
7
The role of spatial thinking for mathematics
Links between spatial skills (particularly intrinsic-dynamic skills) and mathematical thinking
have been proposed in children as young as three years. For example, Verdine et al. (2014)
reported that intrinsic-dynamic spatial skills at age 3 years (as measured using the Test of
Spatial Assembly [TOSA]) uniquely predicted 27% of the variation in mathematical problem
solving (measured using the Weshler Individual Achievement Test [WIAT]) at age 4 years.
Similarly, in slightly older children aged 5 years, intrinsic-dynamic spatial skills, measured
using the Pattern Construction subtest of the British Ability Scales III, were a significant
predictor of standardised mathematics performance at age 7, explaining 8.8% of the variation
(Gilligan et al., 2017). Similar findings have been reported in cross-sectional childhood
studies of children from 6 to 8 years, where mental rotation (an intrinsic-dynamic skill) is
significantly associated with performance on both verbal (.50 < r < .63) and non-verbal
calculation tasks (.40 < r < .45) (Hawes et al., 2015).
The previous studies discussed above show a bias towards the use of intrinsic-dynamic
spatial tasks to explore associations between mathematics and spatial skills in primary school
children. From a historical perspective, this is unsurprising given that intrinsic-dynamic
spatial skills have repeatedly been associated with STEM outcomes in adult populations (for
examples see: Shea et al., 2001; Wai et al., 2009). Insights of the role of the other spatial
sub-domains can be gained from studies of older children. For example, there is evidence from
children aged 10 and 11 years, that intrinsic-static spatial skills (measured using
disembedding and matrix reasoning tasks respectively) are significantly correlated with
mathematics outcomes (.37 < r < .42 ) (Markey, 2010; Tosto et al., 2014). Similarly, both
intrinsic-static skills (age 3 years) and performance on composite spatial measures (requiring
8 predictors of mathematics at approximately 10 years ( .31 < r < .49) (Carr et al., 2017; Casey
et al., 2015; Zhang et al., 2014). These findings suggest that associations between spatial
thinking and mathematics in the primary school years may not be limited to the
intrinsic-dynamic spatial domain. However, there is a need to elucidate whether associations are
consistent across all spatial and mathematical sub-domains. Refining the findings in this field
would facilitate a better understanding of not just if, but why significant correlations are often
reported between mathematics and spatial constructs.
Recent findings from Mix et al. (2016; 2017) provide a first-step to this understanding, by
investigating performance on an extensive range of spatial and mathematics sub-domains at
6, 9 and 11 years. In both initial (2016) exploratory factor analysis (EFA) and follow up
confirmatory factor analysis (CFA) (2017) studies, Mix et al. found that although spatial and
mathematics tasks are highly correlated, they form distinct factors. Furthermore, by
comparing children of differing ages on the same spatial and mathematics tasks, Mix and et
al. (2016; 2017) provide important evidence that there are distinct relations between
individual spatial sub-domains and mathematics performance, and that these relations vary
with age. Intrinsic-dynamic spatial skills were a significant predictor of mathematics (a
general mathematics factor derived from performance on a range of mathematics measures)
at 6 years only, while Visuo-Spatial Working Memory (VSWM), measured using a spatial
location memory task, was significant at 11 years only. Of note, some cross-factor loadings
reported in the initial EFA were not replicated in the CFA and so these results should be
9
Explaining mathematics-spatial associations
The findings outlined above do not support a simple linear coupling between spatial and
mathematical cognition. Instead it has been proposed that several different explanations
underpin spatial-mathematical associations, depending on the mathematical and spatial
sub-domains assessed (Fias & Bonato, 2018). Historically the Mental Number Line, or the idea
that numbers are represented spatially in the brain, was proposed to explain observed
associations between spatial and mathematical constructs (Barsalou, 2008; Lakoff & Núñez,
2000). The Spatial- Numerical Association of Response Codes (SNARC) effect, thought to
reflect the presence of the Mental Number Line, has been demonstrated in a number of
studies where individuals are faster to respond to small numbers with their left hand and
larger numbers with their right hand, suggesting that small numbers are spatially represented
to the left and larger numbers are represented to the right in the brain (Dehaene et al., 1993).
However, accepting the Mental Number Line as the driver of all spatial-mathematics
relations is inconsistent with the differential associations observed between certain spatial
and mathematical sub-domains, as shown by Mix et al., (2016; 2017). Instead, it is now
considered that all associations between spatial and mathematical tasks cannot be explained
in the same way, and a range of explanations have recently been proposed as theoretical
accounts for specific mathematics-spatial relations, explained in detail below.
First, it has been proposed that extrinsic-static spatial tasks, particularly spatial scaling tasks,
rely on proportional reasoning(Newcombe, Möhring, & Frick, 2018). This is explained with
reference to two different quantification systems, an extensive system (using absolute
amounts) or an intensive system (using proportions or ratios). Accurate spatial scaling
between two different sized spaces requires the intensive coding strategy, with proportional
10 performance is correlated with proportional reasoning performance (identification of the
strength of flavour of different combinations of cherry juice and water) in children aged 4 to
5 years (Möhring, Newcombe, & Frick, 2015). In mathematics, similar proportional mapping
between discrete (extensive) representations of number to continuous (intensive)
representations is required for number line estimation and reasoning about formal fractions
(Möhring, Newcombe, Levine, & Frick, 2016; Rouder & Geary, 2014). Theoretically, ANS
tasks may require proportional reasoning to facilitate ordinal comparisons between dot arrays
(Szkudlarek & Brannon, 2017), while performance on some geometry, area and distance
tasks also rely on proportional and not absolute judgements (Barth & Paladino, 2011;
Dehaene, Piazza, Pinel, & Cohen, 2003; Slusser, Santiago, & Barth, 2013). Taken together, it
is expected that extrinsic-static spatial task performance will correlate with mathematics tasks
that rely on intensive quantity processing or proportional reasoning.
Second, for intrinsic-dynamic (e.g., mental rotation) and extrinsic-dynamic spatial tasks (e.g.,
perspective taking), active processing, including mental visualisation and manipulation of
objects in space, is thought to be required for successful task completion(Lourenco, Cheung,
& Aulet, 2018; Mix et al., 2016). It is postulated that the generation of mental models allows
individuals to visualise not only individual components of problems but also the relations
between parts of problems (Lourenco et al., 2018). Theoretically, in mathematics, individuals
may use mental visualisations to represent and solve complex mathematical word problems
(e.g., by visualising problems in concrete terms, which would allow grouping of visualised
constructs and structuring order of operations tasks), or to represent and organise complex
mathematical relationships such as multi-digit numbers (Huttenlocher, Jordan, & Levine,
1994; Laski et al., 2013; Thompson, Nuerk, Moeller, & Cohen Kadosh, 2013). Mental
11 problems of the format 4 + __ = 5, individuals may use visualisations of blocks or other
concrete objects to balance the equation presented (Lourenco et al., 2018). Dynamic spatial
tasks are thus expected to correlate with mathematical tasks requiring the mental
manipulation or organisation of numbers.
Third, intrinsic-static spatial tasks (e.g., embedded figures)are reliant on form perception, the
ability to distinguish shapes from a more complex background or to break pictures that are
more complex into parts (Mix et al., 2016). Form perception is theoretically useful for spatial
tasks such as map reading and figure drawing (Newcombe & Shipley, 2015). It may also
play a role in mathematics tasks such as distinguishing symbols such as + and × symbols,
interpreting charts and graphs, and accurately completing multistep calculations which
require an understanding of the spatial relations between symbols (Landy & Goldstone, 2007;
2010; Mix and et al., 2016). As such intrinsic-static skills are predicted to relate to
mathematics tasks that require identification and use of symbols or visual aids.
Current Study
This is the first study to explore associations between different aspects of spatial and
mathematical thinking across 5 consecutive age groups in the primary school years (age 6, 7,
8, 9 and 10 years). Based on the theoretical explanations for specific spatial-mathematics
relations outlined above (proportional reasoning, mental visualisation and form perception),
the apriori prediction for this study is that certain spatial sub-domains will be differentially
associated with mathematics outcomes, across all age groups. It is also hypothesised that
some spatial-mathematics associations are age-dependent. Previous studies suggest a
12 proposed to occur in middle childhood (Mix et al., 2016; 2017). The inclusion of consecutive
age groups in this study provides strong acuity of this developmental change.
Materials and Methods
Participants
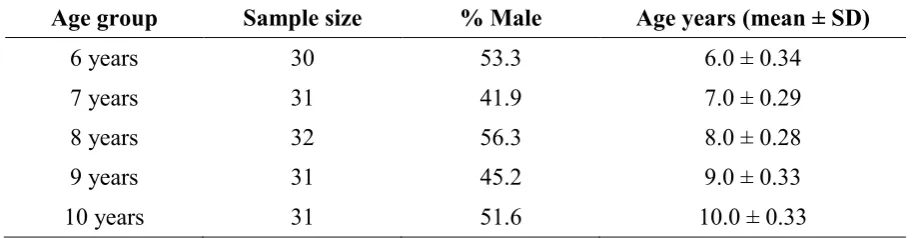
This study included 155 children across five age groups. Participants were drawn from a
culturally diverse, London-based school with a 19% eligibility for free school meals (slightly
above the national average of 11%, (Department of Education, 2017). The age and gender of
participants in the study are shown in Table 1.
Spatial Measures
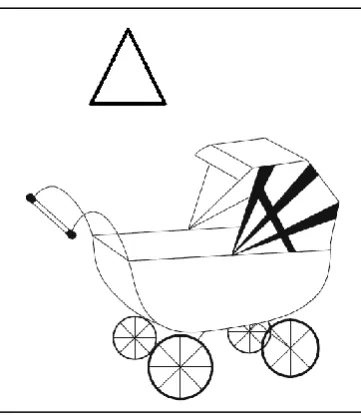
Intrinsic-static- Children’s Embedded Figures Task
The Children’s Embedded Figures Task (CEFT) is a measure of intrinsic-static spatial ability
and measures the ability to dis-embed information from a larger context (Witkin, Otman,
Raskin, & Karp, 1971). The task was delivered as per the administration guidelines (Witkin
et al., 1971). Participants were required to locate a target shape embedded within a more
complex, meaningful picture. The task was presented as two blocks in a fixed order. Within
each block, participants were introduced to a reference target shape (house and tent shape for
Blocks A and B respectively). For each block, participants first completed 4 discrimination
trials during which they were required to identify the target shape from a selection of other
similar shapes. Discrimination trials were repeated until participants correctly answered two
items in succession. Following this, participants completed two practice trials (Block A) or a
13 series of more complex pictures and to outline the target shape with their finger (Fig. 2).
Performance feedback was given for practice trials. Participants repeated each practice trial
until successfully locating the target shape. Practice trials were followed by 11 and 14
experimental trials, for Block A and Block B respectively. As for practice trials, participants
were required to locate the target shape within more complex pictures. No feedback was
given for experimental trials. Only participants failing all trials in Block A, did not progress
to Block B. The task finished when participants failed five consecutive trials within Block B.
Performance was measured as percentage of correct trials.
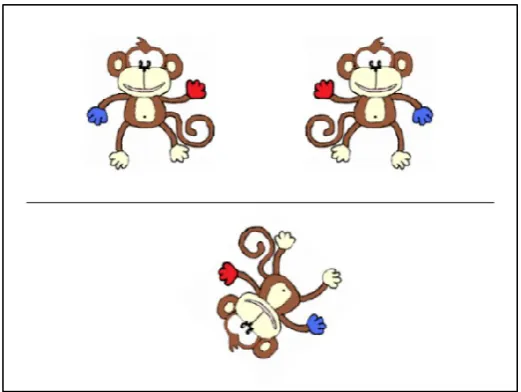
Intrinsic-dynamic- Mental Rotation Task
The Mental Rotation Task was included as a measure of intrinsic-dynamic spatial ability. The
protocol and stimuli were modified from Broadbent, Farran, and Tolmie (2014). In each trial
participants were asked to identify which of two monkey images located above a horizontal
line, matched the target monkey image below the line. As shown in Fig. 3, the images above
the line included a mirror image of the target image, and a version of the target image rotated
by a fixed degree from the target image. Participants completed four practice trials at 0°
followed by 36 experimental trials. Only participants achieving at least 50% in the practice
trials were deemed to understand the task instructions and continued to the experimental
trials. Experimental trials were randomly presented and included equal numbers of clockwise
and anti-clockwise rotations at 45°, 90° and 135° (eight trials for each degree of rotation), 8
trials at 180° and 4 trials at 0°. Participants used labelled keys on the left and right of the
14
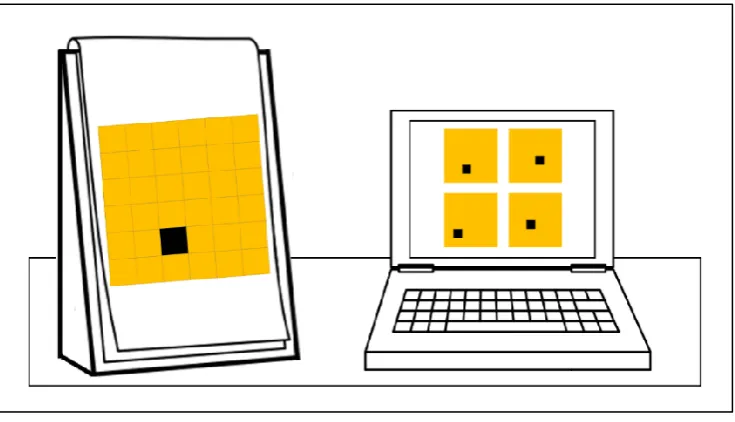
Extrinsic-static- Scaling Task
A spatial scaling discrimination task was included as an extrinsic-static task, for use in this
study (Gilligan, Hodgkiss, Thomas, & Farran, 2018). As shown in Fig. 4, participants were
required to use a model “Pirate map” with a target, to identify a corresponding on-screen
referent map from four options (one correct and three distractor maps). Participants
responded by manually pressing their answer on a touchscreen laptop. The scaling factor in
each trial was determined as the difference in the relative size of the referent and model maps
with respect to the participant. The task was presented as three blocks of six experimental
trials preceded by 2 practice trials (scaling factor of 1). Feedback was given for practice
trials. If incorrect, participants were asked to repeat the trial until the correct answer was
selected. Only participants correctly answering at least one of the two practice items on their
first attempt, continued to the experimental blocks. Scaling factor varied by experimental
block and was set at 1, 0.5 and 0.25 (i.e. the referent maps were, the same size, one half the
size, and one quarter the size of the model map, relative to the participant). Blocks were
presented in order of increasing scaling factor. Visual acuity also differed across trials.
Within each block, the overall area of the maps, and by extension the scaling factor, did not
change. However, half of the trials in each block were presented using a 6 x 6 square grid
(requiring gross level acuity) while half were presented using a 10 x 10 square grid (requiring
fine level acuity). Percentage accuracy was recorded.
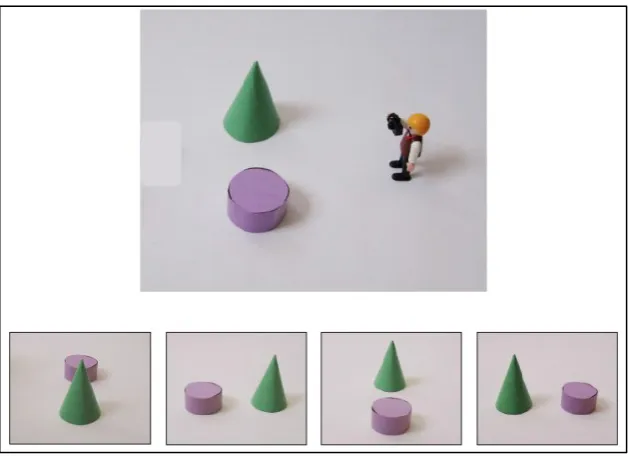
Extrinsic-dynamic- Perspective Taking Task
The Perspective Taking Task was included as a measure of extrinsic-dynamic spatial thinking
and was taken from Frick, Mohring, and Newcombe (2014). Participants were required to
15 based on a 3-D or pictorial representation of the photographer in an arrangement (Fig. 5).
Participants completed four practice trials with real, 3-D objects and Playmobil characters
holding cameras (to denote photographers). Feedback was given for practice trials and
participants were required to successfully answer all practice trials before moving to the 18
computer-based experimental trials. For experimental trials complexity was introduced by
increasing the number of objects in the stimulus picture (one, two or four objects). Trials also
differed in the angular difference between the participant and the photographer. Participants
completed equal numbers of trials in which they were positioned at 0°, 90° and 180° from the
photographer respectively. The order of presentation of trials was fixed such that the angular
difference changed between adjacent trials. In addition, the character acting as a photographer
and the objects (colour, shape, relative positions) were also changed between trials.
Percentage accuracy was recorded.
Mathematics Measures
Mathematics Achievement- NFER Progress in Mathematics Test Series
The National Foundation for Education Research (NFER), Progress in Mathematics (PiM)
test series is a standardised measure of mathematics achievement, designed to address the
National Mathematics Curriculum in England, Wales and Northern Ireland (National
Foundation for Educational Research (NFER), 2004). The test series includes items
assessing: number; algebra; shape, space and measures; and data handling. Specific,
age-appropriate tests were administered to each age group of participants, as per the test
guidelines (NFER, 2004). Age-based standardised scores with a mean of 100 and a standard
16
Approximate Number Sense Task
The Approximate Number Sense (ANS) Task used in this study was taken from Gilmore,
Attridge, De Smedt, and Inglis, (2014). In each trial, participants were required to compare
and identify the more numerous of two dot arrays (shown in Fig.6). Each set of dot arrays
was presented for 1500ms (or until a key press) and was followed by a fixation dot.
Participants used labelled keys on the left and right of the computer keyboard to respond.
Only participants who achieved at least 50% on the practice trials (eight trials) continued to
the 64 randomly presented experimental trials. The quantity of dots in each comparison array
ranged from 5 to 22. The ratio between the dots in each array varied between 0.5, 0.6, 0.7 and
0.8, with approximately equal numbers of trials assessing each of these ratios. The colour of
the more numerous array (red or blue) in addition to the size and the density of dot
presentation were counterbalanced between trials. Task performance was measured as
percentage accuracy.
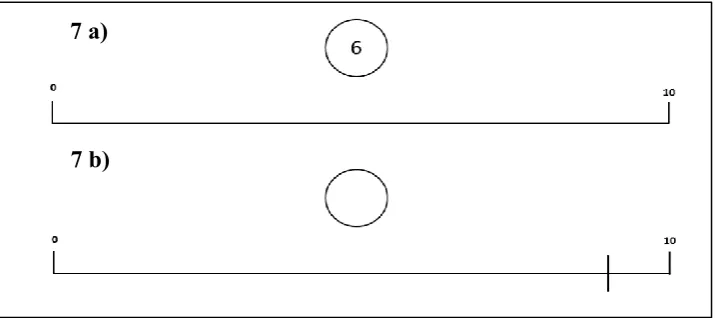
Number Line Estimation Task
The Number-Line Estimation Task used to assess numerical representation in this study, was
adapted from Siegler & Opfer, (2003).Two trial types were included, number estimation (NP)
and position estimation (PN) trials. As shown in Fig. 7a, for NP trials, participants were
presented with a target number and were asked to estimate its location on a number line by
drawing a straight line (hatch mark) through the number line at their selected location. As
shown in Fig. 7b, for PN trials participants were presented with a vertical hatch mark on a
number line and were asked to estimate what number was represented by the mark. To reduce
floor effects in younger children, and ceiling effects in older children, this task was
17 NP and one PN) followed by eight experimental trials (equal numbers of NP and PN trials
presented alternately). Performance on NP and PN trials were collapsed across blocks. Blocks
differed in the number line range presented. As per the Siegler & Opfer, (2003).method, the
number line in Block B ranged from 100 and the number line in Block C ranged from
0-1000. Block A with a range of 0-10 was added to reduce floor effects in younger children
who may be less familiar with larger numbers.
Trial order was fixed and increased in difficulty. The numbers included in each block were
chosen to enhance the identification of children’s use of logarithmic and linear models and to
minimize the impact of content knowledge (e.g., 25 is one quarter of 100). Similar to other
studies there was over-sampling of numbers below 20 (Friso-van den Bos et al., 2015; Laski
& Siegler, 2007). Participants were given the opportunity to complete all blocks. However,
the 0-10 block was considered an age specific measure, and was analysed, at 6 and 7 years
only. One measure of performance was Percentage Absolute Error (PAE). PAE is the
numerical distance from a participant’s answer to the correct answer, divided by the length of
the number line. This measure reflects the accuracy of participants’ estimates. Linear
response patterns (R2LIN) were also calculated for each block by completing curve estimation
for each participant, based on the correlation between participants’ estimates and the target
numbers. Linear response patterns indicate the degree to which a participant’s estimates are
linearly spread across the number line. PAE and linear response patterns for each block were
subsequently used as the outcome variables in all analysis (six mathematics outcome
variables), as both measures provide distinct information on numerical representations
(Simms, Clayton, Cragg, Gilmore, & Johnson, 2016).
Across all blocks where a participant’s mean percentage absolute error (PAE) scores for the
18 least 80% of items in a block, they were excluded from analysis for this block. For the 0-1000
block, only four children aged 6 years were eligible for inclusion, hence this age group was
excluded from analysis. For the Number Line Estimation Task, all results reported are based
on R2 LIN values. Similar patterns of performance, with smaller effects, were found for PAE
scores (see supplementary material).
Other measures
British Picture Vocabulary Scale (BPVS)
To control for verbal ability, the British Picture Vocabulary Scale (III), a measure of
receptive vocabulary, was administered (Dunn, Dunn, Styles, & Sewell, 2009). Given that
vocabulary is highly correlated with IQ (Sattler, 1988), the BPVS-III also acted as an
estimate of general IQ. Asper the administration guidelines, participants were asked to select
which of four coloured pictures best illustrated the meaning of a given word.
Procedure
Each participant completed the battery of mathematics, spatial and vocabulary measures,
across three test sessions. Two further sessions included science measures not reported here
(see Hodgkiss, Gilligan, Tolmie, Thomas & Farran, 2018). Within each session, mathematics
tasks were completed prior to spatial tasks in order to avoid mathematics improvements due
to spatial training effects (Cheng & Mix, 2014). Beyond this, task order within each session
was randomised. During Session 1, a one-hour classroom-based session, a standardised
measure of mathematics, the NFER PiM Test and (for children aged 8 years and older) the
Number-Line Task, were completed. Session 2, a 35-minute session, was completed in the
19 For computerised tasks, Hewlett Packard (HP) computers with a screen size of 17 inches
were used. Children completed mathematics tasks (the ANS Task, the CMAQ and the
Number-Line Task [children aged 7 and younger]) and spatial measures (the Mental Rotation
Task and a Folding task [not discussed here]). For session 3, participants were tested
individually in a quiet room using a 13-inch HP touch-screen laptop. This session lasted 45
minutes and included spatial tasks (the Perspective Taking Task, the CEFT and the Scaling
Task) and the vocabulary measure (the BPVS).
Analysis Strategy
Due to school absences and technical errors, 10 participants had missing scores for a single
task in the battery (the proportion of missing data was 0.7%). Missing data were distributed
as follows: the CEFT (one participant); the Perspective Taking Task (two participants); the
NFER PiM Test (two participants); the ANS Task (two participants); the Number Line Task
(one participant); and the BPVS (two participants). As no individual participant was missing
data for more than one task, and to optimise power, missing values were replaced by mean
scores on that task for a participant’s age group. Parametric analyses were completed as tests
of normality indicated that all measures were broadly normal. For all measures, performance
across age groups was viewed graphically. For measures in which a ceiling (or floor effect)
was suspected, one-sample t-tests were completed against ceiling (or floor) performance. For
percentage accuracy scores, floor and ceiling were set at 0% and 100% respectively. For
R2LINscores, floor and ceiling levels were set at 0 and 0.99 respectively. No significant floor
or ceiling effects were found.
Gender differences in spatial and mathematics performance were investigated using
20 [.05/14]). Where Levene’s test was violated, the results for unequal variances were reported.
Correlations were completed to investigate the relative associations between measures and to
inform regression models. Hierarchical regression models were completed for each
mathematical outcome, to investigate the proportion of mathematical variation explained by
spatial skills, after accounting for other known predictors of mathematical performance
including language ability (the BPVS) and age. Gender was included as a control variable for
mathematics tasks with which it was significantly correlated.
For regression models, all predictors were converted to z-scores prior to entry. The
collinearity statistics indicated appropriate Tolerance and VIF scores for all regression
models, where a cut off of > 0.2 was used for Tolerance scores (Menard, 1995) and a cut off
of < 10 was used for VIF scores (Myers, 1990). For all models, the control variables were
added in Step 1. In Step 2, the spatial measures were entered together, as there was no strong
evidence as to which skills might best predict different aspects of mathematical performance.
In step 3 interaction terms between age and each spatial skill were added using forward
stepwise entry. Only significant interactions were retained in the final models. These
significant interactions were further explored using scatterplots. Based on changes in
performance patterns across age groups (determined visually from the graphs) the sample was
divided into younger and older age groups. Follow up regressions were completed with
younger and older participants respectively. For all regression analyses, adjusted r2 values are
reported.
The sample size was determined using GPower. Based on previous studies on the role of
spatial thinking as a predictor of mathematics, a medium to large effect size was expected
(Gilligan et al., 2017: f2=.217). Power analysis was based on the largest possible regression
21 spatial predictors and four age*spatial task interaction terms. To achieve power of 0.8, 78
participants were required. Due to missing data (described above) for some tasks, the desired
participant numbers were not achieved for all models. Post-hoc power analysis was
completed to determine the achieved power for each model. Except for the 0-10 Number Line
Estimation Task, all models achieved a power level greater than .91, which is above the
suggested power level of 0.8 (Cohen, 1988). The results for the 0-10 Number Line Estimation
Task should be interpreted cautiously due to the relatively low power of this model (.754)
(see supplementary material).
Results
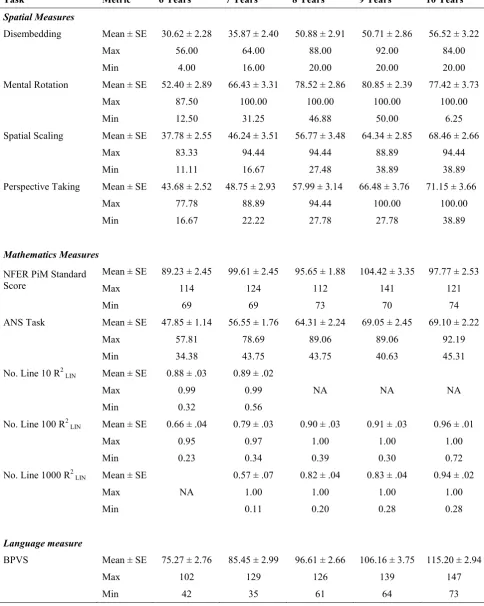
Overall task performance
Descriptive statistics across age groups are shown in Table 2. Variation in task performance
was reported for all measures, with no floor or ceiling effects. Where possible to measure,
task performance was above chance across age groups. The only exception to this was 6 year
olds’ performance on the ANS task, t (29) = -1.89, p =.069, d = -0.35. Given that this might
reflect poor ability rather than a poor understanding of the task aims, performance of this
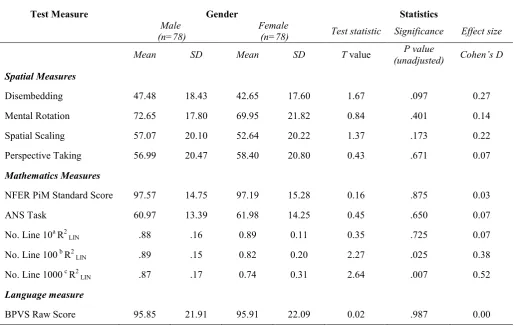
group on the ANS task was retained in the analyses. As shown in Table 3, there were no
significant gender differences for any of the spatial measures or the BPVS (p > .05). For
unadjusted p values, significant differences favouring males were reported for both the 0-100
(p =.025, d= 0.38) and the 0-1000 (p =.007, d = 0.52) block of the Number Line Estimation
Task. These differences were not significant when the results were adjusted for multiple
comparisons (alpha level = .004). However, to ensure that the influence of gender was not
overlooked, gender was included as a control variable in subsequent regression analysis for
22
Associations between task performance on different measures
The results of bivariate correlations between all measures are outlined in Table 4. Significant
correlations at the p < .001 level were reported between the performance accuracy scores for
all spatial measures. For mathematics measures, the NFER PiM test and the ANS Task were
significantly correlated with all spatial measures and the BPVS (p < .001). The 100 and
0-1000 blocks of the Number Line Estimation Task were significantly correlated with the
spatial measures and the BPVS, with the exception that the 0-1000 task was not correlated
with mental rotation (p =.080). For the 0-10 block of the Number Line Estimation Task
significant associations were found for spatial scaling (p = .034) and the 0-100 block of the
Number Line Estimation Task (p < .001) only.
Identifying predictors of mathematics outcomes
Hierarchical regression models were completed for each mathematical outcome to investigate
the proportion of mathematical variation accounted for by spatial skills, after controlling for
other known predictors of mathematics. The results reported in Tables 5 to 9 reflect the
regression statistics (b, SE, ß, t and p) for the final models (i.e. when all predictors had been
entered).
Model 1: Identifying predictors of standardised mathematics performance
Model 1 sought to determine the contribution of different spatial skills to the variation in
standardised mathematics performance, as measured using the NFER PiM test. As shown in
23 In step 1, the control variables including age1 and language ability were added to the model
accounting for 28.2% of the variation in standardised mathematics performance. In step 2, the
spatial measures were added to the model, uniquely predicting an additional 12.4% of the
variation. Finally, in step 3 interaction terms between each spatial skill and age were entered
into the model. Only the interaction between mental rotation and age was retained. It
accounted for an additional 2.0% of the variation in standardised mathematics performance.
Taken together, age, language ability, spatial scaling, disembedding and the interaction term
between mental rotation and age, were all significant predictors of mathematics achievement
in the final model.
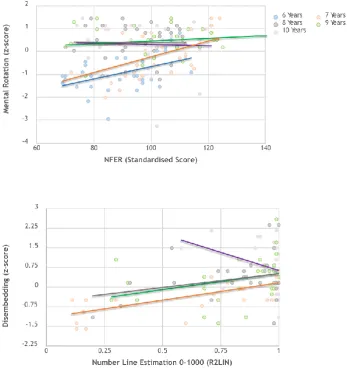
The interaction was explored graphically by plotting standardised mathematics scores against
mental rotation scores for each age group (Fig. 8). The graph indicated a difference in the
relationship between measures at 6 and 7 years compared to 8,9 and 10 years. The sample
was divided accordingly, and the regression analysis was re-run using younger (6 and 7
years; n = 60) and older groups (8, 9 and 10 years; n = 93) respectively. As shown in Table 5,
the patterns reported for both age groups were broadly similar to the overall model, with
spatial scaling and disembedding identified as significant predictors in both models.
However, for younger participants mental rotation approached significance (p =.057) and the
ß values were similar for mental rotation (ß = .20) compared to disembedding (ß = .22) and
1 Although year-group based standardised scores were used for the NFER PiM task, these
scores were standardised across an entire academic year group. As such, exact age (in
months) on day one of testing was also included as a predictor, to account for age-based
24 spatial scaling (ß = .27). This pattern was not present for the older group, and a
non-significant ß value was reported for mental rotation (ß = -.13).
Model 2: Identifying predictors of ANS performance
Model 2 investigated the role of spatial skills in explaining ANS performance. The final
model explained 40.4% of the variation in ANS skills. As before, the control variables were
entered in step 1 and explained 32.0% of ANS variation. The four spatial measures were
added in step 2, accounting for an additional 8.4% of the variation. Interaction terms between
each spatial skill and age were entered in step 3. No interactions with age were retained in the
final model. As shown in Table 6, spatial scaling and age were significant predictors in the
final model.
Model 3: Identifying predictors of 0-10 number line estimation performance
In model 3 the role of spatial skills as a predictor of R2
LIN values on the 0-10 Number Line
Estimation Task was explored. The control variables including gender were added in step 1
led to a negative adjusted R 2 value (-3.6%). Hence, these variables were removed, and the
regression was re-run. In the revised model, the spatial tasks were added to the model in step
1, explaining 12.6% of the variation. Interaction terms between each spatial skill and age
were entered in step 3, however none were retained in the final model. The final model
accounted for 12.6% of the variation. Spatial scaling and rotation were the only significant
predictors (see Table 7).
Model 4: Identifying predictors of 0-100 number line estimation performance
Model 4 explored the role of spatial skills in explaining R2 LIN performance on the 0-100
25 32.9% of the variation. In step 2 the spatial skills added accounted for an additional 5.6% of
the variation. None of the interaction terms added in step 3 were retained in the model. As
shown in Table 8, the final model accounted for 38.5% of the variation. Disembedding and
spatial scaling were significant predictors in the final model.
Model 5: Identifying predictors of 0-1000 number line estimation performance
Model 5 explored the contribution of spatial skills to R2
LIN scores on the 0-1000 Number Line
Estimation Task. The control variables including gender added in step 1 explained 28.3% of
the variance in task performance. The spatial skills added in step 2 accounted for an
additional 8.6% of the variation. In step 3 interaction terms between each spatial skill and age
were added. The interactions between age and spatial scaling, and between age and
disembedding were retained, explaining an additional 6.6 % and 2.4% of the variation
respectively. The final model outlined in Table 9 explained 45.9% of the variation on the
0-1000 block of the Number Line Estimation Task. Age, language ability, gender, spatial
scaling, disembedding and the interaction terms (between spatial scaling and age, and
disembedding and age) were significant predictors in the final model.
The interaction was explored graphically (Fig. 8). For both spatial scaling and disembedding,
the figure indicated a linear relationship with number line estimation performance at 7,8 and
9 years. However, there was no linear relationship between these spatial skills and number
line performance at 10 years. The figure indicated that for this task, performance at 10 years
approached ceiling levels, lacked variability and was significantly negatively skewed. Thus, it
was concluded that the age-based interactions reported were likely due to a lack of variability
in performance scores at 10 years and not a true age-based effect. The interaction was not
26
Discussion
Spatial skills were identified as significant predictors of several mathematics outcomes, even
after controlling for other known predictors of mathematics. This study was founded on a
population of primary school children aged 6 to 10 years. For some spatial sub-domains their
role in predicting mathematical outcomes, was consistent across age groups. Spatial skills
explained 12.4% of general mathematics performance with disembedding (intrinsic-static
sub-domain) and spatial scaling (extrinsic static sub-domain) identified as significant
predictors. For the ANS task, although spatial skills predicted 8.4% of the variation in
performance, spatial scaling (extrinsic-static sub-domain) was the only significant spatial
predictor. In contrast, spatial skills explained 12.6%, 5.6% and 8.6% of the variation on the
0-10, 0-100 and 0-1000 blocks of task respectively. Spatial scaling (extrinsic-static
sub-domain) was a significant predictor for all three blocks of the Number Line Estimation Task.
Some spatial sub-domains had age-dependent relations with mathematical outcomes. The role
of mental rotation (intrinsic-dynamic sub-domain) in predicting standardised mathematics
outcomes was significant at 6 and 7 years only. At 6 and 7 years, mental rotation was also a
significant predictor of 0-10 number line estimation. For the 0-100 and 0-1000 blocks of the
Number Line Estimation Task, mental rotation was not a significant predictor for any age
groups. These findings are consistent with Mix et al., (2016; 2017) and suggest a transition in
the spatial skills that are important for mathematics, which occurs in middle childhood at
approximately 7 to 8 years (Mix et al., 2016; 2017). Here, this transition is defined by a
reduction in the role of mental rotation for mathematics performance. As discussed below,
successful performance on mental rotation tasks requires mental visualisation. Therefore,
these performance patterns may reflect a reduction in the use of mental visualisation
27 this study reports some age dependent effects and indicates that for some spatial skills, their
role in predicting mathematics changes through development.
These results support multi-dimensional models of spatial thinking (Buckley et al., 2018).
The four spatial predictors included in this study (measuring each of Uttal et al.’s [2013] and
Newcombe and Shipley’s [2015] four theoretically motivated spatial sub-domains) were
found to have varying roles in explaining mathematics outcomes. Previous studies of primary
school children have typically explored associations between intrinsic-dynamic spatial tasks
and mathematics. The results of this study highlight the importance of other spatial
sub-domains in explaining mathematics outcomes, particularly spatial scaling (extrinsic-static
sub-domain). Thus failures to find significant spatial-mathematical associations in some
previous studies may reflect the limited spatial sub-domains assessed or the age of the
participants tested (Carr, Steiner, Kyser, & Biddlecomb, 2008).
Mechanisms underpinning spatial-mathematics associations
Spatial scaling was a significant predictor of all mathematics measures in this study. In line
with (Möhring et al., 2015) shared proportional reasoning requirements are highlighted here,
as a likely underlying mechanism explaining these findings. For the Number Line Estimation
Task, there is a clear role for proportional reasoning. For example, 28 can be positioned on a
0-100 number line with relatively high accuracy by dividing the line into 4 portions. For
standardised mathematics performance, there are a range of mathematics topics that may
require proportional reasoning such as reasoning about fractions or completing area and
distance questions. For the ANS Task, proportional reasoning can be used to compare the
ratios of the dot arrays presented. The relations between spatial scaling and ANS performance
28 number mechanism such as the Mental Number Line, as symbolic number representations are
not required for dot comparison in the ANS Task. Taken together, these findings support the
concept that proportional reasoning may be the underlying shared cognitive mechanism
between spatial scaling and mathematics skills.
Disembedding was a significant predictor of both number line estimation and standardised
mathematics performance. These associations may be attributable to shared form perception
demands of these tasks. Form perception is the ability to distinguish shapes and symbols
(Mix et al., 2016). As outlined in the introduction, for standardised mathematics, form
perception is theoretically useful for distinguishing symbols and digits such as + and ×
symbols, interpreting charts, and completing multistep calculations (Mix and et al., 2016;
Landy & Goldstone, 2007; 2010). For the Number Line Estimation Task, form perception is
required for the identification of numeric symbols and use of symbols and for interpreting
and using the visual diagrams presented.
Finally, mental rotation was a significant predictor of mathematics outcomes for younger
participants only. For both standardised mathematics and the 0-10 block of the Number Line
Estimation Task, mental rotation was a significant predictor at 6 and 7 years. It is proposed
that mental rotation requires active processing including mental visualisation (Mix et al.,
2016; (Lourenco et al., 2018). The findings reported here suggest that younger children may
use mental models to visualise problems, including mathematics problems. Mental
visualisations may be used to represent and organise complex word problems or
mathematical relationships (Huttenlocher et al., 1994; Laski et al., 2013; Thompson et al.,
2013). The results reported in this study also suggest that the use of mental visualisation
strategies in mathematics is less common in older age groups. That is not to say that mental
29 in later schooling, e.g., visualising graphs in 3-D, plotting vectors, graphing functions from
equations. However, for the specific mathematics tasks included in this study, an age effect of
mental model use was found.
As outlined in the introduction, the Perspective Taking Task was also hypothesised to recruit
mental visualisations. However, this task was not a significant predictor of any of the
mathematics outcomes. These findings highlight an important distinction between different
types of mental visualisations based on the frame of reference being transformed. Hegarty
and Waller (2004) found that object transformation ability and viewer/perspective
transformation ability are two distinct spatial factors. Here we suggest that these two mental
transformation abilities are differentially associated with mathematics in children. Egocentric
object-based transformations (required for mental rotation and other intrinsic-dynamic tasks)
are important for mathematics, however allocentric viewer transformations (as required for
perspective taking and other extrinsic-dynamic tasks) are not (at least for the age-range
measured). This is an important distinction, particularly for the design of training studies
targeting mental visualisation skills. These findings are consistent with Mix et al., (2016;
2017) who did not find that perspective taking loaded significantly onto mathematics at 6, 9
or 11 years. However, there was a significant cross factor loading of mental rotation onto
mathematics at 6 years (not age 9 or 11 years).
Taken together, the findings in this study provide evidence for the proposal that there are
different explanations underpinning spatial-mathematical associations, depending on the
30
The role of control variables
This study highlights associations between vocabulary and mathematics performance.
Accounting for spatial ability and the other control variables, vocabulary remained a
significant predictor of standardised mathematics performance, and the most difficult 0-1000
Number Line Estimation Task only. These findings are consistent with previous evidence that
language skills are a significant longitudinal predictor of general mathematics achievement,
controlling for spatial ability, in the early primary and pre-school school years (Gilligan et al.,
2017; LeFevre et al., 2010). The results are also consistent with findings that language is a
significant predictor of science achievement in the primary school years, controlling for
spatial thinking (Hodgkiss et al., 2018). Taken together the evidence suggests that language
and spatial skills have distinct relations to mathematics (and science).
No significant performance differences were found between males and females on any of the
spatial tasks included in the study. Historically, other studies have reported a male advantage
in spatial task performance in childhood (e.g., Carr et al., 2008; Casey et al., 2008). However,
the results of this study add to the growing body of literature arguing that the spatial
performance of girls and boys is equivalent (e.g., Gilligan et al., 2017; Halpern et al., 2007;
LeFevre et al., 2010). In the domain of mathematical cognition, a significant male advantage
was found for 0-100 (d = .38) and 0-1000 (d = .52) number line estimation performance only.
This is consistent with previous mixed findings in this domain, such that some studies argue
for (Gilligan et al., 2017; Halpern et al., 2007; Penner & Paret, 2008) and others argue
against (Lindberg, Hyde, Petersen, & Linn, 2010) gender differences in mathematics
performance. The findings reported in this study suggest that gender differences in
mathematics performance are task specific. Differences in the mathematics outcomes used
31
Future directions and limitations
In summary, spatial skills were significant predictors of performance across all mathematics
measures, explaining approximately 5-14% of the individual variation in performance. These
results suggest that training spatial thinking would confer benefits for both spatial and
mathematics outcomes. There are mixed findings on the transfer of training gains (to
untrained domains) in other cognitive domains such as working memory (for a review see
(Melby-Lervåg, Redick, & Hulme, 2016). However, we suggest that far transfer of training
gains is constrained by an understanding of the underlying cognitive mechanisms of training
targets. Thus, the proposed task and age dependent explanations for spatial-mathematics
associations, strengthen the likelihood of far transfer of gains. For example, the findings of
this study suggest that spatial scaling training would lead to improvements in ANS
performance given the proposed proportional reasoning requirements of both tasks. However,
there is no evidence to suggest that mental rotation training would render ANS performance
gains. As such, this study highlights the importance of choosing theoretically motivated, task
and age sensitive targets for spatial training.
This study does not offer insight into the causal relationship between spatial and
mathematical thinking. Although mathematics skills may play a causal role in spatial
performance, given the educational importance of mathematics, this study proposes that
future training studies explore a possible causal role of spatial skills for mathematical
thinking. To understand the causal relationship between specific spatial and mathematical
skills, training on specific spatial tasks is required. There is evidence that spatial training, in
which spatial thinking is embedded into mathematical instruction, leads to gains in spatial
and mathematics outcomes (geometry performance) in children aged 6 (Hawes et al., 2017)
32 applications, they cannot offer insights into the causal relationship between spatial and
mathematical skills, as the mathematical and spatial aspects of training cannot be
disentangled.
This study highlights spatial scaling as a particularly useful target for spatial skill training
(.23 < β < .55, across mathematics outcomes). We propose two reasons for these findings.
First, there is a proposed underlying mechanism (proportional reasoning) linking each of the
mathematics tasks in this study to spatial scaling. There is no theoretical reason to predict that
spatial scaling would be associated with all mathematics tasks, particularly those with no
proportional reasoning requirement e.g., multi-digit calculation. Second, in spatial scaling
tasks, participants are required to compare two differently scaled spaces (i.e., it is an
extrinsic-static task). However, in the context of an individual object, scaling can also be
viewed as an object transformation i.e., expanding or contracting an object (Newcombe &
Shipley, 2015). Object transformations like this are required in intrinsic-dynamic tasks. In
this way spatial scaling tasks may elicit both proportional reasoning and mental
transformation, two processes that are required for different mathematics tasks. The results
also highlight mental rotation and disembedding as potential spatial training targets, for some
but not all aspects of mathematics, at certain ages. In support of this, gains in calculation
performance have been reported following mental rotation training (intrinsic-dynamic spatial
skills) in young children (Cheng & Mix, 2014). However, in another study, mental rotation
training was unsuccessful in eliciting mathematical gains in children (Hawes et al., 2015).
While the findings reported here suggest that, theoretically, mental rotation training should
render gains in some mathematics tasks (such as missing term problems, balancing equations
and word problems), future research is required to explore the features of training that might
33 This study is the first to explicitly compare the role of Uttal et al.’s (2013) four sub-domains
of spatial thinking in explaining mathematics outcomes. Despite including all of Uttal et al’s
(2013) sub-domains, this study focuses on small scale spatial thinking only. This involves
table-top tasks, where there is no need for whole-body movement or for changing location
(Broadbent, 2014). Future work might extend these findings to include large scale spatial
processes which require movement and observations from a number of vantage points, e.g.,
using real world or virtual navigation tasks (Kuipers, 1978;1982). Similarly, while this study
is the first to explore associations between spatial and mathematics skills in children aged 6
to 10 years using a cross-sectional approach, the findings could be strengthened by
longitudinal research following a single cohort of participants through development from 6 to
10 years.
Unfortunately, as outlined by Davis, Drefs, and Francis, (2015) mathematics curricula do not
typically focus on spatial thinking. Indeed, the current UK mathematics curriculum at Key
stage 2 explicitly refers to spatial thinking only once, in reference to the representations of
large numbers (Department of Education, 2013). Hence, our findings suggest that there is a
need for “spatialisation” of the primary school classroom such that children are: taught how
to read diagrams and graphs; encouraged to sketch and draw; and given hands on
opportunities to manipulate and explore with 3D materials, among others (Newcombe, 2013).
Enhancing spatial thinking in children may have both direct and indirect benefits for
attainment. This study highlights spatial scaling, mental rotation (specifically for younger
students) and disembedding (for some mathematics measures only) as possible targets for
spatial training. Beyond direct benefits to spatial thinking, spatial training may lead to
mathematical achievement gains, and have indirect economic benefits for STEM industries.
34 (Confederation of British Industry [CBI], 2013), improving STEM skills is a pressing
economic priority (Centre for Economics and Business Research [CEBR], 2015).
Engagement with and improvement of spatial thinking may offer a novel means of improving
35
References
Ansari, D. (2008). Effects of development and enculturation on number representation in the
brain. Nature Reviews. Neuroscience, 9(4), 278–291. https://doi.org/10.1038/nrn2334
Aunola, K., Leskinen, E., Lerkkanen, M.-K., & Nurmi, J.-E. (2004). Developmental
Dynamics of Math Performance From Preschool to Grade 2. Journal of Educational
Psychology, 96(4), 699–713. https://doi.org/10.1037/0022-0663.96.4.699
Barsalou, L. W. (2008). Grounded Cognition. Annual Review of Psychology, 59(1), 617–645.
https://doi.org/10.1146/annurev.psych.59.103006.093639
Barth, H. C., & Paladino, A. M. (2011). The development of numerical estimation: evidence
against a representational shift: Development of numerical estimation. Developmental
Science, 14(1), 125–135. https://doi.org/10.1111/j.1467-7687.2010.00962.x
Barth, H., La Mont, K., Lipton, J., & Spelke, E. S. (2005). Abstract number and arithmetic in
preschool children. Proceedings of the National Academy of Sciences, 102(39),
14116–14121. https://doi.org/10.1073/pnas.0505512102
Broadbent, H. (2014). Large-scale visuospatial cognition in Williams syndrome and typically
developing children (Unpublished doctoral dissertation). London: Institute of
Education, University of London.
Broadbent, H. J., Farran, E. K., & Tolmie, A. (2014). Object-based mental rotation and visual
perspective-taking in typical development and Williams syndrome. Developmental
Neuropsychology, 39(3), 205–225. https://doi.org/10.1080/87565641.2013.876027
36 Carey, S. (2004). Bootstrapping & the origin of concepts. Daedalus, 133(1), 59–68.
https://doi.org/10.1162/001152604772746701
Carey, S. (2009). Where Our Number Concepts Come From. The Journal of Philosophy,
106(4), 220–254.
Carr, M., Alexeev, N., Wang, L., Barned, N., Horan, E., & Reed, A. (2017). The
Development of Spatial Skills in Elementary School Students. Child Development.
https://doi.org/10.1111/cdev.12753
Carr, M., Steiner, H. H., Kyser, B., & Biddlecomb, B. (2008). A comparison of predictors of
early emerging gender differences in mathematics competency. Learning and
Individual Differences, 18(1), 61–75. https://doi.org/10.1016/j.lindif.2007.04.005
Casey, B. M., Andrews, N., Schindler, H., Kersh, J. E., Samper, A., & Copley, J. (2008). The
Development of Spatial Skills Through Interventions Involving Block Building
Activities. Cognition and Instruction, 26(3), 269–309.
https://doi.org/10.1080/07370000802177177
Casey, B. M., Pezaris, E., Fineman, B., Pollock, A., Demers, L., & Dearing, E. (2015). A
longitudinal analysis of early spatial skills compared to arithmetic and verbal skills as
predictors of fifth-grade girls’ math reasoning. Learning and Individual Differences,
40, 90–100. https://doi.org/10.1016/j.lindif.2015.03.028
Centre for Economics and Business Research (CEBR). (2015). The contribution of
engineering to the UK economy- the multiplier impacts. London.
Chatterjee, A. (2008). The Neural Organization of Spatial Thought and Language. Seminars
37 Cheng, Y. L., & Mix, K. S. (2014). Spatial Training Improves Children’s Mathematics
Ability. Journal of Cognition and Development, 15(1), 2–11.
https://doi.org/10.1080/15248372.2012.725186
Clarke, B., & Shinn, M. (2004). A Preliminary Investigation into the Identification and
Development of Early Mathematics Curriculum-Based Measurement. School
Psychology Review, 33(2), 234–248.
Cohen, D. (1988). Statistical power analysis for the behavioural sciences (2nd ed.). Hillsdale,
NJ: Lawrence Earlbaum Associates.
Confederation of British Industry (CBI). (2013). Changing the pace: CBI/Pearson education
and skills survey 2013. London: CBI.
Cordes, S., Gelman, R., Gallistel, C. R., & Whalen, J. (2001). Variability signatures
distinguish verbal from nonverbal counting for both large and small numbers.
Psychonomic Bulletin & Review, 8(4), 698–707.
Cutini, S., Scarpa, F., Scatturin, P., Dell’Acqua, R., & Zorzi, M. (2014). Number-Space
Interactions in the Human Parietal Cortex: Enlightening the SNARC Effect with
Functional Near-Infrared Spectroscopy. Cerebral Cortex, 24(2), 444–451.
https://doi.org/10.1093/cercor/bhs321
Davis, B., Drefs, M., & Francis, K. (2015). A history and analysis of current curriculum. In
Spatial Reasoning in the Early Years; Principles, Assertions and Speculations (pp.
38 de Hevia, M. ., Vallar, G., & Girelli, L. (2006). Visuo-spatial components of numerical
representation. In Imagery and Spatial Cognition: Methods, models and cognitive
assessment. John Benjamins Publishing.
Dehaene, S. (2011). The number sense. New York: Oxford University Press.
Dehaene, S., Bossini, S., & Giraux, P. (1993). The mental representation of parity and
number magnitude. Journal of Experimental Psychology: General, 122(3), 371–396.
https://doi.org/10.1037/0096-3445.122.3.371
Dehaene, S., Piazza, M., Pinel, P., & Cohen, L. (2003). Three parietal circuits for number
processing. Cognitive Neuropsychology, 20(3–6), 487–506.
https://doi.org/10.1080/02643290244000239
Department of Education. (2013). Mathematics programmes of study: key stages 1 and 2
National curriculum in England. Retrieved from Retrieved from:
https://www.gov.uk/government/publications/national-curriculum-in-england-mathematics-programmes-of-study
Department of Education. (2017). Schools, pupils and their characteristics: January 2017.
Retrieved from Retrieved from
https://www.gov.uk/government/statistics/schools-pupils-and-their-characte ristics-january-2017
Dunn, L. M., Dunn, D. M., Styles, B., & Sewell, J. (2009). The British Picture Vocabulary
Scale - 3rd Edition. London: GL Assessment.
Feigenson, L., Dehaene, S., & Spelke, E. (2004). Core systems of number. Trends in