R E S E A R C H
Open Access
Evaluation of 3D blood flow patterns and wall
shear stress in the normal and dilated thoracic
aorta using flow-sensitive 4D CMR
Jonas Bürk
1*, Philipp Blanke
1, Zoran Stankovic
1,3, Alex Barker
1,3, Maximilian Russe
1, Julia Geiger
1,
Alex Frydrychowicz
2, Mathias Langer
1and Michael Markl
1,3Abstract
Background:The purpose of this study was to investigate 3D flow patterns and vessel wall parameters in patients with dilated ascending aorta, age-matched subjects, and healthy volunteers.
Methods:Thoracic time-resolved 3D phase contrast CMR with 3-directional velocity encoding was applied to 33 patients with dilated ascending aorta (diameter≥40 mm, age=60±16 years), 15 age-matched normal controls (diameter≤37 mm, age=68±7.5 years) and 15 young healthy volunteers (diameter≤30 mm, age=23±2 years). 3D blood flow was visualized and flow patterns were graded regarding presence of supra-physiologic-helix and vortex flow using a semi-quantitative 3-point grading scale. Blood flow velocities, regional wall shear stress (WSS), and oscillatory shear index (OSI) were quantified.
Results:Incidence and strength of supra-physiologic-helix and vortex flow in the ascending aorta (AAo) was significantly higher in patients with dilated AAo (16/33 and 31/33, grade 0.9±1.0 and 1.5±0.6) than in controls (2/15 and 7/15, grade 0.2 ± 0.6 and 0.6 ± 0.7,P<.05) or healthy volunteers (1/15 and 0/15, grade 0.1 ± 0.3P<.05). Greater strength of the ascending aortic helix and vortex flow were associated with significant differences in AAo diameters (P<.05). Peak systolic WSS in the ascending aorta and aortic arch was significantly lower in patients with dilated AAo (P<.0157-.0488). AAo diameter positively correlated to time to peak systolic velocities (r=0.30-0.53,P<.04), OSI (r=0.33-0.49,P<0.02) and inversely correlated to peak systolic WSS (r=0.32-0.40,P<.03). Peak systolic WSS was significantly lower in AAo aneurysms at the right and outer curvature within the AAo and proximal arch (P<.01-.05). Conclusions:Increase in AAo diameter is significantly correlated with the presence and strength of supra-physiologic-helix and vortex formation in the AAo, as well with decrease in systolic WSS and increase in OSI.
Keywords:4D flow, Flow quantification, Aneurysm of the ascending aorta
Background
Thoracic aortic aneurysmal disease is frequent, fre-quently involving the aortic root and ascending aorta [1,2]. It can be complicated by dissection or rupture with an increased lifetime risk when the aortic diameters ex-ceed 6 cm [1]. The mean growth rate of thoracic aneur-ysms is only about 0.1 cm/year, although there is substantial variation in individual aneurysm progression [3]. Established risk factors for an accelerated aneurysm
growth rate include simple geometric markers such as ini-tial size or localization. In addition, the presence of aortic valve disease (stenosis), congenital abnormalities (bicuspid aortic valve), or connective tissue disorders can influence aneurismal growth. However, predicting aneurysm progression is nearly impossible and dissection and rupture also occur at diameters under 6 cm [3,4].
Recent studies have focused on establishing alternative criteria for evaluating aneurysms, i.e. RNA expression patterns, biomarkers, aortic curvature geometry and mechanical properties of the aorta [1,5,6]. In this con-text, the assessment of aortic hemodynamics and the presence of altered flow patterns, as well as distribution * Correspondence:[email protected]
1
Department of Diagnostic Radiology, Medical Physics, University Hospital, Freiburg, Germany
Full list of author information is available at the end of the article
and changes in wall shear stress (WSS) and the oscilla-tory shear index (OSI) and their association with changes in aorta size may provide further insights in how aneurysms develop and in assessing the risk of dissection [7,8]. These factors may play an important role in aneurysm development and can be assessed by time-resolved 3D phase contrast cardiovascular mag-netic resonance (CMR) with 3-directional velocity en-coding (flow-sensitive 4D CMR), also providing comprehensive information on aortic hemodynamics with 3D visualization of blood flow pattern [9-11].
The purpose of this study was to investigate 3D flow patterns and vessel wall parameters in the ascending aorta and aortic arch in correlation to the vessel geometry in patients with dilated ascending aorta, age-matched subjects, and healthy volunteers.
Methods
Study population
This study was institutional review board-approved; written informed consent was obtained from all participants. The study population consisted of three cohorts: 33 patients with dilated ascending aorta or AAo aneurysm (diameter >40 mm, 30 male, 3 female, mean age 59.8±15.9 years), 15 age-matched normal controls (AAo diameter <40 mm, 12 male, 3 female, mean age 67.1±7.5 years) and 15 healthy young volunteers (12 male, 3 female, mean age 22.7±1.6 years) were included. Patients and age matched controls were retrospectively included from a study cohort comprising 150 patients, examined between 2006 and 2009 for investigation of aortic blood flow patterns in stroke patients. 29% of the patients with dilated ascending aorta had transient ischemic attacks, 71% ischemic infarctions vs. 26%/74% of the age matched controls. Inclusion criteria were age 18 to 85 years and suitability for CMR examination at 3 Tesla. In our study we chose to include only aneurysm patients who did not have other cardiovascular abnormalities to focus on the relationship of hemodynamics and aortic dilatation. Exclusion criteria’s were ejection fraction (EF) <35%, aortic valve disease, determined by transesophageal echocardiography or known connective tissue disorders. The study cohort, as well as inclusion and exclusion criteria, was also previously described [12-14].
CMR
All examinations were performed on a 3 T MR System (Siemens, Erlangen, Germany) using flow-sensitive 4D CMR based on an RF-spoiled gradient-echo sequence with interleaved three-directional velocity encoding. All measurements were prospectively gated to the ECG. Scanning was performed during free breathing using navigator respiratory gating based on diaphragm motion as described previously [15]. Data were acquired in a
sagittal oblique 3D slab encompassing the thoracic aorta. Imaging parameters were as follows: venc =150 m/s, spatial resolution =1.6-2.2 × 2.1-3.2 × 2.4-3.5 mm3, field of view 400 × 300 mm2, flip angle α=7-15°, echo time (TE) =2.6-3.5 ms, repetition time (TR) =5.1-6.1 ms, tem-poral resolution =40.8-48.8 ms, axial-oblique 3D Volume. Diameters of the ascending aorta (AAo), arch, and proximal descending aorta (DAo) were determined by electronic cali-per measurements from additional morphological CMR data, using a T1-weighted radiofrequency-spoiled and fat-saturated 3D gradient echo sequence with an isotropic resolution of 1 mm3. Diameters were measured at the level of analysis planes number 1,5 and 8 (see Figure 1). In order to minimize wall motion and breathing artifacts, data were acquired during a short diastolic window (157–158 ms) combined with respiratory navigator gating. Imaging para-meters were as follows: voxel size = 0.8 × 1.1 × 1.1 mm3; field of view = 350 × 252 mm2; echo time/pulse repetition time = 1.7-2.3/5.1-5.5 ms; flip angleα=20°.
Data processing and 3D blood flow visualization
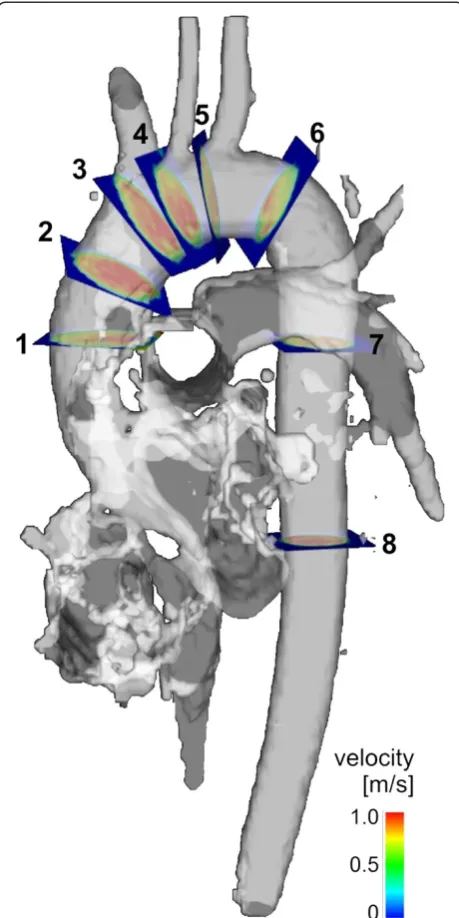
Data processing included eddy current and velocity aliasing correction and the calculation of a 3D phase contrast angiogram (3D PC-MRA) from the 4D data (Figure 1, gray-shaded iso-surfaces) [16]. Flow pattern analysis (EnSight, CEI, Apex, USA) was based on time-resolved particle traces originating from a total of three predefined, manually positioned emitter planes, posi-tioned at the following locations as outlined in Figure 1: in the proximal ascending aorta at the level of the pul-monary artery (Plane 1), in the ascending aorta proximal to the origin of the brachiocephalic trunk (Plane 3), and in the proximal descending aorta (Plane 6). Particle traces visualize the path of virtual massless particles released from the emitter planes in spatially and temporally varying, three-directional blood flow velocities. The result-ing traces resembled the temporal and spatial evolution of 3D blood flow in the aortic lumen. Vortex flow was defined as revolving particles around an axis in orthogonal to the vessel centreline (Figure 2A). Helix flow was con-sidered a rotational motion around the longitudinal axis of the vessel centreline (i.e. the physiologic flow direction) creating a corkscrew-like flow pattern (Figure 2B).
AAo [7]. Helix and vortex severity were graded in a blinded fashion by two independent observers using a three point grading-scale: 0, small helix/vortex formation (flow rotation <180°); 1, moderate supra-physiologic-helix/ vortex (flow rotation <360°); 2, pronounced supra-physio-logic-helix/vortex (flow rotation >360°). For helix flow, the direction of flow rotation (right- or left-handed, when viewed orthogonally to the vessel axis in the direction of blood flow) was noted. For each detected vortex flow pat-tern it was noted whether the vortex filled the aortic lumen partly or fully.
Flow velocity and wall shear stress quantification
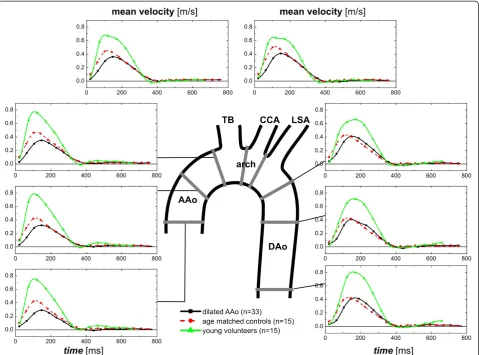
[image:3.595.58.288.89.549.2]We used the reconstructed 3D PC-MRA to manually position eight analysis planes at defined anatomical land-marks in the thoracic aorta at the following positions as illustrated in Figure 1. Plane numbers 1 and 3: at the aforementioned locations. Plane 2: on the half way be-tween plane 1 and 3. Plane 4: bebe-tween the origins of the brachiocephalic trunk and left common carotid artery. Plane 5: between the origins of the left common carotid and left subclavian arteries. Plane 6: in the proximal des-cending aorta. Plane 7: at the level of plane 1 and plane 8 in the distal descending aorta. Plane 1, 3 and 6 were simultaneously used for flow visualization and quantifi-cation. The aortic lumen contours were manually deli-neated for each analysis plane, on all time-frames using a home-built tool programmed in Matlab (Matlab, The Mathworks, USA). We calculated velocity-time curves,
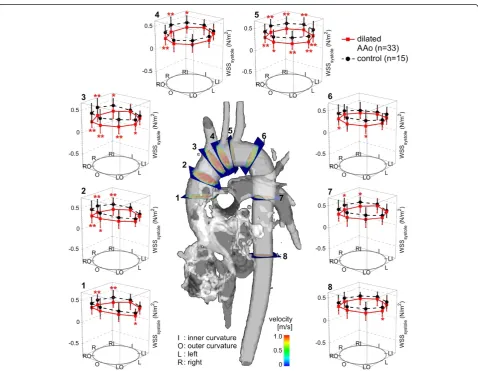
[image:3.595.302.536.89.437.2]Figure 2Vortex and supra-physiologic-helix flow.Early (left column) and late (right column) systolic time-resolved particle traces show the formation of a large flow vortex encompassing the entire AAo (A, white arrows, grading = 1.5) in an aneurysm patient (AAo diameter = 41 mm).B: Development of supra-physiologic-helix flow (yellow arrows, grading=2) in the ascending (diameter=48 mm) and descending aorta in another aneurysm patient (gray arrows).
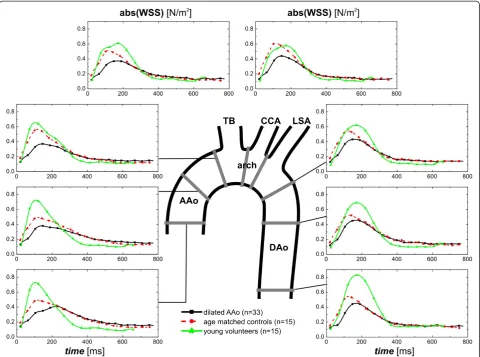
peak systolic velocity (cm/sec), time-to-peak (TTP) sys-tolic velocity (msec), and retrograde flow (ml/min). Retrograde flow was quantified at the location of the analysis planes. All analyses planes were angulated and positioned perpendicular to the local vessel axis. The wall shear stress (WSS) estimate was based on a direct interpolation of the local velocity derivative on the seg-mented vessel lumen contour using b-splines as described previously [19]. Based on a consistent orienta-tion of the analysis planes, regional time-resolved WSS vectors were mapped onto a standardized 8-quadrant model representing 8 angular segments of the aortic wall: outer and inner curvature, right outer and left outer curvatures, right inner and left inner curvatures and right and left (Figure 3). In addition the time-averaged WSS magnitude and peak systolic WSSsystole magnitude for each analysis plane and each segment, and the oscillatory shear index (OSI), reflecting the degree of
WSS inversion over the cardiac cycle, as previously defined by He and Ku [20], were calculated.
Statistical analysis
[image:4.595.59.538.325.696.2]All statistical analyses were performed using commercially available software (SPSS 17.0; SPSS Inc., Chicago, Ill). Kolmogorov-Smirnov tests were performed to test for equal distribution of continuous variables. Continuous variables were expressed as mean ± standard deviation. Categorical variables were expressed as frequencies and percentages. To detect statistically significant differences between the distributions of the grading between patients and control groups, the Mann–Whitney U test was employed. Continuous variable were compared using an unpaired two-sided t-test. Differences with P<.05 were considered significant. The relationship between ascending aortic diameter and hemodynamics parameters was investigated using correlation analysis based on linear
regression. The regression’s overall quality was assessed using Pearson’s correlation coefficient r. A p value <.05 was considered statistically significant. Interobserver agreement on semi-quantitative grades of helix or vortex formation between the two readers was calculated usingκ statistics. A κ value over 0.81 corresponded to excel-lent interobserver agreement, with values of 0.61–0.80 corresponding to good agreement [21].
Results
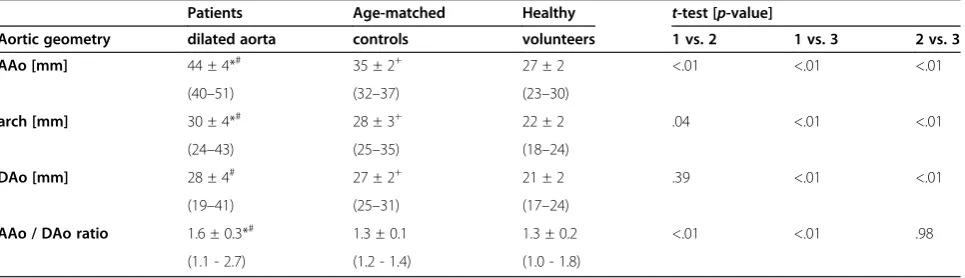
There were no significant differences in mean age (me-dian age 62±15.9 vs. 67±7.5 P=.0966), body mass index (median BMI 26.4±4.2 vs. 26.2±3.4 P=.927), EF (median EF 55±6.6 vs. 60±4.2 P=.155) and heart rate (median heart rate 71±8.8 vs. 65±5.7 P=.161) in the dilated AAo or age-matched controls. The majority of patients with dilated AAo and age matched controls were hypertensive and received blood pressure medication (86% vs.93%). 53% of the patients with dilated AAo and 46% of the age matched controls were hyperlipidemic. The mean AAo diameter as well as the AAo/DAo diameter ratio was sig-nificantly higher in the dilated AAo than in age-matched controls (P<.01) and healthy young volunteers (P<.01). As expected due to the physiological growth of the aorta with time [22], diameters of the AAo, aortic arch and DAo were significantly higher in the age-matched controls than in the healthy volunteers (P<.01), whereas the AAo/DAo diam-eter ratio was not significantly different (P=.9801, Table 1).
Visual grading of blood flow
Particle trace visualization was successfully performed in all volunteers. Inter-observer variability for flow pattern grading was excellent (κ=0.86). Supra-physiologic-helix formation in the ascending aorta was significantly more prevalent in patients with dilated AAo than in age-matched controls and young healthy volunteers (P=.004 and P=.003, Table 2). Vortex flow was noted in the
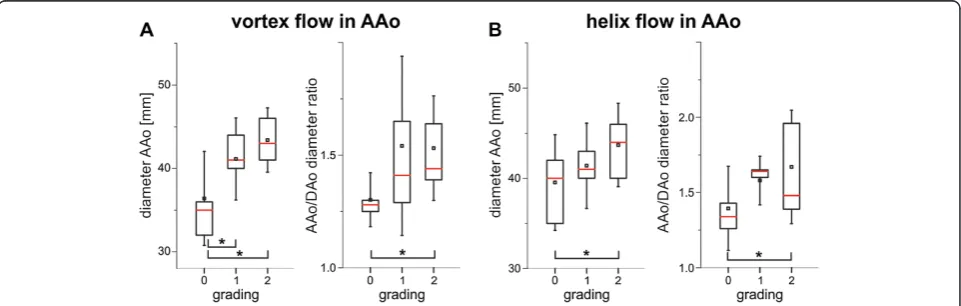
ascending aorta in all but one of the patients with dilated AAo (32/33, 94%) but in less than half of the age-matched controls (7/15, 47%) and not at all in the young healthy volunteers (Figure 2, Table 2). Vortex strength was significantly higher in patients with dilated AAo than in age-matched controls (average grading of 1.5±0.6 vs. 0.6±0.7, p=.004). In all cohorts, supra-physiologic-helix and vortex flow was observed less fre-quently in the aortic arch and descending aorta than in the ascending aorta (Table 2). When present, helix flow was right-handed in all but one patient. In patients with dilated AAo, supra-physiologic-helix and vortex flow was observed simultaneously in 15/33 (45%) in the AAo and in 2/33 (6%) in the aortic arch. Simultaneous occur-rence of vortex and supra-physiologic-helix flow was not seen in age-matched controls or healthy volunteer. Simultaneous occurrence was not present in the DAo in all three cohorts. In both, patients with dilated AAo and age-matched controls presence and strength of the ascending aortic supra-physiologic-helix and vortex for-mation was directly associated with an increase in AAo diameter and AAo/DAo diameter ratio (Figure 4).
Quantifying flow velocity and wall shear stress
Pulsatile mean velocity-time curves and dynamics of WSS magnitude over the cardiac cycle are depicted in Figures 5 and 6 for the eight analysis planes in the thor-acic aorta. For both blood flow velocity and WSS, peak systolic values were reduced and delayed in patients and age matched controls, but not in young healthy volunteers.
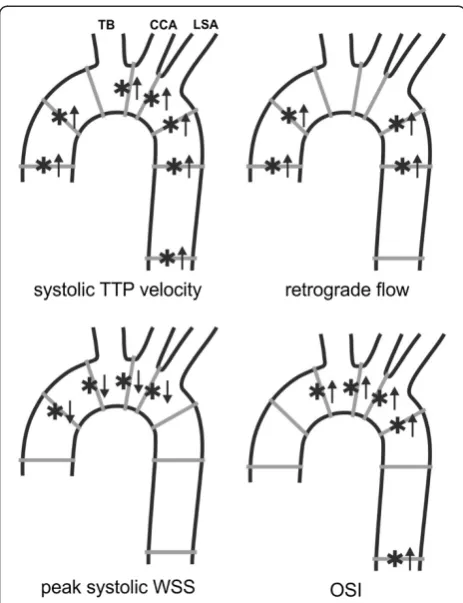
[image:5.595.58.541.560.699.2]Moreover, patients with dilated AAo and age-matched controls demonstrated several significant differences in regional flow velocities and wall parameters as summar-ized in Figure 7 and Table 3. In aneurysm patients, systolic time to peak (TTP) velocity was significantly increased in 7 analyzing planes (P=.0044-.0321) and
Table 1 Aortic geometry in aneurysm patients and control groups
Patients Age-matched Healthy t-test [p-value]
Aortic geometry dilated aorta controls volunteers 1 vs. 2 1 vs. 3 2 vs. 3
AAo [mm] 44 ± 4*# 35 ± 2+ 27 ± 2 <.01 <.01 <.01
(40–51) (32–37) (23–30)
arch [mm] 30 ± 4*# 28 ± 3+ 22 ± 2 .04 <.01 <.01
(24–43) (25–35) (18–24)
DAo [mm] 28 ± 4# 27 ± 2+ 21 ± 2 .39 <.01 <.01
(19–41) (25–31) (17–24)
AAo / DAo ratio 1.6 ± 0.3*# 1.3 ± 0.1 1.3 ± 0.2 <.01 <.01 .98
(1.1 - 2.7) (1.2 - 1.4) (1.0 - 1.8)
retrograde flow was significantly increased in four ana-lyzing planes, when compared to age-matches controls. In addition, peak systolic WSS was significantly decreased in the ascending aorta and entire aortic arch in aneurysm patients compared to the two other cohorts. Conversely, OSI was significantly higher in analogous locations in the thoracic aorta (Figure 7). There was no significant difference in time-averaged WSS magnitude between patients and age-matched con-trols in most of the analysis planes except for plane 5 in the aortic arch. These findings imply a systematic and significant reduction in WSS and an increase in OSI in patients with dilated AAo.
Correlation analysis revealed a weak to moderate yet significant correlation between the degree of aortic dila-tion [cm] and prolonged TTP systolic velocities in all eight analysis planes (r=0.30-0.53,P<.04). Similarly, OSI correlated significantly with AAo diameter in all analysis planes except for the plane in the proximal AAo (r=0.33-0.49, P<.02). In addition, peak systolic WSS demonstrated a weak but significant inverse correlation
with increased AAo diameters in four analysis planes in the ascending aorta and aortic arch (r=0.32-0.40,P<.03).
To detect segmental differences over the lumen cir-cumference, the distribution of wall parameters of each analysis plane of the dilated AAo group and the age-matched controls was evaluated. Figure 3 shows the seg-mental distribution of peak systolic WSS in the entire thoracic aorta in patients with dilated AAo compared to age-matched controls. A significant decrease in regional peak systolic WSS in patients - pronounced in the right-outer curvature in the AAo and proximal arch (planes 1–4) was observed. Differences were less pronounced in the descending aorta (planes 6–8).
Discussion
[image:6.595.55.544.101.210.2]In this study, flow-sensitive 4D CMR was used to visualize different flow patterns in the thoracic aorta of 33 patients with dilated ascending aorta (≥40 mm), 15 age-matched normal controls, and 15 young healthy volunteers. Our aim was to provide insight into altera-tions in blood flow and vessel wall parameters in the
Table 2 Incidence of supra-physiologic-helix and vortex pattern
incidence [n (%)] Helix Vortex flow
grading AAo arch DAo AAo arch DAo
patients, dilated aorta 16 (48%)*# 5 (15%)*# 3 (9%) 31 (94%)*# 4 (12%) 3 (9%)
n=33
age-matched controls 2 (13%) 2 (13%) 2 (13%) 7 (47%)+ 2 (13%) 1 (7%)
n = 15
healthy volunteers 1 (7%) none none none none none
n = 15
Note. -Table2shows the incidence of helix and vortex flow in the AAo (ascending aorta), aortic arch and DAo (descending aorta) of the three study cohorts. *: significant differences (p<.05) between aneurysm patients and age-matched controls.
#: significant differences (p<.05) between aneurysm patients and healthy volunteers. +: significant differences (p<.05) between age matched controls and healthy volunteers.
[image:6.595.58.539.543.696.2]dilated aorta compared to young and age-matched con-trols. In additional to visually grading 3D blood flow pat-terns, we focused on the quantitative analysis of alterations in pulsatile blood flow velocities and wall shear stress known to affect endothelial cell function and thus vessel wall architecture potentially as well [8,9]. Previous investigations with a limited number of patients indicated that blood flow is altered in thoracic aorta aneurysms [11,23,24]. A recently published study [7] investigated blood flow and vessel wall parameters in AAo aneurysms using 4D Flow. In contrast to this study our study analysed all aortic segments (AAo, aortic arch, and DAo and included a larger number of patients. In addition, our study included a comparison of aortic hemodynamics with age matched controls and healthy volunteers.
As demonstrated in previous studies, helix flow in the aorta is a normal physiological phenomenon, moreover it is thought to protect against atherogenesis [18,25]. The
present study demonstrates that the incidence of alterations in blood flow patterns such as the presence of vortex and supra-physiologic helical flow was significantly increased in the setting of the dilated ascending aorta. In addition to ab-solute AAo diameter, the presence and strength of the ascending aortic supra-physiologic-helix and vortex forma-tion in the AAo associated closely with an increase in AAo/ DAo diameter ratio. We speculate that in the dilated aorta the expansion results in a altered pressure gradient which can induce secondary flow patterns (i.e. helix and vortex flow) as observed in our patient cohort.
[image:7.595.59.539.89.444.2]Consistent with the irregular flow patterns observed by visual grading, significant alterations in vessel wall para-meters and blood flow velocities were noted. We observed considerable differences among the three cohorts for both pulsatile velocity-time and WSS-time curves. Although dif-ferences between patients and age-matched controls were less pronounced, statistically significant alterations were detectable at multiple anatomical locations in the thoracic
aorta. Time-to-peak systolic velocities and the extent of retrograde flow were considerably higher in subjects with a dilated aorta, consistent with reduced flow efficiency com-pared to age-matched controls. With respect to vessel wall parameters, peak systolic WSS and OSI exhibited the largest differences among the different cohorts.
It is well known that reduced shear stress induces ves-sel constriction, whereas greater shear stress is followed by dilatation through enhanced endothelial nitric oxide synthase activity to maintain mean arterial WSS balance as long as the endothelial function is intact [9,26-28]. Chronically lowered or oscillatory shear stress activates monocytes, and increases platelet activation, oxidant state, apoptosis and cellular turnover. These changes are fol-lowed by endothelial cell loss and desquamation, lipid ac-cumulation, platelet aggregates; fibrin plugs are diminished in actin stress fibers and proliferation of smooth muscle cells [9,29]. Such changes in vessel wall architecture can re-duce aortic distensibility [6]. These changes of the vessel
wall can lead on the one hand to the initiation and pro-gression of atherosclerosis. AAo aneurysms are associated with increased level of matrix metalloproteinase (MMP) which protects from atherosclerosis [1]. These observa-tions and the pronounced supra-physiologic-helix flow could explain that atherosclerosis is not a feature of AAo aneurysms, although WSS is lowered. On the other hand, there is evidence that cerebral aneurysms in humans de-velop in regions of low WSS [8,30], whereas high WSS may be responsible for initiating aneurysm formation [30]. The findings in our study indicate that the situation for aortic aneurysms may be similar. One explanation could be that the reduced aortic distensibility in AAo aneurysms restricts vasoconstriction of the vessel [6]. However, longitudinal studies correlating changes in WSS with aneurysm progression are needed to support this hypothesis.
[image:8.595.58.539.89.446.2]High OSI has effects similar to low WSS concerning atherogenesis and vessel wall architecture [9], and is also
suspected of playing a role in aneurysm initiation and development.
The decrease in systolic WSS and increase in OSI in patients with dilated AAo observed in this study is well in line with previous studies identifying low WSS and
high OSI as critical wall parameters indicative of vascu-lar remodeling and aneurysm development [8,9,29]. Moreover, the observed blood flow patterns in patients are associated with asymmetric changes in regional peak systolic WSS in the AAo and proximal arch. Notably, significant reductions in regional peak systolic WSS were centered along the right outer aortic wall. Interestingly, the identified location of peak systolic WSS matches the predominant location of intimal tears in aortic dissec-tion [31]. Our findings clearly indicate that peak systolic WSS alterations are inconsistently distributed over the vessel lumen circumference. It is conceivable, that regions with low WSS are predisposed to local vessel wall weakening. Importantly, in patients with dilated AAo vessel wall parameters were not only altered at the level of aortic dilation but also in the vessel segments distal to the dilation, implying that an enlarged AAo influences vessel wall parameters in still-healthy segments.
A limitation of our study is the fact that 3D blood flow visualization with particle traces may be diminished when passing through regions of complex flow or areas with high velocity noise [32,33]. We did not test differ-ent particle seeding schemes. Nevertheless, we believe that emitting particle traces during systole (i.e. high vel-ocity to noise ratio), which were used for helix grading, provide a reliable tool for identifying bulk flow charac-teristics such as increased helix flow using our grading scheme. Additional studies are needed to systematically investigate the influence of seeding patterns, particle density and velocity noise on the number, configuration and lengths of particle traces.
A further draw back ouf our study is related to the data analysis strategy for the characterization of aortic hemodynamics. 3D flow visualization and semi-quantitative grading is more sensitive to observer variability and less robust compared to automated and fully quantitative methods [25,34]. Fully quantitative ranking of flow topolo-gies was not available at the time of the analysis of our data and we think that such tools may have the potential to improve flow pattern detection and analysis robustness. Future studies will benefit from more sophisticated analysis as the tools become more mainstream.
[image:9.595.57.289.87.389.2]Additional limitations of this study are the plane-wise, and not genuine 3D quantification, and the limited spatial and temporal resolution of the MR technique. The aortic root was excluded in this study due to the high movement of the aortic root and proximal aortic bulb over the cardiac cycle. As the analysis planes are in a static position, quantification of flow and particularly WSS was thus deemed unreliable. Software and hard-ware improvements are necessary that allow quantifica-tions of derived wall parameters along the entire aortic lumen and not just of a given analysis plane in a specific
Figure 7Regional differences in flow and wall parameters in patients with dilated ascending aorta (AAo) compared to age-matched controls.Arrows (*↑/*↓) indicate significant increase/ decrease (P<.05). TB=brachiocephalic trunk, CCA=common carotid artery, LSA=left subclavian artery.
Table 3 Differences in regional flow velocities and vessel wall parameters
Plane p-values patients vs. age-matched controls
Systolic TTP Retrograde flow Peak systolic OSI
Velocity (msec) (ml/min) WSS (N/m2) (a.u.)
1 .0044 .0367 .1623 .6837
2 .0173 .0487 .0488 .1190
3 .0541 .0850 .0384 .0341
4 .0123 .0845 .0337 .0430
5 .0126 .0677 .0157 .0070
6 .0086 .0266 .2128 .0184
7 .0322 .0301 .2623 .1101
8 .0221 .1194 .0717 .0187
[image:9.595.56.291.556.708.2]vessel segment. Limited spatial and temporal resolution can lead to underestimation of the genuine WSS magni-tude, as shown previously in studies comparing CMR measurements and WSS derived from computational fluid dynamics (CFD) [35]. Nevertheless, the MR-derived WSS in this study is concordant with results of other studies [36]. Furthermore, WSS was not only assessed in patients with dilated AAo but also in age-matches con-trols, otherwise subject to the same technical bias. Fi-nally, patients were retrospectively selected from a larger cohort and not enrolled prospectively or consecutively, thus subject to selection bias. Follow-up studies of patients and age-matched controls are warranted to evaluate the predictive value of the flow and WSS altera-tions we have detected regarding further dilatation and/ or aneurysm development. The focus of such follow-up studies should be process of aortic dilatation in the patient group so as to identify any correlations between aneurysm development and blood flow and vessel wall parameters alterations.
Conclusions
This study shows that there is a significant relationship between the ascending aorta diameter as well as the ratio of the ascending and descending aorta diameter and the incidence and strength of irregular blood flow. These findings indicate that peak systolic WSS may be a risk factor for aortic dilation in regions with low WSS, however longitudinal studies correlating changes in WSS with aneurysm progression are needed to support this hypothesis. In addition, vessel wall parameters in patients with dilated AAo were altered at the dilation level as well as in the vessel segments distal to the dila-tion, highlighting that an enlarged AAo influences vessel wall parameters in adjacent normal segments.
Competing interests
The authors declare that they have no competing interests.
Authors' contributions
JB: flow visualization, flow quantification, figures, manuscript, flow grading; PB: manuscript, statistics, data evaluation; ZS: flow grading, manuscript; AB: flow quantification, flow data analysis, figures, manuscript; MR: flow visualization, flow quantification, manuscript; JG: flow visualization; AF: study design, manuscript revision; ML: manuscript revision, supervision; MM: study design, flow quantification, flow data analysis, statistics, figures, manuscript revision, supervision. All authors read and approved the final manuscript.
Acknowledgement
Grant support by the National Heart, Lung, And Blood Institute of the National Institutes of Health under Award Number R01HL115828 and the Northwestern Memorial Foundation Dixon Translational Research Grants Initiative (MM).
Author details
1Department of Diagnostic Radiology, Medical Physics, University Hospital,
Freiburg, Germany.2Clinic of Radiology and Nuclear Medicine, University Hospital of Schleswig-Holstein, Campus, Lübeck, Germany.3Departments of
Radiology and Biomedical Engineering, Northwestern University, Chicago, IL, USA.
Received: 8 July 2012 Accepted: 28 November 2012 Published: 13 December 2012
References
1. Elefteriades JA, Farkas EA:Thoracic aortic aneurysm clinically pertinent controversies and uncertainties.J Am Coll Cardiol2010,55:841–57. 2. Isselbacher EM:Thoracic and abdominal aortic aneurysms.Circulation
2005,111:816–28. Review.
3. Davies RR, Goldstein LJ, Coady MA, Tittle SL, Rizzo JA, Kopf GS, Elefteriades JA:Yearly rupture or dissection rates for thoracic aorticaneurysms: simple prediction based on size.Ann Thorac Surg2002,73:17–28. 4. Dapunt OE, Galla JD, Sadeghi AM, Lansman SL, Mezrow CK, de Asla RA,
Quintana C, Wallenstein S, Ergin AM, Griepp RB:The naturalhistory of thoracic aortic aneurysms.J Thorac Cardiovasc Surg1994,107:1323–1332. 5. Poullis MP, Warwick R, Oo A, Poole RJ:Ascending aortic curvatureas an
independent risk factor for type A dissection, and ascendingaortic aneurysm formation: a mathematical model.Eur J CardiothoracSurg2008,
33:995–1001.
6. Koullias G, Modak R, Tranquilli M, Korkolis DP, Barash P, Elefteriades JA:
Mechanical deterioration underlies malignant behavior of aneurysmal human ascending aorta.J Thorac Cardiovasc Surg2005,130:677–83. 7. Bieging ET, Frydrychowicz A, Landgraf BR, Johnson KM, Wieben O, François
CJ:In vivo 3-dimensional magnetic resonance wall shear stress estimation in ascending aortic dilatation.J Man Reson Imaging2011,
33:589–597.
8. Boussel L, Rayz V, McCulloch C, Martin A, Acevedo-Bolton G, Lawton M, Higashida R, Smith WS, Young WL, Saloner D:Aneurysm growth occurs at region of low wall shear stress: patient-specific correlation of hemodynamics and growth in a longitudinal study.Stroke2008,
39:2997–3002.
9. Malek AM, Alper SL, Izumo S:Hemodynamic shear stress and its role in atherosclerosis.JAMA1999,282:2035–2042.
10. Frydrychowicz A, Harloff A, Jung B, Zaitsev M, Weigang E, Bley TA, Langer M, Hennig J, Markl M:Time-resolved, 3-dimensional magnetic resonance flow analysis at 3T: visualization of normal and pathological aortic vascular hemodynamics.J Comput Assist Tomogr2007,31:9–15. 11. Frydrychowicz A, Arnold R, Hirtler D,et al:Multidirectional flow analysis by
cardiovascular magnetic resonance in aneurysm development following repair of aortic coarctation.J Cardiovasc Magn Reson2008,10:30. 12. Harloff A, Nussbaumer A, Bauer S, Stalder AF, Frydrychowicz A, Weiller C,
Hennig J, Markl M:In vivo assessment of wall shear stress in the atherosclerotic aorta using flow-sensitive 4D MRI.Magn Reson Med2010,
63:1529–1536.
13. Harloff A, Simon J, Brendecke S, Assefa D, Helbing T, Frydrychowicz A, Weber J, Olschewski M, Strecker C, Hennig J, Weiller C, Markl M:Complex plaques in the proximal descending aorta an underestimated embolic source of stroke.Stroke2010,41:1145–50.
14. Harloff A, Strecker C, Dudler P, Nussbaumer A, Frydrychowicz A, Olschewski M, Bock J, Stalder AF, Stroh AL, Weiller C, Hennig J, Markl M:Retrograde embolism from the descending aorta: visualization by multidirectional 3D velocity mapping in cryptogenic stroke.Stroke2009,40:1505–8. 15. Markl M, Harloff A, Bley TA, Zaitsev M, Jung B, Weigang E, Langer M, Hennig
J, Frydrychowicz A:Time-resolved 3D MR velocity mapping at 3 T: improved navigator-gated assessment of vascular anatomy and blood flow.J Magn Reson Imaging2007,25:824–831.
16. Bock J, Kreher BW, Hennig J, Markl M:Optimized pre-processing of time-resolved 2D and 3D Phase Contrast MRI data. Berlin, Germany: Proc: ISMRM; 2007:3138.
17. Kilner PJ, Yang GZ, Mohiaddin RH, Firmin DN, Longmore DB:Helical and retrograde secondary flow patterns in the aortic arch studied by three-directional magnetic resonance velocity mapping.Circulation1993,
88:2235–47.
18. Liu X, Pu F, Fan Y, Deng X, Li D, Li S:A numerical study on the flow of blood and the transport of LDL in the human aorta: the physiological significance of the helical flow in the aortic arch.Am J Physiol Heart Circ Physiol2009,297:163–170.
19. Stalder AF, Russe MF, Frydrychowicz A, Bock J, Hennig J, Markl M:
Quantitative 2D and 3D Phase Contrast MRI: Optimized Analysis of Blood Flow and Vessel Wall Parameters.Magn Reson Med2008,
20. He X, Ku DN:Pulsatile flow in the human left coronary artery bifurcation: average conditions.J Biomech Eng1996,118:74–82.
21. Landis JR, Koch GG:An application of hierarchical kappa-type statistics in the assessment of majority agreement among multiple observers. Biometrics1977,33:363–374.
22. Hannuksela M, Lundqvist S, Carlberg B:Thoracic aorta: dilated or not? Scand Cardiovasc J2006,40:175–8.
23. Weigang E, Kari FA, Beyersdorf F, Luehr M, Etz CD, Frydrychowicz A, Harloff A, Markl M:Flow-sensitive four-dimensional magnetic resonance imaging: flow patterns in ascending aortic aneurysms.Eur J Cardiothorac Surg2008,34:11–6.
24. Hope TA, Markl M, Wigström L, Alley MT, Miller DC, Herfkens RJ:
Comparison of flow patterns in ascending aortic aneurysms and volunteers using four-dimensional magnetic resonance velocity mapping.J Man Reson Imaging2007,26:1471–9.
25. Morbiducci U, Ponzini R, Rizzo G, Cadioli M, Esposito Montevecchi FM, Redaelli A:Mechanistic insight into the physiological relevance of helical blood flow in the human aorta: an in vivo study.Biomech Model Mechanobiol2011,10:339–355.
26. Langille BL, O´Donnel F:Reductions in arterial Diameter produces by chronic decreases in blood flow are endothelium-dependent.Science 1986,231:405–7.
27. Ben Driss A, Benessiano J, Poitevin P, Levy BI, Michel JB:Aterial expansive remodelling induced by high flow rates.Am J Physiol1997,272:851–8. 28. Nadaud S, Philippe M, Arnal JF, Michel JB, Soubrier F:Sustained increase in
aortic endothelial nitric oxide synthase expression in vivo in a model of chronic high blood flow.Circ Res1996,79:857–63.
29. Walpola PL, Gotlieb AI, Langille BL:Monocyte adhesion and changes in endothelial cell number, morphology, and F-actin distribution elicited by low shear stress in vivo.Am J Pathol1993,142:1392–400.
30. Meng H, Wang Z, Hoi Y, Gao L, Metaxa E, Swartz DD, Kolega J:Complex hemodynamics at the apex of an arterial bifurcation induces vascular remodeling resembling cerebral aneurysm initiation.Stroke2007,
38:1924–1931.
31. Moon MC, Greenberg RK, Morales JP, Martin Z, Lu Q, Dowdall JF, Hernandez AV:Computed tomography-based anatomic characterization of proximal aortic dissection with consideration for endovascular candidacy.J Vasc Surg2011,53:942–9.
32. Longest PW, Vinchurkar S:Effects of mesh style and grid convergence on particle deposition in bifurcating airway models with comparisons to experimental data.Med Eng Phys2007,29:350–66.
33. Marshall I:Targeted particle tracking in computational models of human carotid bifurcations.J Biomech Eng2011,133:124501.
34. FinnL L, Boghosian BM, Kottke CN:Vortex core identification in viscous hydrodynamics.Philos Transact A Math Phys Eng Sci2005,363:1937–48. 35. Wood NB, Weston SJ, Kilner PJ, Gosman AD, Firmin DN:Combined MR
imaging and CFD simulation of flow in the human descending aorta. J Magn Reson Imaging2001,13:699–713.
36. Markl M, Wallis W, Harloff A:Reproducibility of flow and wall shear stress analysis using flow-sensitive four-dimensional MRI.J Magn Reson Imaging 2011,33:988–994.
doi:10.1186/1532-429X-14-84
Cite this article as:Bürket al.:Evaluation of 3D blood flow patterns and wall shear stress in the normal and dilated thoracic aorta using flow-sensitive 4D CMR.Journal of Cardiovascular Magnetic Resonance2012
14:84.
Submit your next manuscript to BioMed Central and take full advantage of:
• Convenient online submission
• Thorough peer review
• No space constraints or color figure charges
• Immediate publication on acceptance
• Inclusion in PubMed, CAS, Scopus and Google Scholar
• Research which is freely available for redistribution