http://dx.doi.org/10.4236/jssm.2014.73015
Analysis for Scale-Free Network
Characteristics of Logistics Distribution
Network
Xinyu Zhang
Beijing Wuzi University, Beijing, China Email: [email protected]
Received 10 January 2014; revised 11 February 2014; accepted 5 March 2014
Copyright © 2014 by author and Scientific Research Publishing Inc.
This work is licensed under the Creative Commons Attribution International License (CC BY). http://creativecommons.org/licenses/by/4.0/
Abstract
In this paper, we first analyze the evolution of the logistics distribution network gradually from the simple to the complex, mainly based on distribution network and a typical third party logistics enterprise, establishing the relationship among nodes in the network. Calculating logistics dis- tribution network node degree distribution by using MATLAB program, our computational results show that the node degree distribution of power law index meets the characteristics of scale-free network. Based on this feature, we establish model of the distribution of node formation and the client node distribution in the network.
Keywords
Logistics Distribution Network, Scale-Free Network, Node Degree Distribution
1. Introduction
The logistics distribution system is a dynamic non-linear system, including multiple actor, multi-level, multi- function, and multi-target characteristics, subjecting to many random factors. Therefore the optimal solution and satisfactory solution of characteristics which are the features of relevant distribution network, using traditional analytical methods, are currently the most difficult to be obtained. So there is a theoretical and practical signi- ficance in distribution networks based on the theory of complex systems.
distribution network research. Our research would provide a index to understand the evolution of logistics dis- tribution network operating rules and the internal mechanism, contributing an effective theoretical way of logis- tics issues.
2. Related Research Review
In 1999, Barabasi and Albert on the Science article [1] pointed out that many complex networks in the real world are not the rules of the networks but that of scale-free network. They also studied the characteristics of this network [2] [3]. They pointed out the various network has two basic properties of scale-free feature: node growth and preferential attachment [4].
In 2010, Zhang Shuchao and Mu Qing [5] establish a type of variable power rate of scale-free network model. On the basis of the BA model, they join the connection among the existing nodes in system. By simulation analysis, they believed the changing rate of power network model is the scale-free network, the power index between (2, 3). At the same time, they pointed out that BA network is just a special case of the model. Through the analysis of some actual network data, they illustrated the validity and rationality of the network model. They only considered the problems of old produce among nodes, however, other issues on real network were not added into the model.
Gao Yijia [6] described the model of the initial time, growing, and preferred choices based on the theory of complex network and cold chain logistics. They constructed a cold-chain logistics network model based on BA scale-free network, and analyzed the model of statistical characteristics. At last, they found the model of power exponent γ = 3, which means the model of network is scale-free. The improved model is adjustable, and over- come the deficiency of the traditional modeling method. He optimistically analyzed the robustness and tolerance of the network when the model generated, and strengthened the network’s ability to resist random destruction or malicious attacks.
Zhao Guozhi, Wang Xifu, Zhang Zhongyi [7] analyzed the characteristics of complex network of coal logis- tics network. It is concluded that coal logistics is an ongoing evolution of complex network structure. By com- bining the theory of complex network with the actual coal logistics, they discussed the coal logistics network optimistic method based on complex network. Namely 1) they established complex network evolution model based on the coal logistics network, combining coal logistics network formation with process. 2) They re- searched the coal logistics network of the connotation, structure and operation mechanism, and discussed a se- ries of issues such as global optimization of coal logistics network. 3) They studied the basic theory and practic- al methods related to coal logistics network evolution model of complex network-based research.
Li Jing [8] established the analysis method of bridges between logistics network representation and method. Then he analyzed the relationship between internal coordination mechanisms and the local logistics network in- teraction. Ni LingLin [9] analyzed suitable network, and through the perspectives of organization mode and de- livery flow, discussed its spatial organization network and the Chinese express enterprise space organization.
In conclusion, scholars through a variety of methods to prove the probability of node degree distribution is a power law distribution, index r of which is between networks (2, 3), fitting the characteristics of scale-free net- works. At the same time, they modeled and optimized the cold chain logistics network and coal logistics net- work. Although it has the very high applicability and feasibility, still lacks the research of complex logistics subsystems, such as less study of distribution network and the transportation network.
3. Description of Logistics Distribution Network Model
Distribution is a collection of interconnected organization and facility in the process of logistics distribution network. Its ultimate goal is to meet the final customer satisfaction, so as to realize the value of the entire supply chain and strengthen the ability of supply chain. In particular, it includes a number of nodes and the connection among the lines. In the initial distribution network there are only a few suppliers, clients, and a logistics distri- bution center, the connection among them is straightforward. As developing, there will be more suppliers, dis- tribution centers and customers to join the network, through the network of self-organization evolution, forming a complex network of large and complex.
3.1. Model Describes
The node includes suppliers, primary distribution node, secondary distribution node, the client node. Edge is mainly used to express the relationship among the nodes, the more edges connected to the nodes, the more new chances of cooperation with the node. When a new node joins into the network, it does not connect with all the original nodes, but will be preferential to connecting with the most optimistic one, through mastering the infor- mation, selecting the nodes which have more connecting edges. By constantly selecting preferential connection, ultimately it forms a complex network.
3.2. Model Establishes 3.2.1. The Initial State
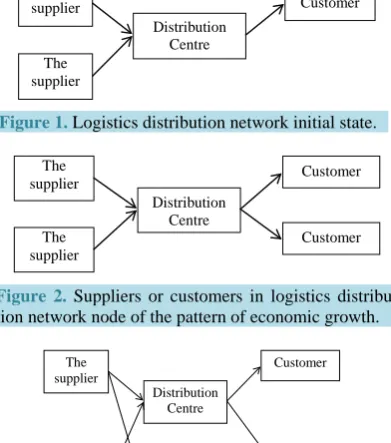
In the initial logistics distribution networks, there are n connected nodes, which have a distribution center, and there are i suppliers and customers. Each node randomly assigned a coordinates (x, y). As shown in Figure 1.
3.2.2. Growth Mode
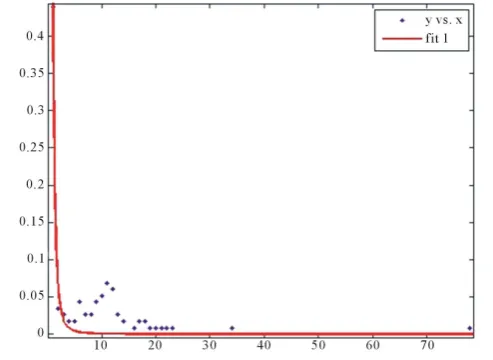
Every time interval T, with probability p to join a supplier or client node, its degree is m (m ≤ i), if it wants to connect with the original distribution center nodes, its new node coordinates is randomly assigned (x1, y1). As shown in Figure 2 and Figure 3.
Every time interval T, with probability 1 − p to join a distribution center node, its degree is m (2 ≤ m ≤ n − i), if it wants to be one of the suppliers and the original nodes to connect with customers, and with at least one sup- plier node is connected with a client, its new node coordinates is randomly assigned (x1, y1).
P is generally greater than 0.5, because the speed of joining node should be less than the speed of the distribu- tion center to join supplier nodes.
4. A Class of Typical Scale-Free Networks Proof of Logistics Distribution Network
Process and Result Analysis
4.1. In the Distribution Network the Relationship between Nodes
In the first place, we record the related names through the research. All the suppliers who have the relationship
The supplier The supplier Distribution Centre Customer
Figure 1. Logistics distribution network initial state.
[image:3.595.214.410.432.654.2]The supplier The supplier Distribution Centre Customer Customer
Figure 2. Suppliers or customers in logistics distribu-tion network node of the pattern of economic growth.
[image:3.595.229.398.603.697.2]Distribution Centre The supplier The supplier Distribution Centre Customer Customer
with a logistics company’s should be recorded. And a logistics company’s primary level of distribution center and secondary distribution center should also be recorded. Based on the records of the relationship among the nodes, all suppliers supply relationship with the primary level of distribution center and record the relationship between them. All primary distribution centers and the secondary distribution centers have a business relation- ship, the relationship between them should be recorded. All secondary distribution center nodes have a business relationship with customers and the relationship between them should be recorded.
4.2. Experimental Data Extraction
When we collect amount of data, we should choose some of this. We will adopt the snowball method sampling part of the data. Snowball method is commonly used in data extraction of social network analysis. This method can be described as the following three steps:
Step 1: choose one or more objects as “initial object”;
Step 2: investigate the “initial object”, in order to find the associated other research object, then be added to the original object in the collection;
Step 3: repeat steps 1 and 2, until there is no new behavior to join;
Repeatedly perform the three steps above, find out all the research objects and the relationship among these objects.
4.3. Compute Node Degree and Degree Distribution
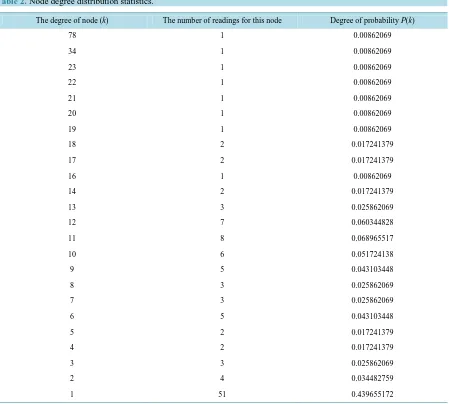
Make the use of the relationship between each two nodes to make relative matrix. For example, suppliers A and primary distribution center A have the relationship in business, or primary distribution center A and the second- ary distribution center B have the relationship in business, or distribution center B and client C have the shipping relationship, matrix in labeled 1, no mark is 0, as shown in Table 1.
Import matrix to the ucinet, the degree of each node is calculated in the ucinet (node number of connections). Statistics all computing nodes degree, are shown in Table 2.
4.4. Analysis on Conformity Degree of Logistics Distribution Networks and Scale-Free Networks
The statistical parameters are according to the scale-free network node degree distribution function.
The probability describes nodes with the same edges is P(k). P k
( )
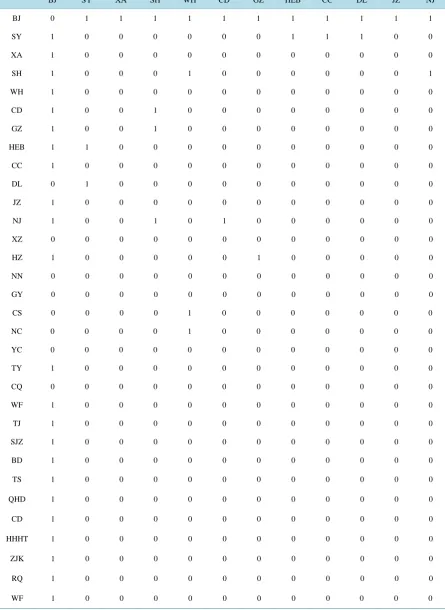
=ck−r, c is constant, k is the node degrees, r is index. When a network node degrees obey index between (2, 3) the power-law distribution, means that the network is scale-free networks. Import Table 2 data into the MATLAB, and calculate logistics network node degree distribution, in order to find whether it follows power-law distribution, draw the coordinate diagram, and calculate the index r. [image:4.595.190.437.528.708.2]After calculation, c = 0.4377, r = 2.913, between 2 - 3 (Figure 4), logistics distribution network node degree
Table 1. Logistics distribution network relation matrix.
BJ SY XA SH WH CD GZ HEB CC DL JZ NJ
BJ 0 1 1 1 1 1 1 1 1 1 1 1
SY 1 0 0 0 0 0 0 1 1 1 0 0
XA 1 0 0 0 0 0 0 0 0 0 0 0
SH 1 0 0 0 1 0 0 0 0 0 0 1
WH 1 0 0 0 0 0 0 0 0 0 0 0
CD 1 0 0 1 0 0 0 0 0 0 0 0
GZ 1 0 0 1 0 0 0 0 0 0 0 0
HEB 1 1 0 0 0 0 0 0 0 0 0 0
CC 1 0 0 0 0 0 0 0 0 0 0 0
DL 0 1 0 0 0 0 0 0 0 0 0 0
JZ 1 0 0 0 0 0 0 0 0 0 0 0
NJ 1 0 0 1 0 1 0 0 0 0 0 0
XZ 0 0 0 0 0 0 0 0 0 0 0 0
HZ 1 0 0 0 0 0 1 0 0 0 0 0
NN 0 0 0 0 0 0 0 0 0 0 0 0
GY 0 0 0 0 0 0 0 0 0 0 0 0
CS 0 0 0 0 1 0 0 0 0 0 0 0
NC 0 0 0 0 1 0 0 0 0 0 0 0
YC 0 0 0 0 0 0 0 0 0 0 0 0
TY 1 0 0 0 0 0 0 0 0 0 0 0
CQ 0 0 0 0 0 0 0 0 0 0 0 0
WF 1 0 0 0 0 0 0 0 0 0 0 0
TJ 1 0 0 0 0 0 0 0 0 0 0 0
SJZ 1 0 0 0 0 0 0 0 0 0 0 0
BD 1 0 0 0 0 0 0 0 0 0 0 0
TS 1 0 0 0 0 0 0 0 0 0 0 0
QHD 1 0 0 0 0 0 0 0 0 0 0 0
CD 1 0 0 0 0 0 0 0 0 0 0 0
HHHT 1 0 0 0 0 0 0 0 0 0 0 0
ZJK 1 0 0 0 0 0 0 0 0 0 0 0
RQ 1 0 0 0 0 0 0 0 0 0 0 0
Table 2. Node degree distribution statistics.
The degree of node (k) The number of readings for this node Degree of probability P(k)
78 1 0.00862069
34 1 0.00862069
23 1 0.00862069
22 1 0.00862069
21 1 0.00862069
20 1 0.00862069
19 1 0.00862069
18 2 0.017241379
17 2 0.017241379
16 1 0.00862069
14 2 0.017241379
13 3 0.025862069
12 7 0.060344828
11 8 0.068965517
10 6 0.051724138
9 5 0.043103448
8 3 0.025862069
7 3 0.025862069
6 5 0.043103448
5 2 0.017241379
4 2 0.017241379
3 3 0.025862069
2 4 0.034482759
1 51 0.439655172
distribution fits the power-law distribution, therefore logistics distribution network fits the characteristics of scale-free networks.
5. Conclusion and Prospect
In this paper, we calculate logistics network node degree distribution using MATLAB program. Through the analysis of the results, we find that the power law index node degree distribution between 2 to 3, which fits the characteristics of scale-free networks. Thus this proves that logistics distribution network accords to the charac- teristics of scale-free networks, in which the third party logistics enterprise are the subjects, which means our research is significant. In logistics distribution network, based on the characteristics of scale-free networks, lo- gistics distribution network customer model can be established. Based on customer generation model, generating distribution node model, thus effectively build a network for primary, secondary and tertiary network and de- termine the intensity of the customer, so that we can effectively manage replication and build process of similar logistics network nodes at all levels.
References
[1] Barabási, A.L. and Albert, R. (1999) Emergence of Scaling in Random Networks. Science, 286, 509-512.
[2] Barabási, A.L., Albert, R. and Jeong, H. (1999) Mean-Field Theory for Scale-Free Random Networks. Physica A, 272, 173-187. http://dx.doi.org/10.1016/S0378-4371(99)00291-5
[3] Barabási, A.L., Albert, R., Jeong, H., et al. (2000) Power-Law Distribution of the World Wideweb. Science, 287, 2115.
http://dx.doi.org/10.1126/science.287.5461.2115a
[4] Albert, R. and Barabási, A.L. (2002) Statistical Mechanics of Complex Networks. Reviews of Modern Physics, 74, 47-98. http://dx.doi.org/10.1103/RevModPhys.74.47
[5] Zhang, S.C. and Mu, Q. (2010) Class of Scale-Free Network Model Is Built and the Power Rate Analysis. Journal of Dalian University of Technology, 50, 811-815.
[6] Gao, Y. (2009) Based on the Cold-Chain Logistics Network Optimization and Application of Complex Network Re- search. China Ocean University, Qingdao.
[7] Zhao, G.Z., Wang, F. and Zhang, Z.Y. (2008) The Complexity of Coal Logistics Network Analysis and Optimization Method Research. Techniques and Approaches, 27, 117-119.
[8] Li, J. and Zhang, Y.G. (2011) The Application of Complex Network Theory in the Logistics Network Research. Chi- na’s Circulation Economy, 5, 78-79.
currently publishing more than 200 open access, online, peer-reviewed journals covering a wide range of academic disciplines. SCIRP serves the worldwide academic communities and contributes to the progress and application of science with its publication.