Pattern based Dimensionality Reduction Model for Age
Classification
V.Vijaya Kumar, Ph.D
Dean-Computer Sciences (CSE &IT), Anurag Group of Institutions, Hyderabad – 500088, A.P., India
Jangala. Sasi Kiran
Research Scholar & Assoc.Professor in CSE Dept, MNR College of Engg. & Tech,
Medak Dt -502294, A.P., India
Gorti Satyanarayana Murty
Research Scholar & Assoc Professor, Aditya institute of Technology and Management,Tekkalli-532 201, A.P., India
ABSTRACT
The two most popular statistical methods used to measure the textural information of images are the Grey Level Co-occurrence Matrix (GLCM) and Texture Units (TU) approaches. The novelty of the present paper is, it combines TU and GLCM features by deriving a new model called “Pattern based Second order Compressed Binary (PSCB) image” to classify human age in to four groups. The proposed PSCB model reduces the given 5 x 5 grey level image into a 2 x 2 binary image, while preserving the significant features of the texture. The proposed method intelligently compressed a 5x5 window into a 2x2 window and derived TU on them. Thus the derived TU also represents a TU of a 5x5 window. The TU of the proposed PSCB model ranges from 0 to 15, thus it overcomes the previous disadvantages in evaluating TU’s.
Keywords
GLCM features; Texture Unit; Pattern; compressed model;
1.
INTRODUCTION
Aging has a significant impact on the appearance of a face [16]. Consequently, face identification or verification can be significantly affected by variations in appearance due to age [17]. Currently, the research related on age estimation using face images is more important than ever, because it has many applications, such as an internet access control, underage cigarette-vending machine use, age-based retrieval of face images, age prediction systems for finding lost children and face recognition robust to age progression. In addition, the estimated age of consumers who look at billboards is used in age specific target advertising as consumer preferences differ greatly by age. To maintain identification/verification performance in the presence of age variation, some researchers have attempted to address this issue classifying the subjects age [18][19]. Unfortunately, age classification itself is very challenging due to the anatomical changes in the cranio-facial region, the bony portion of the head and the overlying soft-tissue caused by the aging progress [20].
Kwon and Lobo (1999) used facial feature detection and wrinkle detection to classify age to the three age groups: babies, young adults and seniors. Ueki et al. (2006) presented a classifier based on two phases using LDA (Linear Discriminant Analysis) and 2D-LDA to classify age. The benefit of their classifier is that it is robust under various lighting conditions. Ueki et al. (2006) experimented by using age ranges of 5 years, 10 years, and 15 years. The respective classification rates for each range were 46.3%, 67.8%, and 78.1%. The studies by Lanitis (2002) and by Lanitis et al. (2004) achieved roughly a 5-year mean error in the experiments where they used face images of people aged
between 0 and 35 years. In the recent past many such classification strategies have been developed [21], [22]. The difficulty in automatic age estimation is mainly due to the specialty of aging effects on the face compared with other facial variations. The unique characteristics of aging variation mainly include: 1. The aging progress is uncontrollable. 2. Personalized aging patterns. 3. The aging patterns are temporal data.
When given a feature, feature classification steps are needed for age estimation. The feature classification can be divided into three approaches: the age group classification [23,24,25,26], the single- level age estimation [27,28,29,30,31] and the hierarchical age estimation [27,32,33]. Age group classification is an approach that roughly predicts an age group, whereas single-level and hierarchical age estimations are focused on detailed age prediction. The single-level age estimation is to find the age label in the total data set. On the other hand, the hierarchical age estimation is a coarse-to-fine method used to find the age label in a pre-classified group’s small data set. As facial aging is perceived differently in different age groups, age estimation in a specific age group provides a more accurate result. Moreover age estimation on a smaller age group simplifies the computational load.
[image:1.595.313.558.573.737.2]2.
PROPOSED METHOD FOR AGE
GROUP CLASSIFICATION OF
FACIAL IMAGES BASED ON GLCM
FEATURES ON TU of PSCB MODEL
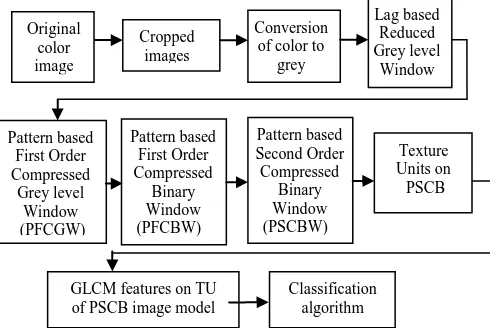
The proposed TU-PSCB model consists of seven steps. The block diagram of the proposed method is shown in Fig.1.Fig. 1: Block diagram of the proposed PSCB image model.
Original color image
Cropped images
Conversion of color to
grey
Pattern based First Order Compressed
Grey level Window (PFCGW)
Pattern based First Order Compressed
Binary Window (PFCBW)
Lag based Reduced Grey level
Window
Pattern based Second Order Compressed
Binary Window (PSCBW)
Texture Units on PSCB
GLCM features on TU of PSCB image model
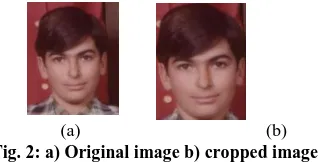
Step 1: The original facial image is cropped based on the location of two eyes in the first step as shown in Fig. 2.
(a) (b)
Fig. 2: a) Original image b) cropped image
Step 2: In the step 2, if the original facial images are color images then those are converted into a grey level facial texture image by using color quantization of 7-bit binary code, as explained below. In order to extract grey level features from colour information, the proposed method utilized the RGB colour space which quantizes the colour space into 7-bins to obtain 128 grey levels. The index matrix of 128 colour image is denoted as C(x, y). The RGB quantization process is done by using 7-bit binary code of 128 colors as given in Eqn. (1.1) to (1.4).
C(x,y)=16*I(R)+2*I(G)+I(B) where (1.1) I(R)= 0, 0≤R≤16, I(R)= i, ((16*i)+1) ≤ R ≤ (16*(i+1))
i = [1, 2, …,7] (1.2) I(G)= 0, 0≤G≤16,I(G)= i,((16*i)+1)≤G≤(16*(i+1)
i=[1, 2,…,6] (1.3) I(B)= 0, 0≤B≤32,I(B)=i,((32*i)+1)≤B≤(32*(i+1)
i=[1, 2, 3] (1.4) Therefore, each value of C(x, y) is a 7 bit binary code ranging from 0 to 127.
Step 3: Generation of Lag based Reduced Grey level Window (LRGW): Consider the 5×5 window of the image. Replace each pixel value by the absolute differences of that pixel value with central pixel value of the 5×5 window. If the absolute difference value is zero then corresponding pixel value is replaced with 2, if the absolute difference value is in between 1 to lag value then corresponding pixel value is replaced with 1 other wise pixel value is replaced with zero. Lag value is chosen as the average value of the central 3 x 3 window of the 5 x 5 window. Apply this on entire image by non overlapping manner. By this the pixel values of entire image will have values either 2 or 1 or 0. This forms the Lag based Reduced Grey level Window (LRGW).
Step4: Derivation of Pattern based First order Compressed Grey level Window (PFCGW): For reducing dimensionality for each 5×5 window, the proposed method adopted conditional pattern based approach. The 5 x 5 LRGW of the step 3 is shown in Fig. 3(a). The pixel values of 5 x 5 LRGW ranges from 0 to 2. The Fig. 3(b) represents the Pattern based First order Compressed Grey level window (PFCGW). The g1, g2, …, g9 pixel values of PFCGW represents the patterns of five horizontal, two diagonals, center vertical line and inner 3×3 window of LRGW, which are derived from the Eqn. (1.5) to (1.13).
Fig. 3: (a) Local 5×5 LRGW (b) generated 3×3 PFCGW (c) generated 3×3 PFCBW.
g1 = v1 + v2 + v3 + v4 + v5 (1.5) g2 = v6 + v7 + v8 + v9 + v10 (1.6) g3 = v11 + v12 + v13 + v14 + v15 (1.7) g4 = v16 + v17, +v18 + v19 + v20 (1.8) g5 = v7 + v8 + v9 + v12 +v13 + v14 + v17 + v18 + v19 (1.9) g6 = v21 + v22 +v23 + v24 + v25 (1.10) g7 = v1 + v7 + v13 + v19 + v25 (1.11) g8 = v5 + v9 + v13 + v17 + v21 (1.12) g9 = v3+ v8 + v13 + v18 + v23 (1.13) By observing the equations of g1, g2, g3, g4, g6, g7, g8 and g9 it is evident that that each of these pixel values can have a maximum value of 10. Further the equation for g5 clearly indicates that g5 can have a maximum value of 18. To convert them in to Pattern based First order Compressed Binary window (PFCBW) a condition is applied as given in Eqn. (1.14) and (1.15). By this the 3 x 3 “PFCGW” is converted in to binary window “PFCBW” as shown in Fig. 3(c).
if gi >= 5 then gi = 1 otherwise gi = 0
for i=1,2,3,4,6,7,8,9 (1.14) if g5>= 9 then g5 = 1 otherwise g5 = 0 (1.15)
Step 5: Generation of PSCBW of 2 x 2 from PFCBW of 3 x 3: The PFCBW of 3 x 3 generated in the previous step consist pixel values only either 0 or 1. This step reduces each of the 3 x 3 sub image of (PFCBW) into “Pattern based Second order Compressed Binary Window (PSCBW)” of 2x2 using the following conditional Eqn. as represented from (1.16) to (1.20) as shown in below Fig. 4.
q1 = b1 + b5 + b7 (1.16) q2 = b3 + b5 + b7 (1.17) q3 = b2 + b5 + b8 (1.18) q4 = b4 + b5 +b6 (1.19) Where if qi >= 2 then qi = 1
otherwise qi = 0 for i = 1 to 4 (1.20)
By observing the equations of q1, q2, q3 and q4 it is evident that that each of these pixel values can have a maximum value of 4. Again to convert those in to Pattern based Second order Compressed Binary Window (PSCBW) of size 2 x 2, a condition is applied as given in equation (1.20). By this the 3 x 3 PFCBW is compressed in to second order binary window of size 2 X 2 without losing significant features. By applying steps 3, 4 and 5 on entire image on a 5x5 non-overlapped window basis, the entire texture image is converted into PSCB image model.
Step 6: Generation of TU on PSCB image model: The proposed method extracted local image information in the form of texture unit on each of the PSCBW. The proposed TU-PSCBW is different from usual texture unit represented in the literature, which is derived only on 3 x 3 windows. The
v1 v2 v3 v4 v5
v6 v7 v8 v9 v10 g1 g2 g3 b1 b2 b3
v11 v12 v13 v14 v15 g4 g5 g6 b4 b5 b6
v16 v17 v18 v19 v20 g7 g8 g9 b7 b8 b9
v21 v22 v23 v24 v25
(a) (b) (c)
q1 q2
q3 q4 b1 b2 b3
[image:2.595.74.233.105.186.2] [image:2.595.326.539.483.593.2]proposed method intelligently compressed a 5x5 window into a 2x2 window and derived TU on them. Thus the derived TU also represents a TU of a 5x5 window. From each 2×2 PSCBW, TU value is calculated by using the Eqn. (1.21). This process is applied on entire image, then the image represents TU of PSCB image model.
3
∑
Power (2, k) * qi i = 1,2,3,4 (1.21) k=0TU of PSCBW consist the values ranging from o to 15 (totally 16) only. There is no unique way to label and order the texture units. To achieve unique way and rotational invariant property, the proposed TU on PSCBW considered the minimum value.
(a) (b) (c) (d) (e)
Fig. 5: Different ways of 2x2 neighborhoods.
The value of the TU changes by the representation of the weights. The TU can be calculated in 4 different ways for a 2 x 2 neighborhood is shown in Fig.5. That is for any 2 x 2 neighborhood one can generate four TU values. The TU value for the Fig. 5(a) in all four directions as represented in Fig. 5(b), 5(c),5(d) and 5(e) is given as 13, 14, 7 and 11 respectively.
The illustration process of generating the TU from original image of size 5 x 5 is shown in Fig. 6.
95 96 97 98 97 1 1 2 1 2
95 96 97 98 97 1 1 2 1 2 1 1 0
195 96 97 97 197 0 1 2 1 0 1 0 1 1 0 7
195 95 96 97 97 0 1 1 2 2 1 1 1 1 1
94 195 86 97 196 1 0 1 2 0
(a) (b) (c) (d) (e)
Fig.6: (a) Original 5 x 5 grey level window (b) a 5 x 5 LRGW
(c) a 3 x 3 PFCBW (d) 2×2 PSCBW (e) TU-PSCBW value.
Step 7: Generation of GLCM features on the derived TU of PSCB image model (PSCBI-TU): Grey Level Co-occurrence Matrix (GLCM) introduced by Haralick [3] attempt to describe texture by statistically sampling how certain grey levels occur in relation to other grey levels. One of the major inconveniences of Co-occurrence Matrix (CM) is the large range of its possible values (256 grey values) at the same time that these values are not correlated. It also requires more computation time. In general, the size of GLCM depends on grey level range of values of the image. To reduce grey values range in image and also to reduce overall dimension of the image, the present paper derived TU on PSCB image model. The PSCB image model reduces the overall dimensionality in to [2M/5 x 2N/5], (Where image size is (M X N)). Further the TU of PSCB image model reduces the overall grey level range from 0 to 15. Therefore the proposed TU-PSCB image is more suitable to evaluate GLCM features.
A set of GLCM features i.e; contrast, homogeneity, and correlation are extracted on the TU of PSCB facial images. They are represented from Eqn. (1.22) to (1.24). The proposed
TU of PSCB image model combines the merits of both statistical and structural information of images and thus represents complete information of the facial image.
Where Pij is the pixel value in position (i,j) of the PSCBW-TU image, N is the number of grey levels in the image,
mean of the image and
variance of the image.
[image:3.595.51.281.239.297.2]
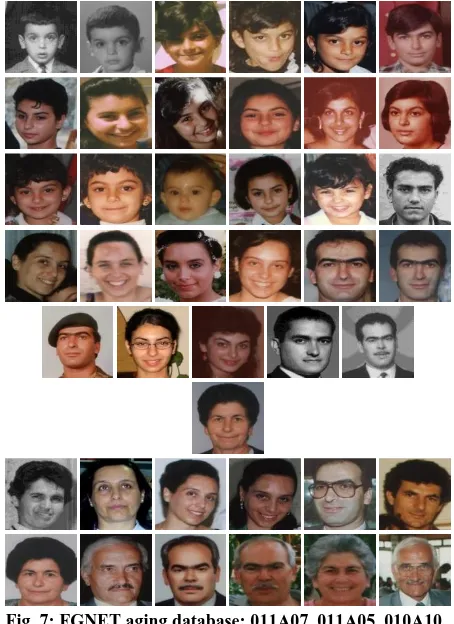
Fig. 7: FGNET aging database: 011A07, 011A05, 010A10, 010A09, 010A07b, 001A14, 019A07, 009A14, 009A13,
009A11, 008A16, 008A13, 010A05, 010A04, 010A01, 009A09, 009A05, 004A21, 002A29, 002A26, 002A23, 002A21, 001A29, 001A28, 001A22, 009A22a, 008A21, 004A28, 004A26, 006A36, 005A40, 011A40, 001A43b, 002A31, 001A33 007A37, 005A52, 005A49, 004A53,
004A51, 048A54 , 006A61, 005A61, 004A63.
3.
RESULTS AND DISCUSSIONS
The proposed GLCM feature on TU of PSCB image model is experimented with a database of the 1002 face images collected from FG-NET database, 500 face images collected from Google database and other 600 images collected from the scanned photographs. This leads a total of 2102 sample facial images. Sample images are shown in Fig.7. In the
1 0 20 21 23 20 22 23 21 22
[image:3.595.315.542.284.596.2]proposed method the sample images are grouped into four age groups of 0 to 15, 16 to 30, 31 to 60, and above 60. The GLCM features are extracted on TU of PSCB facial images of different age groups and the results are stored in the feature database. Feature set leads to representation of the training images. The GLCM features on TU of PSCB image model for four age groups of facial images are shown in Tables 1, 2, 3, and 4 respectively. Based on this information the proposed method derives an algorithm called “age classification based on TU of PSCB model” to efficiently classify the facial images into four groups which is represented in algorithm 1.
Table 1: GLCM feature set values on the derived TU of PSCB facial images with age group from 0 to15 years.
S.No Image
[image:4.595.55.277.223.402.2]Name Contrast Correlation Homogeneity 1 001A02 45.9345313 0.3633283 0.692991371 2 001A05 46.4697197 0.41410471 0.683276235 3 001A08 48.7631203 0.27325552 0.681913713 4 001A10 46.9281193 0.3500283 0.669533747 5 001A14 46.7345313 0.33716873 0.670538852 6 002A03 47.2345276 0.32657822 0.66689456 7 002A04 46.4453113 0.29325552 0.67564327 8 002A05 47.8712528 0.40610471 0.665437864 9 007A01 48.1073522 0.36753456 0.6908765 10 002A07 46.6343513 0.33716873 0.619821713 11 002A12 47.2348731 0.42134567 0.689533747 12 002A15 49.1109823 0.41410471 0.670288672 13 008A06 48.8087656 0.33716873 0.701546378 14 008A12 46.9341354 0.29098765 0.690895642 15 008A13 47.5643872 0.27325552 0.675298624
Table 2: GLCM feature set values on the derived TU of PSCB facial images with age group from 16 to 31 years.
[image:4.595.319.540.366.503.2]S.No Image Name Contrast Correlation Homogeneity 16 001A16 48.3467123 0.28674357 0.614537654 17 001A18 49.2087653 0.2789345 0.63765438 18 001A19 49.109659 0.2995802 0.64650099 19 001A22 48.0728629 0.30173542 0.62490603 20 001A28 48.8278028 0.3146596 0.645582946 21 001A29 47.8896544 0.31235644 0.64975435 22 002A20 48.9876534 0.2987569 0.63215674 23 002A21 46.7798753 0.31316548 0.64856352 24 002A23 49.5075635 0.32657432 0.612865935 25 002A26 47.8974325 0.29858456 0.606546322 26 002A29 48.8889765 0.31087574 0.599856487 27 009A18 47.0876789 0.28087378 0.62452678 28 009A22b 47.3423577 0.31278462 0.598793422 29 011A30 49.0067543 0.28956345 0.64327468 30 011A20 48.0334217 0.31278735 0.59452783
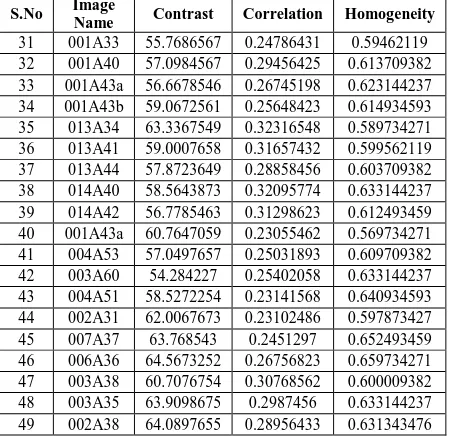
Table 3: GLCM feature set values on the derived TU of PSCB facial images with age group from 31 to 60 years.
S.No Image
Name Contrast Correlation Homogeneity 31 001A33 55.7686567 0.24786431 0.59462119 32 001A40 57.0984567 0.29456425 0.613709382 33 001A43a 56.6678546 0.26745198 0.623144237 34 001A43b 59.0672561 0.25648423 0.614934593 35 013A34 63.3367549 0.32316548 0.589734271 36 013A41 59.0007658 0.31657432 0.599562119 37 013A44 57.8723649 0.28858456 0.603709382 38 014A40 58.5643873 0.32095774 0.633144237 39 014A42 56.7785463 0.31298623 0.612493459 40 001A43a 60.7647059 0.23055462 0.569734271 41 004A53 57.0497657 0.25031893 0.609709382 42 003A60 54.284227 0.25402058 0.633144237 43 004A51 58.5272254 0.23141568 0.640934593 44 002A31 62.0067673 0.23102486 0.597873427 45 007A37 63.768543 0.2451297 0.652493459 46 006A36 64.5673252 0.26756823 0.659734271 47 003A38 60.7076754 0.30768562 0.600009382 48 003A35 63.9098675 0.2987456 0.633144237 49 002A38 64.0897655 0.28956433 0.631343476
Table 4: GLCM feature set values on the derived TU of PSCB facial images with age above 60 years.
S.No Image
Name Contrast Correlation Homogeneity 50 006A69 56.4833941 0.19715349 0.609899042 51 003A62 58.3499219 0.22749949 0.592662009 52 003A61 60.9599167 0.21450343 0.538748375 53 004A53 57.8763249 0.20765466 0.599734271 54 004A62 55.6786567 0.2278658 0.623144237 55 004A63 57.2989567 0.20781567 0.622493459 56 005A61 64.5667752 0.19875742 0.614934593 57 006A61 60.7276754 0.2067146 0.603709382 58 006A67 63.764583 0.18571258 0.641343476 59 004A64 64.5236752 0.1975562 0.609562119 60 004A61 58.5222754 0.16762925 0.613144237
Algorithm 1: Age group classification algorithm based TU of PSCB image model.
Begin
If ((Contrast < 50) and (Homogeneity > 0.65))
Print (“age is in between 0 to 15”); // Childhood Else If ((Contrast < 50) and (Homogeneity < 0.65))
Print (“age is in between 16 to 30”); // young age Else If ((Contrast > 50) and (Correlation >= 0.23))
Print (“age is in between 31 to 60”); // middle age Else If ((Contrast > 50) and (Correlation < 0.23))
Print (“age is above 60”); // old age End
[image:4.595.53.281.440.621.2]0.00% 20.00% 40.00% 60.00% 80.00%
100.00% Geometric
[image:5.595.314.535.71.191.2]feature based age classification system Image-based age-group classification method
Table 5: Age classification table with GLCM feature of test data on the proposed PSCBW-TU model.
S. No
Image
Name Contrast
Correlati
on Homogeneity
[image:5.595.47.287.105.549.2]Classified age group 1 001A08 46.5311 0.29553561 0.67564327 0-15 2 002A18 47.8897 0.31235644 0.64975435 16-30 3 003A20 48.8977 0.2957869 0.6327644 16-30 4 005A24 47.9646 0.33215644 0.649457135 16-30 5 063A05 49.8923 0.40715664 0.674823881 0-15 6 064A16 47.9997 0.35321644 0.64579435 16-30 7 064A59 56.7855 0.26345314 0.623763 31-60 8 065A03 49.8226 0.41665362 0.672384881 0-15 9 067A18 47.9654 0.31675325 0.645435 16-30 10 022A28 48.6534 0.29231876 0.635612574 16-30 11 023A29 47.4332 0.36542836 0.62316735 16-30 12 024A30 48.3425 0.29324569 0.63215674 16-30 13 025A48 56.7855 0.261976 0.623134763 31-60 14 027A30 56.6662 0.26564276 0.6144237 31-60 15 017A62 63.8302 0.1864355 0.634216756 >60 16 018A34 59.0008 0.31632 0.59900772 31-60 17 020A36 57.2786 0.29990846 0.590709382 31-60 18 025A59 58.5644 0.32095774 0.633144237 31-60 19 Sci-1 48.7677 0.2723561 0.681914493 0-15 20 Sci-2 57.4654 0.30000908 0.600040938 31-60 21 Sci-3 47.5644 0.31453288 0.649967535 16-30 22 Sci-4 57.7666 0.25423498 0.627334763 31-60 23 Sci-5 56.6233 0.26745198 0.623144237 31-60 24 Sci-6 47.3745 0.30345644 0.644328675 16-30 25 Sci-7 48.5342 0.30987569 0.635327854 16-30 26 Sci-8 47.1238 0.30564336 0.634253674 16-30 27 20-2 48.3421 0.29651239 0.643215674 16-30 28 25-1 60.0008 0.32557432 0.599562231 31-60 29 25-2 58.9077 0.28856 0.600739382 31-60 30 25-3 58.5644 0.325774 0.613344237 31-60 31 40-6 49.0008 0.30054743 0.599562119 31-60 32 40-1 57.8724 0.28858456 0.673109382 31-60 33 40-2 58.5644 0.32095774 0.633144237 31-60 34 40-3 57.7779 0.26124233 0.689453733 31-60 35 40-4 56.5462 0.2671976 0.687653488 31-60 36 40-5 64.7646 0.18571258 0.641343476 >60 37 35-1 56.8545 0.251976 0.623143348 31-60 38 50-1 56.2318 0.267476 0.637334763 31-60 39 50-2 63.5643 0.2413375 0.631221343 >60 40 50-3 64.8302 0.18125758 0.674563426 >60
Table 6: % age group classification on three datasets by the proposed PSCB image model.
Image Dataset FG-NET database
Google database
Scanned images Childhood (0-15) 100.00% 92.50% 90.00% Young adults (16-31) 97.50% 95.00% 93.00% Middle Adults (31-60) 100.00% 92.50% 92.50% 0ld Adults (> 60) 97.50% 95.00% 93.00%
Fig. 8: % age classification graph of three datasets based on algorithm 1.
4.
COMPARISON WITH OTHER
EXISTING METHODS
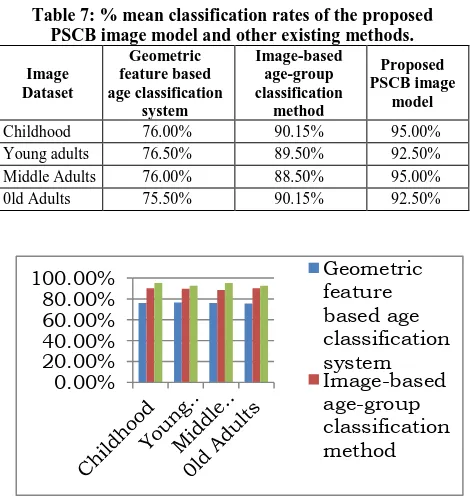
The proposed method is compared with geometric feature based age classification system [1] and imbased age-group classification method [2] methods. The percentage of classification rates of the proposed method and other existing methods [1, 2] are listed in Table 7. The Table 7 clearly indicates that the proposed method yields better classification rate when compared with existing methods.
[image:5.595.312.547.346.595.2]Fig. 9 shows the comparison chart of the proposed method with the other existing methods of Table 7.
Table 7: % mean classification rates of the proposed PSCB image model and other existing methods.
Image Dataset
Geometric feature based age classification
system
Image-based age-group classification
method
Proposed PSCB image
model
Childhood 76.00% 90.15% 95.00%
Young adults 76.50% 89.50% 92.50% Middle Adults 76.00% 88.50% 95.00% 0ld Adults 75.50% 90.15% 92.50%
Fig. 9: Comparison graph of proposed method with other existing methods.
5.
SUMMARY
way to label and order the texture units. To achieve unique way and rotational invariant property, the proposed TU on PSCBW considered the minimum value. In the previous approaches, the TU ranges from 0 to 3561 [4], 0 to 2020 [5, 6, 7, 8], 0 to 255 [10, 11, 12, 13, 14, 15] and 0 to 79 [9]. To overcome this, the proposed model of TU of PSCB image reduced the overall TU’s from 0 to 15. Therefore the proposed TU-PSCB image is more suitable to evaluate GLCM features than the previous approaches. For a precise, significant and accurate classification, the present study evaluated only three GLCM features on the derived TU of PSCB facial images. The present method is also tested for three FG-NET, Google aging database and Scanned images. The performance of the present system is more effective for the FG-NET aging database when compare with Google Images and scanned images. The average recognition rate is 93.33%.
6.
ACKNOWLEDGEMENTS
The authors would like to express their gratitude to Dr. P. Rajeshwar Reddy, Chairman, Anurag Group of Institutions (AGOI), Hyderabad for providing necessary infrastructure for Centre for Advanced Computational Research (CACR) at AGOI, which is bringing various research scholars across the nation to work under one proof. The CACR is providing a research platform for exchanging and discussing various views on different research topics in CSE. Authors extended their gratitude to Managements of MNR College of Engg. & Technology, Sangareddy, A.P. India and Aditya Institute of Technology and Management (AITAM), Tekkali, A.P. India for promoting the young staff members towards research activities.
7.
REFERENCES
[1] Lin-Lin Shen, Zhen Ji, “Modeling Geometric Features for Face Based Age Classification”, Proceedings of the Seventh International Conference on Machine Learning and Cybernetics, Kunming, 12-15 July 2008.
[2] Vi-Wen Chen, Meng-Ju Han and Kai-Tai Song, Yu-LunHo, “Image-Based Age-Group Classification Design Using Facial Features”, International Conference on System Science and Engineering, IEEE 2010.
[3] Haralick RM, Shanmugan K and Dinstein I, "Textural features for image classification," IEEE Trans. Sysr., Man., Cybern., Vol. SMC-3, pp.610-621, 1973.
[4] Wang L., He D.C., “Texture classification using texture spectrum, Pattern Recognition,” vol. 23(8), pp: 905-910, 1990.
[5] Wiselin Jiji G., “Colour texture classification for Human Tissue Images,” Applied Soft Computing, vol. 11, pp: 1623-1630, 2011.
[6] Wiselin Jiji G., Ganesan L., “A new approach for unsupervised segmentation,” Applied Soft Computing, vol.10, pp: 689-693, 2010.
[7] Wiselin Jiji G., Ganesan L., “Comparative analysis of colour models for colour textures based on feature extraction,” Int. Jour. of Soft computing, vol.2 (3), pp: 361-366, 2007.
[8] Aina Barceloa, Eduard Montseny, Pilar Sobrevilla, “Fuzzy texture unit and fuzzy texture spectrum for texture characterization,” Fuzzy Sets and Systems, vol.158 pp: 239-252, 2007.
[9] Sujatha B., VijayaKumar V., Chandra Mohan M., "Rotationally invariant texture classification using LRTM based on fuzzy approach," Int. Journal of Computer Applications (IJCA), vol.33, pp: 1-5, 2011.
[10] Chen C. H., Pau L. F., and Wang P. S. P., “Texture analysis: in Handbook of Pattern Recognition and Computer Vision,” Eds, Singapore: World Scientific, pp. 235-276, 1993.
[11] Dong-Chen He and Li Wang, “Texture feature extraction from texture spectrum,” pp:1987-1990, 1990.
[12] Dong-Chen He And Li Wang, “Texture unit, texture spectrum, and texture analysis,” IEEE Transactions on Geo-science and Remote Sensing, vol.28, pp: 509-512, 1990.
[13] He D.C, Wang L., “Unsupervised textural classification of images using the texture spectrum,” Pattern recognition papers, vol.25 (3), pp: 247-255, 1992.
[14] A.Gunay, V.V.Nabiyev, Automatic age classification with LBP, in: 23rdInterna-National Symposium on Computer and Information Sciences, ISCIS 008 (2008)1– 4.
[15] He D.C., Wang L., and Guibert J., "Texture discrimination based on an optimal utilization of texture features", Pattern Recognition, no 2, pp:141-146, 1988.
[16] Wang L., He D.C., “Texture classification using texture spectrum, Pattern Recognition,” vol. 23(8), pp: 905-910, 1990.
[17] D. Enlow. The handbook of facial growth (2nd ed.). London: W.B. Saunders, 1982.
[18] H. Dehon and S. Bredart. An ‘other-race’ effect in age estimation from faces. Perception, 30(9):1107–1113, 2001.
[19] Y. Fu, G. Guo, and T.S. Huang. Age synthesis and estimation via faces: A survey. IEEE Trans. Pattern Anal. Mach. Intell., 32:1955–1976, November 2010.
[20] C. Shan. Learning local features for age estimation on real-life faces. In Proc. of ACM International Workshop on Multimodal Pervasive Video Analysis, pages 23–28, 2010
[21] M.A. Taister, S.D. Holliday, and H.I.M. Borrman. Comments on facial aging in law enforcement investigation. Foren. Sci. Comm., 2(2):11, 2000.
[22] Y. Bando, T. Kuratate, and T. Nishita, “A Simple Method for Modeling Wrinkles on Human Skin,” Proc. 10th Pacific Conf. Computer Graphics and Applications, pp. 166-175, 2002.
[23] Kwon, Y. H. and da Vitoria Lobo, N.,“Age classification from facial images,” Proc. IEEE Conf. on Computer Vision and Pattern Recognition, Seattle, Washington, U. S. A., pp. 762-767 (1994).
[24] WenBingHorng, ChengPingLee, ChunWenChen, Classification of age groups based on facial features, Tamkang Journal of Science and Engineering4 (3) (2001) 183–192.
Conference on Neural Information Processing (ICONIP 2005)(2005)83–88.
[26] FengGao, HaizhouAi, Face age classification on consumer images with gabor feature and fuzzy LDA method, Lecture Notes in Computer Science, in: Proceedings of the Third International Conference on Advances in Biometrics 5558 (2009)132–141.
[27] Andreas Lenities, Christina Drag nova, Chris Christodoulou, Comparing different classifiers for automatic age estimation, IEEE Transactions on
Systems, Man, and
Cybernetics,PartB:Cybernetics34(1)(2004)621–628.
[28] JinliSuo, TianfuWu, SongchunZhu, ShiguangShan, XilinChen, WenGao, Design sparse features for age estimation using hierarchical face model, in: Proceedings of the Eighth IEEE International Conference on Automatic Face& Gesture Recognition, FG 008. (2008)17–19.
[29] ShuichengYan, HuanWang, XiaoouTang, T.S.Huang, Learning auto-structured regressed from uncertain nonnegative labels, in: IEEE 11th International Conference on Computer Vision, ICCV (2007).
[30] GuodongGuo, YunFu, C.R.Dyer, T.S.Huang, Image-based human age estimation by manifold learning and locally adjusted robust regression, IEEE Transactions on Image Processing17(7)(2008)1178–1188.
[31] Andreas Lanitis, Christopher J.Taylor, TimothyF. Cootes, Toward automatic simulation of aging effects on face images, IEEE Transactions on Pattern Analysis and Machine Intelligence24(4)(2002)442–455.
[32] G.-D.Guo, G.Mu, Y.Fu, C.R.Dyer, T.S.Huang, A study on automatic age estimation using a large Database, In: Proceedings of the IEEE Conference on Computer Vision (ICCV’09)(2009).
[33] KhoaLuu, KarlRicanekJr, TienD.Bui, ChingY.Suen, Age estimation using active appearance models and support vector machine regression, in: Proceedings of the IEEE Third International Conference on Biometrics: Theory, Applications, and Systems (2009)1–5.
8.
AUTHORS PROFILE
Dr. Vakulabharanam Vijaya Kumar is working as Dean- Computer Sciences (CSE & IT) at Anurag Group of Institutions (AGOI), Hyderabad. He received integrated M.S.Engg, in CSE from USSR in 1989. He received his Ph.D.
degree in Computer Science from Jawaharlal Nehru Technological University (JNTU), Hyderabad India in 1998.He has served JNT University for 13 years as Assistant Professor and Associate Professor. He is also the head for Centre for Advanced Computational Research (CACR) at AGOI, Hyderabad where research scholars across the state are working. He has received best researcher and best teacher award. His research interests include Image Processing, Pattern Recognition, Digital Water Marking, Cloud Computing and Image Retrieval Systems. He is the life member of CSI, ISCA, ISTE, IE (I), IETE, ACCS, CRSI, IRS and REDCROSS. He has published more than 120 research publications till now in various National, International conferences, and Journals and guided 14 research scholars for PhD. He has also established and also acted as a Head, Srinivasa Ramanujan Research Forum (SRRF) at GIET, Rajahmundry, India from May 2006 to April 2013 for promoting research and social activities.
J. Sasi Kiran Graduated in B.Tech from JNTU in 2002. He received Masters Degree in M.Tech. from Bharath University, Chennai, in 2005 and pursuing Ph.D from University of Mysore, Mysore in CSE under the guidance of Dr. V. Vijaya Kumar. At present he is pursuing his research at Centre for Advanced Computational Research (CACR) of Anurag Group of Institutions (AGOI), Hyderabad. He served as an Associate Professor in Vidya Vikas Institute of Technology, Hyderabad from 2005 to 2013 and working as Associate Professor in CSE Dept. in MNR College of Engg. & Tech, Sangareddy, Medak Dt, A.P, India. His research interests include Image Processing, Cloud Computing and Image Retrieval Systems. He has published research papers in various National, International conferences, proceedings and Journals. He is a life member of CSI, IE, ISTE, ISC, IAE and management committee member of CSI. He has received significant contribution award from CSI India in 2012.