Munich Personal RePEc Archive
Intergenerational mobility and interraical
inequality:the return to family values
Mason, Patrick
Florida State University
2007
I R, Vol. 46, No. 1 (January 2007). © 2007 Regents of the University of California Published by Blackwell Publishing, Inc., 350 Main Street, Malden, MA 02148, USA, and 9600 Garsington
Road, Oxford, OX4 2DQ, UK.
51 Blackwell Publishing Inc
Malden, USA IREL
Industrial Relations: A Journal of Economy and Society 0019-8676
© 2005 Regents of the University of California 46
1 Original Article Return to Family Values
Patrick L. Mason
Intergenerational Mobility and Interracial
Inequality: The Return to Family Values
PATRICK L. MASON*
This paper investigates two questions. First, what is the relative importance of the components of childhood family environment—parental values versus parental class status—for young adult economic outcomes? Second, are interracial differences in labor market outcomes fully explained by differences in family environment? We find that both family values and family class status affect intergenerational mobility and inter-racial inequality. Consideration of racial differences in parental values and class status alters but does not eliminate the impact of race on the labor market outcomes of young adults.
Introduction
P ⁽“”⁾ - by influencing children’s acquisition of marketable skills. In addition to skill acquisition, parents also transfer to their children behaviors that may directly affect offspring’s labor market performance as young adults. Similarly, parental class status (“socioeconomic status”) affects their off-springs’ acquisition of skill prior to full-time market participation. Also, after the onset of market participation, parental class status offers differen-tial capacity for parents to transfer to their young adult offspring a variety of competitive advantages in the labor market. Accordingly, young adults raised in advantageous family environments will have superior labor market outcomes relative to otherwise identical young adults raised in modest family environments.
Typically, economists capture the residual impact of race on market out-comes by including a race-indicator variable among the set of explanatory variables on the right-hand side of a statistical model. Heretofore, the extant literature has not rigorously explored changes in the statistical significance
52 / P L. M
of residual racial inequality when the statistical model includes extensive measures of family environment among the explanatory variables. If, in fact, there are racial differences in family environment and the components of family environment have a substantively large direct effect on labor market outcomes, then we would expect that including family environment in the statistical model will attenuate residual racial inequality.
This paper seeks to establish the relative importance of race, childhood family behaviors, and childhood class status for determining individual differences in intergenerational mobility. We investigate two questions. First, what is the relative importance of the components of childhood family environment—parental values versus parental class status—for young adult economic outcomes? Second, in labor market outcomes, are interracial dif-ferences fully explained by difdif-ferences in family environment? To answer these questions, we examined the impact of childhood family environment on young adult years of education, annual earnings, hourly wage rates, and annual hours of employment for four race–sex groups: African American women and men, and white women and men.
We found that both childhood family values and childhood family class status affect intergenerational mobility and interracial inequality. However, parental class effects are considerably larger than parental values effects. Consideration of racial differences in parental values and class status alters but does not eliminate the impact of race on the labor market outcomes of young adults. In some instances, consideration of childhood family behaviors tends to accentuate rather than attenuate the impact of race on young adult outcomes. So, differences in childhood family values do affect intergenera-tional mobility but we found no evidence that such differences sharply decrease residual interracial inequality. We are unaware of a previous study that has quantitatively assessed the relative importance of childhood family values and class status on interracial inequality and intergenerational mobility.
Previous Studies
Return to Family Values / 53
Consider the behavioral characteristic called “motivation.” According to Atkinson (1964), individual motivation is a function of individual motives and individual expectancies. It is argued that motives are developed early in childhood and remain stable over an individual’s life cycle. Expectancies may be general or specific; they represent an individual’s assessment that his/her actions will lead to the successful attainment of a desired outcome, for example, employment, education, and earnings. Expectancies then capture an individual’s sense of control over his own life.
Motivation has an effort effect and a skill enhancement effect. The effort effect suggests that motivation may directly increase productivity and, hence, is explicitly valued by employers. Perhaps, more motivated persons are more self-directed and hence require less supervisory time. However, if it takes time for employers to assess individual motivation, it will take time for motivation to affect wages. The skill enhancement effect suggests that motivation may lead individuals to acquire other traits or skills that increase productivity (and are hence valued by employers). This effect also suggests that it takes time for motivation to affect wages. In both cases, motivation is intensified when an action has both an immediate and a future payoff. So if parents believe that their motivation will raise both their own earnings and the earnings of their children, parents’ motivational incentives are intensified.
Nevertheless, until quite recently, there were not definitive results linking individual motivation to individual market outcomes. Using the National Longitudinal Survey, Andrisani (1977) found a statistically significant relationship between hourly earnings and the “internal–external” attitude of men. He claimed that if both black and white men had greater internal attitudes and less external attitudes, then individual initiative and labor market out-comes would increase. Duncan and Morgan (1981) specifically sought to replicate the NLS results with data from the Panel Study on Income Dynamics (PSID). They found that PSID-based expectancy items are not substantially dissimilar to those of the NLS. Both capture the social psy-chology concept of locus of control, i.e., a person’s perceived personal ability to control their own lives. (For an extended discussion, see Duncan and Morgan (1981) as well as Dunifon and Duncan 1998). Nevertheless, among others using the Panel Study on Income Dynamics, Duncan and Morgan and Hill (1985) failed to find strong links between individual motivational measures and individual income 2 to 4 years after the survey measure of motivation.
54 / P L. M
(See also Stellmack Wanberg Kammeyer-mueller 2003 for a recent non-PSID study that found that motivation increases employment and earnings). Dunifon and Duncan found that an increase in personal control (efficacy) by 1 standard deviation raised individual earnings by 14 percent. A one standard deviation increase in preferences for challenge versus affiliation (achievement motivation) raised individual earnings by 7 percent. By com-parison, a one standard deviation increase in education (2.92 years) raised earnings by 16 percent. (A one-year increase in education raised earnings by 6 percent). The incremental R2
from adding education to the background variables (0.08 percentage points) of Dunifon and Duncan’s wage equation is nearly equal to the incremental R2
from adding the two motivational measures. Stronger motivation effects are found in Dunifon and Duncan (1998) because they used a younger sample of men and examined earnings over a longer time span than earlier PSID and NLS studies. Dunifon and Duncan used the average values of motivational variables for 1968–1972. In addition to average hourly wages 16 –20 years after 1972, Dunifon and Duncan also looked at other outcomes: average work hours, fraction of time self-employed, years needed to train for a job, and whether received educational degree.
Similarly, utilizing the PSID, Szekelyi and Tarnos (1993) found significant relationships between motivational variables and economic outcomes when outcomes were measured 21 years after motivational variables were captured by the survey. Szekelyi and Tarnos combined their efficacy and achievement motivation measures with measures of future orientation and trust. They found that this combined expectancy measure is a positive predictor of both future wage levels and wage growth.
Return to Family Values / 55
Goldsmith, Veum, and Darity (1997) showed that high wages produce high self-esteem and that high self-esteem produces high wages. Family environment also has a direct impact on wages and self-esteem. Children from wealthier families, two-parent families, families with more highly educated parents, and more religious families tend to earn higher wages because of the direct effect of these variables on the wage rate and because of the indirect effect of these variables on wages through their positive effect on self-esteem. Goldsmith et al. also found that African American status has a positive impact on self-esteem and that when self-esteem is included in the wage equation, racial inequality increases.
Despite the predictions of motivation theory and some supporting evi-dence thereof, a series of studies contend that racial differences in earnings (and, hence, racial differences in intergenerational mobility) are due to racial differences in “family values,” “culture,” “social capital,” or similar individual behaviors. The causal mechanism arising from this perspective suggests that there is some set of characteristics associated with the behavioral environ-ment of African American families that discourages the acquisition of pro-ductive attributes or that reduces market performance given a particular set of productivity-linked attributes. For example, Neal and Johnson (1996) argue that there are interracial differences in the family characteristics and neighborhoods of workers prior to labor market entry.1
An earlier generation of scholars also argued that persistent racial inequality occurs because of “dysfunctional” behavior of low-income blacks (Loury 1984) and “pathological” black families (Moynihan 1965). This perspective suggests that the labor market skill is relatively lower among African Americans than whites because of relatively lower social capital (market functional values) among African Americans (Loury 1989). Akerlof
1 Interracial differences in measured years of schooling will capture some but not all of these differences. Initially, Neal and Johnson found that the race coefficient in their study (0.14) is not notice-ably different from the race coefficient in most other studies. However, when they use a standardized test score to capture pre-market differences in family and community background, Neal and Johnson found that residual racial inequality among young adult males is reduced to nearly half its usual amount (0.07 log points) and residual racial inequality among women is eliminated. Further, the R2 for the specification including a standardized test score (but not years of education) is lower among women and nearly the same among men than the R2 for the equation including years of education (but not the standardized test score).
56 / P L. M
(2002:427) states that current African American social and economic dis-advantage is due to “self-destructive” behavior. According to Akerlof, inferior African American education—and by extension, reduced intergenerational mobility—is caused by African American identity, which is purely an “oppositional identity” that is opposed to educational achievement because educational achievement is prescriptive behavior associated with white identity. The prescriptions for oppositional identity are commonly defined in terms of “what the dominant culture is not.” Since the prescriptions of the dominant culture endorse “self-fulfillment,” those of the oppositional culture are self-destructive. The identity of the oppositional culture may be easier on the ego, but it is also likely to be economically and physically debilitating (Akerlof 2002:427).
Although Akerlof and Kranton (2002) present evidence from the High School and Beyond national survey that African Americans—especially African American women—have better attitudes toward school than whites, they assert that African Americans only “appear to have better attitudes toward school than whites.” Instead, they argue that standards of ideal behavior differ by race and further insinuate that African American educa-tional ideals are lower than white ideals; hence, from their perspective, survey results that show more positive educational attitudes among African Americans cannot be taken at face value.
Yet, if Bowles’ (1972) contention that the class background of individuals ultimately determines individual wages is correct, racial differences in child-hood family values cannot account for a substantively important fraction of interracial differences in the life chances of young adults.
Model and Hypotheses
Consider the baseline standard equation:
(1)
where Y1i is offspring actual outcome (in this case, young adult annual income,
annual hours of work, years of education, and hourly wage rate); Xni is a
vector of offspring’s observed characteristics, specifically, national region, student status, age, age2
, and years of education (in the income, hours, and hourly wage rate equations); µ1i is an index of offspring’s unobserved
characteristics; and, ε1i is random error.
If race has no impact on young adult life chances, E(β1) = 0 and E(β2) =E(β3).
Y
X
i
ni n i i
n N
1 0 1 2
3 1 1
4
( ) ( )
( ) ,
= + +
+ + + +
=
∑
β β β
β β µ ε
African American male African American female
Return to Family Values / 57
We evaluate this and other hypotheses by examining four specifications of an offspring’s unobserved characteristics.
(a) Parental capacity (V0i) fully determines offspring’s unobserved
characteristics; hence,
µi=f(parental age) + β10Y0i+ρν0i,
where f( . . . ) is a quadratic function, Y0i is actual parental income (or, when
appropriate, education, annual work hours, hourly wage rate), υ0i is an error
term associated with the relationship between observed earnings and earn-ings capacity of the parent and E(υ0i) = 0. This specification of unobserved
characteristics yields the reduced form empirical baseline mobility model (2) (Corak and Heisz 1999; Couch and Dunn 1997; Eide and Showalter 1999).
Y1i=β0+β1(African American male) +β2(African American female) +β3(white female) +β4student +β5age child +β6age child2 +β7education child +β8age parent +β9age parent
2
+β10Y0i+ρν0i+εi, i= 1, . . . , N young adults.
2 (2)
Parental capacity is captured by alternatively combining parental age and parental age2
with actual parental income, parental annual work hours, and parental years of education. This equation is estimated with a Huber-White heteroskedasticity correction.
Equation (3) is our baseline motivation equation. We restrict our measures of family values to the two motivational variables: efficacy and achievement orientation.
(3)
Additionally, to test the Moynihan (1965) and Akerlof–Kranton (2002) hypotheses, we estimate versions of equation (3) where the motivation variables interact with family structure and race, respectively.
2 Using the average value of the explanatory and dependent variables, Couch and Dunn (1997) found that the intergenerational correlation for income ≡r=ρ(D0/D1) = 0.17. If the sample is limited to children ≥25 years of age, then r= 0.31. When the sample is limited to children ≥25 years of age and for parents and children with earnings >0 for all years, then r= 0.52. Finally, they found that r is higher for father-son status transmission than it is for mother–daughter status.
Using a quantile regression approach, Eide and Showalter (1999) found that the empirical results do not change with use of father’s earnings rather than family income. In either case, the parent’s income coefficient is larger for men at the bottom of the distribution than it is for men at the top of the distribution. Also, they found that including child’s years of education reduces the transmission coefficient by 50%; however, the coefficient on education is larger for men at the bottom of the distribution than at the top of the distribution.
Yi
i i i i
i i
1 0 1 2
3 4 5 6 2
7 1 2
1
( ) ( )
( )
.
= ′′ + ′′ + ′′
+ ′′ + ′′ + ′′ + ′′
+ ′′ + ′′ + ′′
+ +
β β β
β β β β
β θ θ
ν ε
58 / P L. M
(b) Childhood family values fully determines offspring’s unobserved characteristics; hence, the values equation is
(4)
The assumption here is that parental behaviors causally determine paren-tal socioeconomic status. The valuesji vector includes the two motivation
variables, plus a host of other measures of parental family behaviors. (c) Parental capacity (V0i) combined with parental class status fully
deter-mines offspring’s unobserved characteristics; hence,
Equation (4) ignores the causal relations that may exist between class and behaviors. It may be the case that parental socioeconomic achievement (failure) encouraged market functional (dysfunctional) behaviors in the childhood homes of young adults. This is expressed in equation (5), which we label the
class equation.
(5)
(d) Parental capacity (V0i) combined with parental behaviors and parental
class status fully determines offspring’s unobserved characteristics; hence,
where “class” and “values” are vectors of variables that describe the parental behaviors and socioeconomic status of the young adult’s childhood home. The components of these vectors are discussed below. Consider then equation (6), which represents the composite specification of the mobility equation. If interracial differences in family environment are solely responsible for reducing African American mobility, then we should observe simultaneously for at least one k, for at least one j, and and
.
(6)
Yi
ji
j ji i i
1 0 1 2
3 4 5 6
2 7 1 ( ) ( ) ( ) . = ′′ + ′′ + ′′ + ′′ + ′′ + ′′ + ′′ + ′′ +
∑
′′ + +β β β
β β β β
β θ ν ε
African American male African American female
white female student age child age child
education child values
µi β i αki ki ρνi
k
f Y s
(= parental age) + 10 0 +
∑
clas + 0.Y
Y
i
i k ki ki i i
1 0 1 2
3 4 5
6 7 8
9 10 0 1
( ) ( ) ( ) = ′ + ′ + ′ + ′ + ′ + ′ + ′ + ′ + ′ + ′ + ′ +
∑
′ + +β β β
β β β
β β β
β β α ν ε
African American male African American female white female student age child
age child education child age parent
age parent class
2
2
+ ′ρ ν0i.
µi β i αki ki θji ji ρν
j i
k
f Y s
(= parental age) + 10 0 +
∑
clas +∑
values + 0,αk
+ ≠
0 θj
+ ≠
0 β1 0
+ =
β2+ −β3+ =0
Y
Y
i
i k ki ki j ji ji
1 0 1 2
3 4 5 6 2
7 8 9
10 0 ( ) ( ) ( ) = + + + + + + + + + + + + + + + + + + + + + + + + +
∑
∑
β β β
β β β β
β β β
β α θ
African American male African American female white female student age child age child education child age parent age parent
class values
2
+
Return to Family Values / 59
where j = 1, . . . , J and k = 1, . . . , K capture the class background and family values of the home environments where young adults were reared.
We use equations (1) to (6) to ascertain the relative effects of race and family environment on intergenerational mobility. A similar empirical strategy has been employed in a number of recent articles on intergenerational mobility (Bowles, Gintis, and Oborn 2000; Painter and Levine 2002; and Levine and Mazumder 2002).
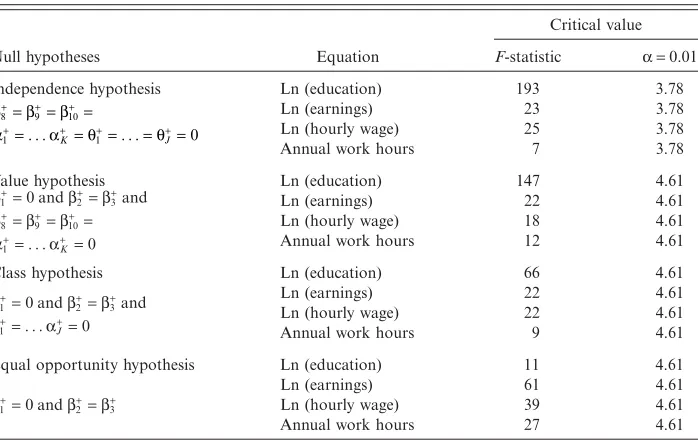
We test several hypotheses.
Independence hypothesis: Young adult market outcomes are independent of childhood family environment. If this is so, the coefficients on paren-tal status and family environment are jointly insignificant, that is,
Values hypotheses: Interracial differences in the transmission of socioeco-nomic status are the result of interracial differences in family behaviors. Hence, parental status is only a proxy for parental behaviors that affect intergenerational mobility. Accordingly, and and
Class hypotheses: Interracial differences in the transmission of socioeconomic status are solely the result of interracial differences in family socioeconomic status. Family behaviors are only proxies for the impact of parental class status on intergenerational mobility. Hence, and and
.
Equal opportunity hypothesis: Interracial differences in intergenerational mobility are solely the result in interracial differences in family environ-ment, not discrimination; hence, and .
Moynihan hypothesis: Moynihan (1965) argued that African American families are “pathological” because they are disproportionately “matriarchal” in a society that is strongly patriarchal. This argument assumes that family structure and family functioning are not separable. If the Moynihan assertion is correct, mother headship should have a negative effect on educational attainment and labor market outcomes, regardless of race.
Akerlof–Kranton hypothesis: Akerlof and Kranton (2002) believe that although African Americans’ self-reported attitudes regarding schooling, self-esteem, and personal values are frequently higher than the self-reported attitudes of white youth, the self-reported attitudes of African Americans reflect a lower ideal standard than the self-report attitudes of white youth. A necessary condition for accepting the Akerlof–Kranton hypothesis is that the coefficients on the race-efficacy and race-achievement orientation variables should be negative.
β8+ =β9+ =β10+ =α1+ . . . = α+k =θ1+ . . . = =θJ+ .=0
β1+ =0 β2+ =β3+
β8+ =β9+ =β10+ =α1+ . . . = α+k .=0
β1 0
+ =
β2 β3
+ +
=
θ1+ . . . = =θ+J =0
β1 0
+ =
β2 β3 0
+ +
− =
60 / P L. M
Data
The family environment variables were extracted from the 1968 –1972 waves of the PSID. The head of household is the respondent for each question. Using the family and personal identity numbers, the 1968 –1972 parental family values were matched to each year of the 1983 –1993 young adult outcomes. We restricted the sample to persons 6 –17 years of age in 1972. We then observed the outcomes of each person as the cohort moved from 17–28 years of age in 1983 to 27–38 years of age in 1993. For all regressions, observations on young adults with missing values for years of education or missing values for the dependent variable were deleted from the sample.
Permanent income measures are more reliable indicators of family status than single-year measure; hence, family income and the annual hours of work of the head of household are five-year averages for 1968–1972. If an individual was not in the sample for all five years, we averaged income and hours over the available years. Our primary measures of family values are efficacy and achievement orientation—the same measures of motivation used by Dunifon and Duncan (1998) and Szekelyi and Tarnos (1993). The questions used to construct the efficacy index were asked each year from 1968 to 1972; hence, the efficacy index is averaged so as to yield a permanent income equivalent. Questions related to the achievement orientation index were asked only during the 1972 wave. Our measures of family values are wholly exogenous to the offspring’s income and employment as a young adult; thereby, our statistical design avoids endogeneity problems that may have plagued earlier studies seeking to evaluate the impact of family values. To the extent that childrens’ behavioral attributes are formed in childhood and do not change dramatically into adulthood, parental behaviors will be correlated with young adult outcomes.
In order to construct the efficacy index, the PSID allowed the family to receive 1 point for each affirmative response to the following six questions.
Sure life would work out? Plans life ahead?
Gets to carry out things? Finishes things?
Rather save for future?
Thinks about things that might happen in future?
Return to Family Values / 61
Would quit job if no longer challenging? Rather have child be leader than popular?
Rather have child be leader than do work teacher expects? Rather do better at what try rather than have more friends?
Rather do better at what try than have others listen to your point of view? Rather have job where think for self than work with nice group?
Rather have job where think for self than have say in what goes on? Rather hear that opinion of self carried weight than people would like living next door to him?
Rather hear others say he can do what he sets his mind on doing than other people like him?
Rather hear others say about self that others go to him for important advice than is fun at party?
Does not get upset at all when taking tests? Heartbeat normal when took tests?
Did not worry about failure when took tests? Did not perspire when taking important tests?
Would want to know more about tests if did well on them? Would think more about future tests if told doing well on test?
Our most extensive regressions also used similarly constructed indices for a series of additional family values. For the 1968 –1972 head of household, these additional indices include: (1) a binary indicator of whether an indi-vidual would like help parents or other relatives (more) if he had more money; (2) trust or hostility; (3) aspiration-ambition; (4) real earnings acts; (5) economizing behavior; (6) risk avoidance; (7) planning horizon; (8) con-nectedness to potential sources of help; and (9) current money earning behavior. In each case, we utilized a five-year average. (Institute for Social Research 1972 provides details on the precise wording of each question that is used as a component of this expanded set of family values).
62 / P L. M
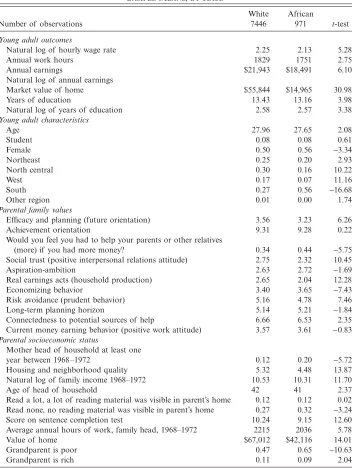
TABLE 1 S M, R
Number of observations
White 7446
African
971 t-test
Young adult outcomes
Natural log of hourly wage rate 2.25 2.13 5.28
Annual work hours 1829 1751 2.75
Annual earnings $21,943 $18,491 6.10
Natural log of annual earnings
Market value of home $55,844 $14,965 30.98
Years of education 13.43 13.16 3.98
Natural log of years of education 2.58 2.57 3.38
Young adult characteristics
Age 27.96 27.65 2.08
Student 0.08 0.08 0.61
Female 0.50 0.56 −3.34
Northeast 0.25 0.20 2.93
North central 0.30 0.16 10.22
West 0.17 0.07 11.16
South 0.27 0.56 −16.68
Other region 0.01 0.00 1.74
Parental family values
Efficacy and planning (future orientation) 3.56 3.23 6.26
Achievement orientation 9.31 9.28 0.22
Would you feel you had to help your parents or other relatives
(more) if you had more money? 0.34 0.44 −5.75 Social trust (positive interpersonal relations attitude) 2.75 2.32 10.45
Aspiration-ambition 2.63 2.72 −1.69
Real earnings acts (household production) 2.65 2.04 12.28
Economizing behavior 3.40 3.65 −7.43
Risk avoidance (prudent behavior) 5.16 4.78 7.46 Long-term planning horizon 5.14 5.21 −1.84 Connectedness to potential sources of help 6.66 6.53 2.35 Current money earning behavior (positive work attitude) 3.57 3.61 −0.83
Parental socioeconomic status
Mother head of household at least one
year between 1968 –1972 0.12 0.20 −5.72 Housing and neighborhood quality 5.32 4.48 13.87 Natural log of family income 1968–1972 10.53 10.31 11.70
Age of head of household 42 41 2.37
Read a lot, a lot of reading material was visible in parent’s home 0.12 0.12 0.02 Read none, no reading material was visible in parent’s home 0.27 0.32 −3.24 Score on sentence completion test 10.24 9.15 12.60 Average annual hours of work, family head, 1968–1972 2215 2036 5.78
Value of home $67,012 $42,116 14.01
Grandparent is poor 0.47 0.65 −10.63
Return to Family Values / 63
By construction, racial sub-groups within this sample of young adults have identical years of potential work experience (as captured by age) and very similar years of education. Table 1 shows that the racial difference in years of education is quite small, the white—African American differential is 0.27 years. Despite racial equality in potential years of experience and near equality in years of education, there are large differences in earnings, work hours, and hourly wages for these young adults. Mean white earnings exceed mean African American earnings by 19 percent. Whites average nearly 2 weeks more annual employment (racial gap of 78 hours) and have a 13 percent higher hourly wage rate.
There is a small but statistically significant racial difference in efficacy and a small but not statistically significant racial difference in achievement orientation. Despite the small racial gaps in our motivation variables, we cannot immediately conclude that racial differences in family values, espe-cially motivation, are not an important source of racial inequality in young adult outcomes. First, if there is a large rate of return to motivation, then small differences in motivation may translate into large income differences or large differences in acquired years of education. Second, per Akerlof and Kranton (2002), the small racial gap in family behaviors may be more apparent than real if African Americans have lower ideals than whites.
Among the ten remaining family behaviors, the racial gap in family values does not uniformly favor a particular group. Mostly, the racial differences are small but there are two exceptions. Whites are considerably more risk adverse than African Americans while African Americans are 10 percentage points more likely to feel a need to assist family members. The descriptive statistics are weighted for the probability of inclusion the sample. Also, in all of the regres-sions, except in Table 1, each family value is divided by its standard deviation. The class background of whites exhibits greater family income, greater family wealth, higher status neighborhoods, and higher quality and quantity of parental education relative to the class background of African Americans. For example, the typical African American was raised in a family with annual income of $30,016. The typical white was raised in a family with annual income of $37,589. Regardless of race, a substantial fraction of individuals in the sample claimed they had poor grandparents. The housing and neigh-borhood quality and sentence completion test score are available only for 1972. In all regressions, except in Table 1, the latter two variables are divided by their respective standard deviations.
64 / P L. M
grandparents. “Rich” and “poor” are indicators that vary with an individual’s comparison group; hence, there may be racial differences in the comparable units. One thousand nine hundred seventy-two heads of household (parents of young adults) answered questions related to the backgrounds of parents and grandparents. Head status in the PSID is limited to men, unless a woman is unmarried. Hence, responses related to maternal grandparents may contain some measurement error since the most likely respondent was the young adult’s father. Furthermore, parental family values indices are frequently constructed from very subjective questions; hence, it is also pos-sible that the numerical responses are not in comparable units across racial groups. We address both these potential sources of measurement error by considering multiple extensions of our baseline models.
Results
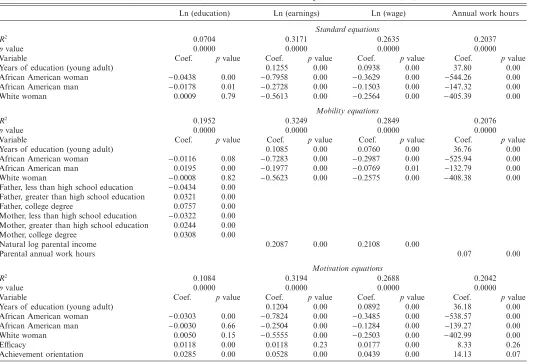
Table 2 presents the baseline standard, mobility, and motivation equations. Without adjusting for family values and parental status, African American women obtain 4 percent less education than white males, 80 percent lower earnings, and 544 fewer annual work hours.3
The African American female– white male hourly wage differential is 0.36 log points. Similarly, when we do not adjust for family values and parental status, African American men obtain nearly 2 percent less education than white males, 27 percent lower earnings, and 147 fewer annual work hours. The African American male– white male wage differential is more than 0.15 log points.
Family socioeconomic status, as measured by 1968 –1972 heads of house-hold status, has large effects on the life chances of individuals. The inter-generational effects of parental status greatly exceed the interinter-generational effects of parental behaviors, and parental status also has larger effects (than motivation) on the absolute values of the race coefficients. The explanatory impact of parental education on young adult education is three times as large as the effect of motivation, with the R2
rising from 0.07 to 0.19. When both parents have a college degree, a young adult obtains 11 percent more years of education than an otherwise identical young adult whose parents have only a high school diploma. If both parents are high school dropouts, the young adult will obtain 8 percent fewer years of education. The elasticity of both young adult earnings and hourly wages with respect to parental income is 21 percent. There are an additional 7 hours of young adult annual
R
eturn to F
amil
y V
alues
/6
[image:16.702.101.640.80.442.2]5
TABLE 2
I M I I: B R
Ln (education) Ln (earnings) Ln (wage) Annual work hours
Standard equations
R2 0.0704 0.3171 0.2635 0.2037
p value 0.0000 0.0000 0.0000 0.0000
Variable Coef. p value Coef. p value Coef. p value Coef. p value Years of education (young adult) 0.1255 0.00 0.0938 0.00 37.80 0.00 African American woman −0.0438 0.00 −0.7958 0.00 −0.3629 0.00 −544.26 0.00 African American man −0.0178 0.01 −0.2728 0.00 −0.1503 0.00 −147.32 0.00 White woman 0.0009 0.79 −0.5613 0.00 −0.2564 0.00 −405.39 0.00
Mobility equations
R2 0.1952 0.3249 0.2849 0.2076
p value 0.0000 0.0000 0.0000 0.0000
Variable Coef. p value Coef. p value Coef. p value Coef. p value Years of education (young adult) 0.1085 0.00 0.0760 0.00 36.76 0.00 African American woman −0.0116 0.08 −0.7283 0.00 −0.2987 0.00 −525.94 0.00 African American man 0.0195 0.00 −0.1977 0.00 −0.0769 0.01 −132.79 0.00 White woman −0.0008 0.82 −0.5623 0.00 −0.2575 0.00 −408.38 0.00 Father, less than high school education −0.0434 0.00
Father, greater than high school education 0.0321 0.00 Father, college degree 0.0757 0.00 Mother, less than high school education −0.0322 0.00 Mother, greater than high school education 0.0244 0.00 Mother, college degree 0.0308 0.00
Natural log parental income 0.2087 0.00 0.2108 0.00
Parental annual work hours 0.07 0.00
Motivation equations
R2 0.1084 0.3194 0.2688 0.2042
p value 0.0000 0.0000 0.0000 0.0000
Variable Coef. p value Coef. p value Coef. p value Coef. p value Years of education (young adult) 0.1204 0.00 0.0892 0.00 36.18 0.00 African American woman −0.0303 0.00 −0.7824 0.00 −0.3485 0.00 −538.57 0.00 African American man −0.0030 0.66 −0.2504 0.00 −0.1284 0.00 −139.27 0.00 White woman 0.0050 0.15 −0.5555 0.00 −0.2503 0.00 −402.99 0.00
Efficacy 0.0118 0.00 0.0118 0.23 0.0177 0.00 8.33 0.26
66 / P L. M
employment for an additional 100 hours of employment for the childhood head of household.
After controlling for parental status, the education differential for African American women declines from 4.38 percent to a marginally significant 1.16 percent. The earnings differential declines 7 percentage points to 73 percent lower earnings and there is an 18 hours decline in the annual work hours differential to 526 hours. Controlling for childhood family income, the African American female–white male wage differential is 0.30 log points, 0.06 log points lower than the wage differential when we do not control for child-hood family income.
After controlling for parental education, the education differential for African American men moves from −0.02 log points to 0.02 log points, that is, African American men obtain more years of education than otherwise identical white men. The earnings differential declines 7 percentage points to 20 percent lower earnings and there is a 14 hours decline in the annual work hours differential to 133 hours. Controlling for parental income during childhood, the African American male–white male wage differential is 0.08 log points, roughly half the wage differential when we do not control for an individual’s class background.
Family values, as measured by efficacy and achievement orientation, have sizable effects on the life chances of individuals. The impact of childhood home motivation on young adult education is especially large, with the R2
rising from 0.07 to 0.11. A one standard deviation increase in family moti-vation, that is, a standard deviation of 1 in efficacy combined with a standard deviation of 1 in achievement orientation, will increase education by 4 per-cent, raise earnings by 6.5 perper-cent, yield 22.5 additional annual work hours, and raise the hourly wage rate by 6 percent.
Return to Family Values / 67
for African American young adult men show only modest declines. The earn-ings differential declines two percentage points to 25 percent and there is an 8-hour decline in the annual work hours differential to 139 hours. Controlling for family motivational behaviors during childhood, the African American male–white male wage differential is 0.13 log points, just 0.02 log points lower than the wage differential when we do not control for individual motivation.
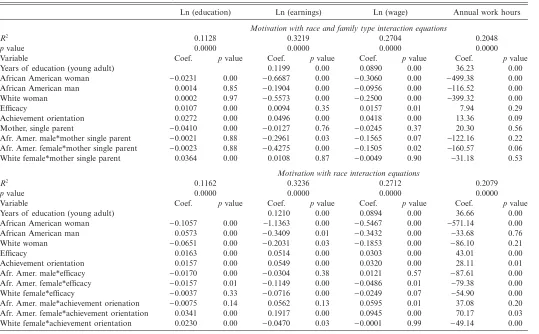
Evaluating the Moynihan and Akerlof-Kranton Hypotheses. Thus far, our results allow us to reject both the independence and values hypotheses. However, we reserve presentation of formal tests of our hypotheses until we have examined extensions of the baseline models. Table 3 includes the first set of extensions. The top panel of regressions presented in this table includes a binary variable that indicates whether or not the young adult was raised in a single parent female-headed household. This indicator variable is also interacted with African American male and female variables. The bottom panel of regressions con-tains interactions between the motivation and racial identity variables.
68
/
P
L. M
[image:19.702.100.639.93.427.2]
TABLE 3
I I: M F T I R
Ln (education) Ln (earnings) Ln (wage) Annual work hours
Motivation with race and family type interaction equations
R2 0.1128 0.3219 0.2704 0.2048
p value 0.0000 0.0000 0.0000 0.0000
Variable Coef. p value Coef. p value Coef. p value Coef. p value Years of education (young adult) 0.1199 0.00 0.0890 0.00 36.23 0.00 African American woman −0.0231 0.00 −0.6687 0.00 −0.3060 0.00 −499.38 0.00 African American man 0.0014 0.85 −0.1904 0.00 −0.0956 0.00 −116.52 0.00 White woman 0.0002 0.97 −0.5573 0.00 −0.2500 0.00 −399.32 0.00
Efficacy 0.0107 0.00 0.0094 0.35 0.0157 0.01 7.94 0.29
Achievement orientation 0.0272 0.00 0.0496 0.00 0.0418 0.00 13.36 0.09 Mother, single parent −0.0410 0.00 −0.0127 0.76 −0.0245 0.37 20.30 0.56 Afr. Amer. male*mother single parent −0.0021 0.88 −0.2961 0.03 −0.1565 0.07 −122.16 0.22 Afr. Amer. female*mother single parent −0.0023 0.88 −0.4275 0.00 −0.1505 0.02 −160.57 0.06 White female*mother single parent 0.0364 0.00 0.0108 0.87 −0.0049 0.90 −31.18 0.53
Motivation with race interaction equations
R2 0.1162 0.3236 0.2712 0.2079
p value 0.0000 0.0000 0.0000 0.0000
Variable Coef. p value Coef. p value Coef. p value Coef. p value Years of education (young adult) 0.1210 0.00 0.0894 0.00 36.66 0.00 African American woman −0.1057 0.00 −1.1363 0.00 −0.5467 0.00 −571.14 0.00 African American man 0.0573 0.00 −0.3409 0.01 −0.3432 0.00 −33.68 0.76 White woman −0.0651 0.00 −0.2031 0.03 −0.1853 0.00 −86.10 0.21
Efficacy 0.0163 0.00 0.0514 0.00 0.0303 0.00 43.01 0.00
Return to Family Values / 69
education and labor market outcomes; hence, it is dropped from further consideration.
The African American male–efficacy interaction term does not yield a consistent qualitative effect. African American male young adults are neither more nor less efficient at transforming a standardized unit of their self-reported efficacy into annual earnings and hourly wages. However, African American males are less able to transform efficacy into years of education (1.70 percent less than white males) and annual work hours (88 hours less than white men).
Young adult African American women are less able to transform efficacy into years of education (1.57 percent less than white men), annual earnings (11.5 percent less than white men), hourly wages (4.86 percent), and annual work hours (79). By comparison, the white female–efficacy interaction term is statistically insignificant in the education equation but it shows that white women are less able than white men to transform efficacy into employment and earnings.
The African American-achievement orientation interaction terms are either positive or statistically insignificant. Relative to white men, a standard unit increase in achievement orientation raises African American female education, earnings, hourly wage, and employment hours by an additional 3.4 percent, 19.2 percent, 9.5 percent, and 70 hours, respectively. Relative to white men, a standard unit increase in achievement orientation raises the African American male hourly wage rate by 6.0 percent. White women obtain 2.3 percent more years of education than white men from a standard unit of achievement orientation, even as they obtain 4.7 percent lower earnings and 47 fewer hours of employment.
Apparently, there are racial and gender differences in the ability to trans-form a standard unit of motivation into employment and earnings, but these differences are not qualitatively identical across race-gender groups. Hence, it is not correct to assume that African American self-reported measures of behavior reflect a lower ideal that white self-reported measures of behavior.
Extended Regressions and Hypothesis Tests
70
/
P
L. M
[image:21.702.102.628.156.372.2]
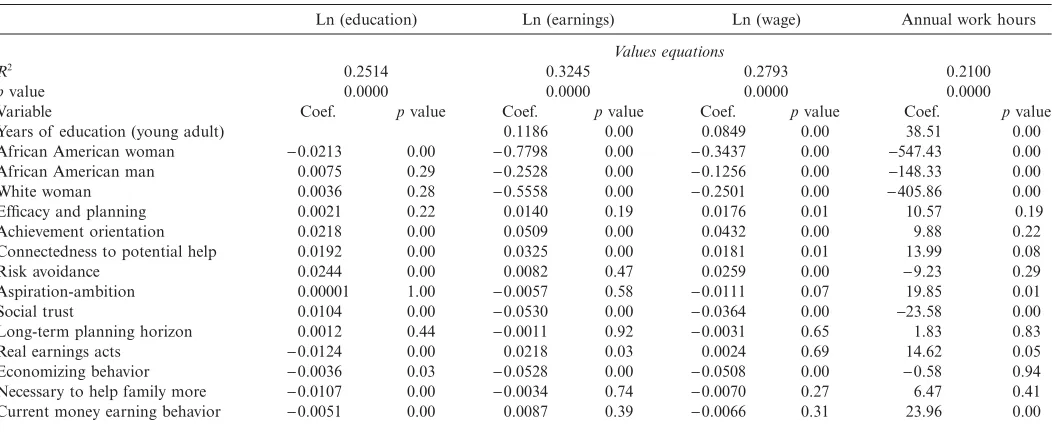
TABLE 4
V C M I M I I V E
Ln (education) Ln (earnings) Ln (wage) Annual work hours
Values equations
R2 0.2514 0.3245 0.2793 0.2100
p value 0.0000 0.0000 0.0000 0.0000
R
eturn to F
amil
y V
alues
/7
1
Class equations
R2 0.2902 0.3282 0.2903 0.2110
p value 0.0000 0.0000 0.0000 0.0000
Variable Coef. p value Coef. p value Coef. p value Coef. p value Constant 1.2745 0.00 0.2024 0.68 −2.4443 0.00 −2435.68 0.00 Years of education (young adult) 0.1097 0.00 0.0740 0.00 40.87 0.00 African American woman 0.0280 0.00 −0.7232 0.00 −0.2865 0.00 −533.95 0.00 African American man 0.0557 0.00 −0.2067 0.00 −0.0769 0.01 −140.75 0.00 White woman −0.0031 0.32 −0.5652 0.00 −0.2620 0.00 −409.82 0.00
Parental annual work hours 0.07 0.00
Father < high school education −0.0338 0.00 Father > high school education 0.0152 0.00 Father, college degree 0.0428 0.00 Mother < high school education −0.0211 0.00 Mother > high school education 0.0168 0.00 Mother, college degree 0.0149 0.01
72
/
P
L. M
[image:23.702.103.629.93.436.2]
TABLE 5
C M I M I I
Ln (education) Ln (earnings) Ln (wage) Annual work hours
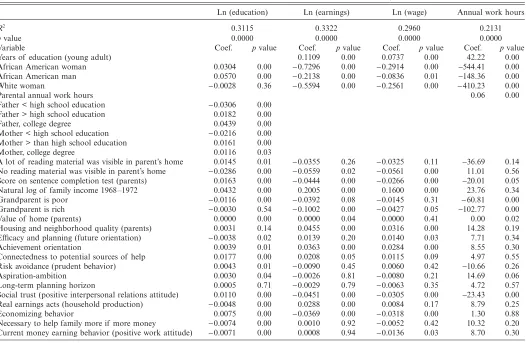
R2 0.3115 0.3322 0.2960 0.2131
p value 0.0000 0.0000 0.0000 0.0000
Variable Coef. p value Coef. p value Coef. p value Coef. p value Years of education (young adult) 0.1109 0.00 0.0737 0.00 42.22 0.00 African American woman 0.0304 0.00 −0.7296 0.00 −0.2914 0.00 −544.41 0.00 African American man 0.0570 0.00 −0.2138 0.00 −0.0836 0.01 −148.36 0.00 White woman −0.0028 0.36 −0.5594 0.00 −0.2561 0.00 −410.23 0.00
Parental annual work hours 0.06 0.00
Father < high school education −0.0306 0.00 Father > high school education 0.0182 0.00 Father, college degree 0.0439 0.00 Mother < high school education −0.0216 0.00 Mother > than high school education 0.0161 0.00 Mother, college degree 0.0116 0.03
Return to Family Values / 73
young adult years of education, annual earnings, annual hours of work, and hourly wage rate. Also, controlling for variation in family environment, that is, the family behaviors and social class status of an individual’s childhood home, does not eliminate the substantive importance of race in determining young adult life chances. We turn now to discuss some of the details of our statistical results.
Educational Attainment
Family behavior has a substantial effect on educational attainment, but less of an impact on employment and earnings. The R2
increases from 7 percent in the standard model to 25 percent in the values model (Table 4). Even so, socioeconomic status during childhood explains a larger portion of the variation in years of education, as the R2
moves from 7 percent to 29 percent in the class equation.
[image:24.486.65.414.99.319.2]The class regressions includes the parental status variable that is directly associated with the young adult outcome as well as an augmented set of variables associated with a family’s socioeconomic status.
TABLE 6
S H T
Null hypotheses Equation
Critical value
F-statistic α = 0.01
Independence hypothesis Ln (education) 193 3.78
Ln (earnings) 23 3.78
Ln (hourly wage) 25 3.78 Annual work hours 7 3.78
Value hypothesis Ln (education) Ln (earnings) Ln (hourly wage) Annual work hours
147 22 18 12 4.61 4.61 4.61 4.61
Class hypothesis Ln (education) 66 4.61
Ln (earnings) 22 4.61
Ln (hourly wage) 22 4.61 Annual work hours 9 4.61
Equal opportunity hypothesis Ln (education) 11 4.61
Ln (earnings) 61 4.61
Ln (hourly wage) 39 4.61 Annual work hours 27 4.61
β β β
α α θ θ
8 9 10
1 1 0
+ + +
+ + + +
= = =
= = = = =
. . . K . . . J
β β β
β β β
α α
1 2 3
8 9 10
1 0 0 + + + + + + + + = = = = = = = . . . and and K
β β β
θ α
1 2 3
1 0 0 + + + + + = = = = . . . and and J
β1 0 β2 β3
+ + +
= =
74 / P L. M
Efficacy, achievement orientation, connectedness to potential sources of help, risk avoidance, and aspiration-ambition performed better in the values regression than the other family behavior variables, that is, they tended to have the expected sign (positive) or where statistically insignificant when they had the wrong sign (negative). Among the two motivation variables, achievement orientation has a positive and statistically significant effect on young adult years of education in all specifications. In the baseline motiva-tion (Table 2) and values (Table 4) equamotiva-tions, raising achievement orientamotiva-tion by a standardized unit will increase educational attainment by 2.85 percent and 2.18, respectively. This coefficient falls sharply to 0.39 percent in the composite equation (Table 5). On the other hand, we cannot obtain a robust estimate of either the qualitative or quantitative effect of efficacy. In the values equation (Table 4), raising efficacy by a standard unit has a positive but statistically insignificant effect of 0.21 percent, down from 1.18 percent in the baseline motivation equation (Table 2). In the composite regression, efficacy actually has a negative effect on education, −0.38 percent (Table 5). The composite regression shows that if both parents have a college degree young adult years of education increase by 5.5 percent. But, if both parents are high school dropouts, educational attainment will decline by 5.22 per-cent. Young adults raised in homes where there is a large amount of reading material increase their years of education by 1.45 percent, while those raised in homes little or no reading material obtain 2.86 percent less education.
When we compare the baseline standard equation of Table 2 to the values equation of Table 4, and therefore account for an extensive list of family behaviors, the African American female coefficient increases from −4.38 percent to −2.13 percent. The African American male coefficient is positive but insignificant in the values equation. In the class and composite regres-sions, Tables 4 and 5, respectively, African American men accumulate 5.6 percent more education than white men. Similarly, in both the class and composite regressions, the African American female coefficient is significant, positive, and 3.0 percentage points greater than the point estimate of the white female coefficient (which is small and statistically insignificant).
Return to Family Values / 75
An alternative explanation is that African American’s greater years of education given the observable variables indicates that African Americans attend lower quality schools than whites or that within a particular school African Americans face lower standards than whites, with easier classes, less learning, and lower graduation rates. Given that we have controlled for a rather diverse set of elements related to family environment, this explanation lacks plausibility.
Nevertheless, it is plausible that our results here as well as those of scholars in previous studies have not adequately controlled for subtle within-school differences in the racial impact of school policies. During the 1930s−1960s African Americans did attend schools of measurably lower quality than the schools attended by whites (Card and Krueger 1992). By the late 1970s the gap in observed school quality was relatively small (Boozer et al. 1992; Grogger 1996); although, white students are more likely than African American students to use computers in the classroom. Also, there are within-school racial differences in class size (Boozer and Rouse 2001). African American students are disproportionately assigned to compensatory education classes, which have lower within-school pupil–teacher ratios. Boozer and Rouse find that the intra-school difference in class size accounts for 18 – 47 percent of African American test score gains between 8th and 10th grade. Collins and Margo (2003) document sustained educational convergence in educational quality and years of education from the mid-1800s to cohorts born during the 1950s—despite considerable racial discrimination against African Americans in the provision of education and the market rate of return to an additional year of schooling. Similarly, Ferguson (2000) and Bernstein (1995) show that the African American–white Scholastic Aptitude Test and National Assessment of Educational Progress gaps declined substantially from 1971 to the mid-1990s. According to Grissmer et al. (1994), changes in test score covariates during this period under-predict actual changes in African American standardized test score increases; albeit, they speculate that this is likely the result of unobserved changes in public policy rather than unobserved characteristics of African American culture.
76 / P L. M
effect on young adult hourly wages and annual earnings. Increasing both efficacy and achievement orientation by a standardize unit will increasing hourly wages by 4.24 percent (composite regression) to 6.08 percent (values regression). Increasing both efficacy and achievement orientation by a stan-dardize unit will increasing annual earnings by 5.94 percent (composite regression) to 6.49 percent (values regression).
The composite regression shows that African American women earn 73 percent less than white men, while African American men and white women earn 21 and 56 percent less, respectively. It is frequently reported that African American and white women have similar hourly wage coefficients. (See for example Darity Guilkey and Winfrey 1995). Our results here are not dramatically at variance with this finding. African American women have an hourly wage penalty of 0.29 log points while white women have an hourly wage penalty of 0.26 log points.
Despite identical years of potential work experience, nearly identical years of education, and substantial controls for family behaviors and family class background, the composite regression shows that African American men have an 8.36 percent hourly wage penalty relative to white men. Nevertheless, this male hourly wage differential is close to the 0.07 log wage differential reported by Neal and Johnson (1996), which also examined racial wage inequality in a sample of young men and women who were 26 –29 years of age. However, Darity and Mason (1998) report a consensus estimate of male racial wage discrimination of 0.15 log points. To test the robustness of our results, we divided the cohort into two 5-year samples (omitting the middle year of the cohort). During the first 5 years the cohort moved from ages 17–28 to ages 21–32; there is no statistically significant male racial hourly wage differential. During the second five years the cohort moved from ages 23 –34 to ages 27–38; African American men suffer a 0.20 log point differential relative to white males.
Annual Hours of Work
The annual work hours of young adults is positively correlated with that of their childhood head of household. There is very little variation by model specification. At 0.06, the composite regression suggests that a 100-hour increase in parental work time translates into another 6 hours of work time for young adults.
Return to Family Values / 77
hours. The baseline standard equation shows that African American men work 147 hours per year less than white men. This differential rises to 148 hours in the values equation, but it falls to 141 hours in the class equation. African American men with a family environment identical to that of white men secure 148 fewer hours of employment per year (Table 5). Regardless of model specification, African American women are not able to obtain work hours equal to that of white women. The female racial work-hour differential is similar to the male racial work-hour differential and follows the same pattern with respect to the impact of family behaviors and family socioeconomic status.
Motivation does not appear to have a statistically significant impact on annual work hours. Efficacy has a positive but statistically insignificant effect in the motivation, values, and composite specifications. Achievement orientation also has a positive effect in each specification, but it is significant only in the baseline motivation specification.
Summary and Discussion
This study has examined the effect of childhood family environment on young adult years of educational attainment, annual income, annual hours of employment, and hourly wage rate. Young adult education and labor market outcomes increase with both parental socioeconomic status and family behaviors, viz., motivation. The effects of class on intergenerational mobility are considerably larger than the effects of family values on intergenerational mobility.
Despite the important impact of childhood family values on intergenera-tional mobility, we find rather limited evidence that accounting for such differences decreases residual interracial inequality.
Interracial differences in childhood family class status have substantial effects on racial inequality, though some of these effects are a challenge to the received wisdom on racial inequality.
78 / P L. M
effects remain unacceptably large. However, controlling for racial differences in parental values has very modest effects on young adult residual racial inequality in annual earnings, hourly wage rates, and annual work hours. So African American family behavioral characteristics reduce the impact of discrimination or unequal resources in the educational process and are not a contributory factor to inequality in labor market outcomes.
There are straightforward policy suggestions that may be drawn from this research. First, there is a payoff to motivation: Individuals may improve their educational attainment and labor market outcomes by increasing their sense of efficacy and achievement orientation. Second, both race and sex anti-discrimination policies remain greatly necessary but not sufficient. Policies that prohibit discrimination are sufficient in an environment where discrimi-natory treatment does not represent a major expladiscrimi-natory factor for racial and gender differences in well-being. The results of this study suggest that racial discrimination substantially reduces the well-being of young adult African Americans. (It may also be true that gender discrimination has a large and negative influence on the well-being of young women; however, we have not provided precise estimates of the impact of gender discrimination. The statistical model does not control for family obligations that may dif-ferentially affect women with respect to market outcomes). Hence, the most appropriate policy is one of aggressive action by employing organizations combined with serious penalties for those organizations that engage in discriminatory behavior.
The results also suggest it is appropriate for government to adopt strong measures to counterbalance the class effects on individual well-being. We have uncovered class effects that are so large that even if we were to observe individuals of the same race and sex, and raised in homes with the same parental family values, large parental class differences among them will produce sizable differences in young adult well-being. Indeed, our statistical results show that current well-being among young adults is affected by the inequality of class status by both their parents’ and their grandparents’ generations.
R
Andrisani, Paul J. 1977. “Internal–External Attitudes, Personal Initiative, and Labor-Market Experience of Black and White Men.” Journal of Human Resources 12(3):308 –28.
Akerlof, George A. 2002. “Behavioral Macroeconomics and Macroeconomic Behavior.” American Eco-nomic Review 92(3)(June):411–33.
——— and Rachel E. Kranton. 2002. “Identity and Schooling: Some Lessons for the Economics of Education.” Journal of Economic Literature 40(4)(December):1167–201.
Return to Family Values / 79
Atkinson, John W. 1964. Introduction to Motivation. Princeton: Van Nostrand.
Bauman, Kurt J. 1998. “Schools, Markets, and Family in the History of African-American Education.”
American Journal of Education 106(4)(August):500 –31.
Becker, Gary 1991. A Treatise on the Family. Cambridge, MA: Harvard University Press.
Bernstein, Jared. 1995. Where’s the Payoff? The Gap Between Black Academic Progress and Economic Gains. Washington, D.C.: Economic Policy Institute.
Boozer, Michael A. and Cecilia Rouse. 2001. “Intraschool Variation in Class Size: Patterns and Implica-tions.” Journal of Urban Economics 50(1)(July):163 – 89.
———, Alan B. Krueger, Shari Wolkon, John C. Haltiwaroer, and Glenn Laiw. 1992. “Brookings Papers on Economic Activity.” Microeconomics Vol. 1992: 269 –338.
Borjas, George. 1992. “Ethnic Capital and Intergenerational Mobility.” Quarterly Journal of Economics
CVII(1)(February):123 –50.
Bowles, Samuel 1972. “Schooling and Inequality from Generation to Generation.” Journal of Political Economy 80(3, Part 2)(May/June):S219 –51.
———, Herbert Gintis, and Melissa Osborne. 2001. “The Determinants of Earnings: Skills, Preferences, and Schooling.” Journal of Economic Literature 39(4):1137–76.
Card, David and Alan Krueger. 1992. “Does School Quality Matter? Returns to Education and the Characteristics of Public Schools in the United States.” Journal of Political Economy
100(1)(February):1– 40.
Carneiro, Pedro James Heckman, and Dimitriy Masterov. 2003. “Labor Market Discrimination and Racial Differences in Premarket Factors.” Working Paper w10068, NBER.
———, James Heckman, and Dimitriy Masterov. 2003. “Labor Market Discrimination and Racial Differences in Premarket Factors. Working Paper 10068. National Bureau of Economic Research.
Collins, William J. and Robert A. Margo. 2003. “Historical Perspectives on Racial Differences in Schooling in the United States.” Working Paper 9790. National Bureau of Economic Research. Corak, Miles and Andrew Heisz. 1999. “The Intergenerational Earnings and Income Mobility of Canadian
Men.” Journal of Human Resources 34(3)(Summer):504 –33.
Couch, Kenneth A. and Thomas A. Dunn. 1997. “Intergenerational Correlations in Labor Market Status.” Journal of Human Resources 32(1)(Winter):210 –32.
Cutler, David M. and Edward L. Glaeser. 1997. “Are Ghettos Good or Bad?” Quarterly Journal of Economics 112(3)(August):827–72.
Darity, Jr., William and Patrick Mason. 1998. “Evidence on Discrimination in Employment: Codes of Color, Codes of Gender.” Journal of Economic Perspectives 12(2)(Spring):63 – 90.
———, David Guilkey, and William Winfrey. 1995. “Ethnicity, Race, and Earnings.” Economic Letters
47:401– 8.
———, Jason Dietrich, and David K. Guilkey. 1997. “Racial and Ethnic Inequality in the United States: A Secular Perspective.” American Economic Association Papers and Proceedings 87(2) (May):301–05.
Duncan, Greg J. and James N. Morgan. 1981. “Sense of Efficacy and Subsequent Change in Earnings: A Replication.” Journal of Human Resources 16:649 –57.
Dunifon, Rachel and Greg J. Duncan. 1998. “Long-Run Effects of Motivation on Labor-Market Suc-cess.” Social Psychology Quarterly 61(1)(March):33 – 48.
Eide, Eric and Mark Showalter. 1999. “Factors Affecting the Transmission of Earnings Across Gener-ations.” Journal of Human Resources 34(2)(Spring):253 – 67.
Ferguson, Ronald. 2000. “Test-Score Trends Along Racial Lines, 1971 to 1996: Popular Culture and Community Academic Standards,” In America Becoming: Racial Trends and Their Consequences
Volume 1, edited by Smelser, N., W. J. Wilson, and Mitchell, pp. 348 –390. Washington, D.C.: National Academy Press.
Glaeser, Edward L., David Laibson, and Bruce Sacerdote. 2002. “An Economic Approach to Social Capital.” Economic Journal 112(483)(November): F437–58.
80 / P L. M
Grissmer, David, Sheila Kirby, Mark Berends, and Stephanie Williamson. 1994. Student Achievement and the Changing American Family. Santa Monica, CA.: Rand Institute.
Grogger, Jeffrey. 1996. “Does School Quality Explain the Recent Black–White Wage Trend?” Journal of Labor Economics 14(2)(April):231–53.
Hill, Martha S. 1985. Motivation and Economic Mobility. Ann Arbor, MI: Institute for Social Research, University of Michigan.
Institute for Social Research. 1972. A Panel Study of Income Dynamics: Tape Codes and Indexes, 1968 – 1972 Interviewing Years (Waves I–V) Volume II. Ann Arbor, MI: The University of Michigan. Johnson, William R. and Derek Neal. 1998. “Basic Skills and the Black–White Earnings Gap,” In The
Black–White Test Score Gap, edited by Christopher Jencks and Meredith Phillips, pp. 480 – 97. Washington, D.C.: Brookings Institution Press.
Levine, David I. and Bhashkar Mazumder. 2002. “Choosing the Right Parents: Changes in the Inter-generational Transmission of Inequality—Between 1980 and the Early 1990s.” Working Paper, Federal Reserve Bank of Chicago.
Loury, Glenn C. 1984. “Internally Directed Action for Black-Community Development—The Next Fron-tier for the Movement.” Review of Black Political Economy 13(1–2):31– 46.
———. 1989. “Why Should We Care About Inequality?” In The Question of Discrimination: Racial Inequality in the U. S. Labor Market, edited by S. Schulman and W. Darity, pp. 268 –90. Mason, Patrick L. 1997. “Race, Culture, and Skill: Interracial Wage Differences Among African
Amer-icans, Latinos, and Whites.” Review of Black Political Economy 25(3)(Winter):5 – 40.
———. 1999. “Family Environment and Intergenerational Well-Being: Some Preliminary Results.”
State of Black America, edited by William E. Spriggs. Washington, D.C.: Urban League. Moynihan, Daniel P. 1965. The Negro Family: The Case for National Action. Washington, D.C.: Office
of Policy Planning and Research, U. S. Department of Labor.
Neal, Derek A. and William Johnson. 1996. “The Role of Premarket Factors in Black–White Wage Differences.” Journal of Political Economy 104(5)(October):869 – 95.
Painter, Gary and David I. Levine. 2002. “Daddies, Devotion, and Dollars: How Do They Matter for Youth?” Working Paper, University of Southern California.
Rodgers, William and William Spriggs. 1996. “What Does the AFQT Really Measure: Race, Wages and Schooling and the AFQT Score?” Review of Black Political Economy 24(4)(Spring):13 – 46. Stellmack, Amy L., Connie R. Wanberg, and John Kammeyer-Mueller. 2003. “Transitions Off Welfare:
An Examination of Demographic, Socioeconomic, and Motivational Predictors.” Industrial Relations 42(4)(October):623 – 49.
Szekelyi, Maria and Robert Tarnos. 1993. “Attitudes That Make a Difference: Expectancies and Economic Progress.” Discussion Paper #1003-93, University of Wisconsin, Madison, Institute for Research on Poverty.