Journal of Chemical and Pharmaceutical Research, 2014, 6(5):1641-1648
Research Article
CODEN(USA) : JCPRC5
ISSN : 0975-7384
Path and efficiency of financial support to PV industry in China -Based on F-SCP
paradigm
Feng Xu and Yun-long Li
Research Center of Financial Engineering, South China University of Technology, Guanzhou,
China
______________________________________________________________________________
ABSTRACT
Photovoltaic (PV) industry is strategically important in China. This work deduced the analytical paradigm of basic logical framework F-SCP, followed by analysis on specific path for financial support to industrial development of PV industry. Then the work applied DEA model and logistic model to two-stage empirical research, analyzing the efficiency of financial support to the development of PV industry in China. Conclusion on financial support to PV industry can be divided in two parts: for support path, the financial support has imperfect subject and unreasonable direction; for support efficiency, unreasonable debt financing scale and high market risk lead to inefficient financial support. In the end, it was proposed that structure optimization and method innovation for financial support, as well as the enhancement of industrial competitiveness, are highly required to support the development of PV industry.
Keywords: financial support; photovoltaic; F-SCP paradigm; efficiency
_____________________________________________________________________________________________
INTRODUCTION
China’s economic development is not sustainable because of its high consumption of energy and heavy pollution. It is urgent for China to use clean energy and transform economic development mode. Recently, new energy industries, especially PV industry, are facing problems such as over-reliance on foreign market. To guarantee energy supply and promote economic restructuring, the healthy and rapid development of PV industry is important.
There are plenty of research on financial support for economic growth and industrial development. In promoting industrial development, there are sufficient research showing the relevance between financial support and industrial development and upgrading. Foreign researches focus on how industry finances. Schref and Smith (1998)considered financing as the first sign of finance support to the industrial or regional development [1]. Brunnschweile (2006) pointed out that the expansion of financing scale had a significant promotion on industrial growth[2]. In domestic researches, because of the short period development of China’s PV industry, scholars mainly focused on the industrial financing in finance support to PV industrial development. As a theoretical reference, this work, based on the industrial organization theory, introduced financial support, deduced F-SCP paradigm to analyze the financial support path, and applied two-stage empirical analysis to study financial support efficiency.
2.Deduction of F-SCP paradigm
______________________________________________________________________________
SCP paradigm gradually formed in the development of industrial organization theory. During the research of industrial organization theory, Harvard School created the analytical framework of market structure (Structure)-market behavior (Conduct)-market performance (Performance). It was thought the market structure determined the market behavior, and market behavior played a decisive role in the efficiency of resource allocation. Subsequently, Chicago School considered concentration influential on profit. In addition, the New Austrian School paid more attention to corporate behavior [3].
The application of industrial organization theory based on SCP paradigm is relatively mature in developed countries, but there are some limitations for it when applied to China’s industry. First, the focus of debate between Harvard School and Chicago School is on the dominance relationship among market structure, behavior and performance, but without a thorough analysis on policy system or the influences from other exogenous factors. Secondly, the analysis of industry by the two schools is based on the condition of full market economy, which may not work for all the industries in China. Moreover, Harvard School focused on monopoly industries, and the view from Chicago School was mainly for high concentration. For a market with low concentration, and in disorderly competition state temporarily, its economies of scale cannot be able to function. However, it is not discussed in depth by the two schools that whether to introduce government policies to achieve effective competition.
PV industry is special in China. First, it is strategic and emerging in China. The new energy industry represented by PV industry is of great strategic significance to achieve the low-carbon society in China. And China’s PV industry is emerging because it started later than the developed countries. Secondly, PV industry is of publicity. It aims at solving energy shortage and environmental pollution in China via photovoltaic power generation, with the application of PV products. Electric resource is a basic resource for a country. PV industry is of publicity because it avoids pollution as a clean energy, which makes it not fully applicable for market economy. Moreover, China’s national conditions are unique. Local governments utilize PV projects as their political achievements, making the PV industry not to be an entirely market-oriented industry. Last but not least, China’s PV industry is in temporary disorder. A large number of PV companies facing bankruptcy because of short-term oversupply in the global market [4].
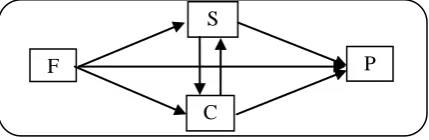
[image:2.595.185.400.450.520.2]These four particularities mentioned above deny a simple application of industrial organization theory based on SCP mode from the western countries when studying China’s PV industry. Modifications are high required. Therefore, this work introduced financial support into the analytical paradigm of SCP theory as an independent variable. Setting financial support as the logical starting point and industrial performance as the logical end, this work explored a new method for studying financial support to industrial development and tried to establish the F-SCP paradigm.
Figure 1.F-SCP analytical paradigm
Figure 1.F-SCP analytical paradigm
F-SCP paradigm stands for financial support (Finance)-market Structure (Structure)-market behavior (Conduct)-market performance (Performance) analysis paradigm. To be specific, it is based on the description of market structure (S), behavior (C) and performance (P), to analyze the path of financial support (F), directly or indirectly, to market performance via market structure and market behavior. This work also studied the efficiency of financial support to industry by empirical methods.
3.Financial support path to China’s PV industry based on F-SCP
The fundamental purpose of financial support to PV industry is to promote PV industry. This process will be achieved via the effects from financial support directly on the market performance of PV industry, and indirectly on the market structure and behavior of PV industry.
3.1Direct path of financial support-industrial development
According to the theory of industrial organization, the market performance of an industry can be used to assess industrial development. To be specific, the market performance of PV can be described by photovoltaic production, utilization ratio of capacity, the application of power generation, etc. The direct effect of financial support on industrial development is mainly through capital market, bank credit, government tax subsidies, etc. China’s capital market, especially the GEM (Growth Enterprises Market), played as a promoting role in PV industrial scale and project expansion. After the establishment of GEM in October 2009, China’s PV industrial IPO financing cumulative amount
F
S
C
___________________________________________________________________________
reached ¥14.81 billion, which was far more than that in oversea market ($137 million). In addition, the bank is the main force to support PV industrial expansion. The policy-oriented China Development Bank and state-owned banks take the major part bank support. Between 2008 and 2011, only from China Development Bank and China Bank, the loan financing to the leading PV industrial enterprises had exceeded ¥100 billion[4].
Table 1. Credit lines of some leading corporate banks from 2008 to 2011
Time Enterprise Credit bank Loan quota
2008 Yingli Solar China Development Bank $70,000,000 2009 Trina Solar Syndications led by China Bank $300,000,000 2010 LDK Solar China Development Bank ¥60,000,000,000 2010 Hanwha SolarOne China Bank ¥7,000,000,000 2011 Chaori Solar China Development Bank €1,000,000,000
Data sources: summarized from network data
Moreover, China introduced relevant financial and taxation policies to support the development of PV industry. From 2009 to 2012, the fiscal policies regulated and supported PV industry in the total size of photovoltaic, power generation subsidies, project grants, etc. In July 2012, "12th five-year Plan of Solar Power Development" was introduced. It was expected in the plan that by the end of 2015, the installed capacity of solar power would exceed 21 million kilowatts and the annual generating capacity would be up to 250 billion kWh, which revealed the fiscal support efforts to PV industry. Therefore, financial direct support has become a primary force in PV industrial listing, financing, scale and production expansion, which undoubtedly plays an important role in promoting the large-scale development of China's PV industry.
3.2Indirect path of financial support-market structure-industrial development
Harvard School considered that market structure determined enterprise behavior, which played a decisive role in enterprise performance. According to the theory of industrial organization, the market structure of PV industry consists of market concentration, degree of vertical integration, distribution of industry chain, and entry barriers. The indirect path for finance to support PV industry is that financial support influences market structure, which will have impact on industrial performance.
Financial support plays a positive role in adjusting market structure through tax subsidies and political permit, while the structural support of capital market, bank credit and private equity funds to PV industry is still unreasonable. Fiscal subsidies can directly expand PV installed capacity in the project, and popularize the application of China’s clean energy. In 2011, the growth rate of PV installed capacity is 367.50%, and 76.29% for that of PV component. The export ratio of PV component will decrease gradually, which can reduce dependence on the international market. Moreover, capital market and bank credit mainly support PV industry in the expansion of production and scale. Finance supports powerful enterprise to increase productivity, resulting in increased market concentration. Price declining of PV production caused by the scale effect is good for power grid connection. However, the support to PV industry from capital market and bank credit mainly focuses on the aspects of excess cells and modules, which leads to serious oversupply. In addition, in supporting PV industry in the oversea markets, foreign private equity fund takes the major part, indicating the insufficient support from China’s private equity.
The indirect impact of market structure on PV industrial development is mainly through market concentration, degree of vertical integration, distribution of industry chain, and entry barriers. The vertical integration of PV industry is capable to reduce production cost, improve the quality of products, promote the grid connection of photovoltaic, coordinate the enterprises along the industry chain, improve the demand matching ability, and reduce the waste caused by asymmetric. In addition, with the extension of PV industry line, the market concentration tends to drop at first and rise after that. In 2011, CR4 produced by PV batteries is 35.11%, which is very close to complete market competition with fierce competition. The market concentration of PV batteries and component production is so low that fierce competition, even disorderly competition occurs. A proper concentration ratio should be maintained to promote PV industrial development. Moreover, the present fusiform structure of PV industry has a close relation to the entry barriers. The purification process of photovoltaic silicon is facing the technical bottleneck, which blocks China’s PV enterprise to enter the stage of polysilicon. Another barrier is the backward application of grid connection technology. Large-scale grid connection for PV power station has to be denied, which blocks the expansion of China’s PV market.
3.3Indirect path of financial support-market behavior-industrial development
______________________________________________________________________________
There is little direct impact on the market behavior of PV industrial from finance. The price strategy of the enterprises is one of the main factors considered to reflect the industrial market behaviors. However, the present PV industrial products are the recipient of price, because of their limited product diversity and weak negotiating power. Therefore, financial support indirectly influences the cost or price of PV products though the market structure and technology development. For research behaviors, most funds for PV industrial research come from the enterprise. Only a minority of funds come from scientific research applied by university and financial investment based on national policy. Thus financial support is insufficient for research behaviors.
It is difficult for market behavior to influence PV industry by adjusting the price. Instead, the industrial development is mainly influenced by research behaviors. At present, the technology of polysilicon purification is monopolized by seven foreign leading manufacturers. The import demand of polysilicon is still high in China. For example, the import demand ratio is around 60% in 2010. As a result, the price of polysilicon in China will vary with the trend of international price accordingly. Taking up 58% of total cost of PV products, polysilicon has a significant impact on the price. Just because the manufacturer of photovoltaic cannot negotiate but accept the price charged by foreign markets, limited impact can be made on industrial performance. In addition, enterprise at upper part of PV industry chain demands higher for technology, which leads to tougher technical barrier. Currently, the main technical barrier in photovoltaic is silicon purification, which is monopolized by powerful foreign manufacturers. And the slicing technique of polysilicon is controlled by minority enterprises as well. Moreover, the application of PV generation and the backward technology of grid connection also influence the PV enterprises on arranging the lower part of the industrial chain.
3.4Conclusion on F-SCP financial support path in China’s PV industry
[image:4.595.100.519.394.694.2]According to F-SCP paradigm, the imperfect subject and unreasonable direction of financial support still exist in China’s PV industrial development. A support path is concluded, with financial support as the logical starting point and industrial performance as the logical end. Various methods may occur in the process of financial support such as F-P, F-S-C-P, F-C-S-P, F-C-C-P and even F-P-S-P, which is shown in Figure 2.
Figure 2 .F-SCP financial support path in PV industry
4. Analysis on financial support efficiency in China’s PV industry
___________________________________________________________________________
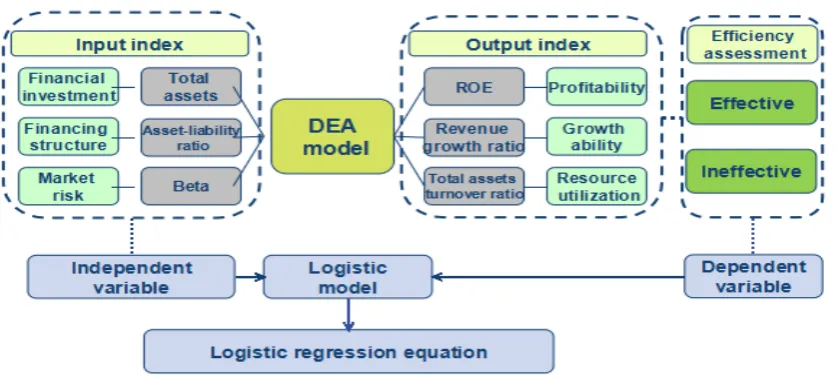
[image:5.595.99.518.125.315.2]and the influence on efficiency from financial support factor, conclusions will be drawn accordingly. Figure 3 shows the structure of this model.
Figure 3. Structure of two-stage empirical research
4.1Establishment and analysis of DEA model of financial support efficiency
In this session, influence on PV industrial efficiency from financial investment will be analyzed, based on the establishment of DEA BC2 model of financial support efficiency.
4.1.1Evaluating indicator and sample selection
[image:5.595.92.520.520.587.2]Based on plenty of literature about financial support efficiency and business financing efficiency, this work selected total assets, asset-liability ratio and Beta as the input indexes of financial support, reflecting financial investment, financing structure and market risk, respectively. Moreover, based on the theory of industrial organization and the theory of financial management, this work selected the Rate of Return on Common Stockholders’ Equity (ROE), total assets turnover ratio and revenue growth ratio as the output indexes, reflecting profitability, resource utilization and the operation status and growth ability respectively.
Table 2 .Index system of relevant input and output
Direction Name Symbol Meaning
Input index
Total assets X1 Financial investment
Asset-liability ratio X2 Financing structure
Beta X3 Market risk
Output index
ROE Y1 Profitability
Revenue growth ratio Y2 Growth ability
Total assets turnover ratio X1 Resource utilization
Standardization can be achieved by the following equation.
9
.
0
1
.
0
×
−
−
+
=
j j
j ij ij
m
M
m
X
Y
(1)
Where,
m
j=
min(
X
ij)
,M
j=
max(
X
ij)
,i
=
(
1
,
2
,
3
,...,
n
)
,Y
ij=
[
0
,
1
]
______________________________________________________________________________
4.1.2Analysis on empirical result
Based on the data of 27 sampled companies and 6 indexes, their average values in 2010 and 2011 were standardized and introduced in DEA model. The technical efficiency (TE), pure technical efficiency (PTE), scale efficiency (SE), the product insufficiency (S-) of each element and investment redundancy (S+) were obtained by the software DEAP 2.1.
[image:6.595.106.509.218.252.2]In general, the financial support efficiency of domestic listed companies is low, which means their investment has not been taken full advantage.
Table 3. General analysis on financial support efficiency
TE PTE SE S- S+
Number of companies 5 12 6 15 12
Proportion 18.52% 44.44% 22.22% 55.56% 44.44%
Table 3 shows the value of technical efficiency, first of all, is 1 for only 5 enterprises in the sample, accounting for 18.52% of all the enterprises. And their slack variables of inputs and outputs are zero. This indicates that these enterprises are in the production frontier, with effective scale and technology. With their maximized output and minimized investment, their financial support is relatively effective. Secondly, 12 enterprises are pure technical efficient, and their slack variables of inputs and production are 0 as well, representing 44.44% of all enterprises. This indicates that disregarding the scale variation, these enterprises are relatively effective without an optimized scale. The relatively effective state of financial support has to be achieved by increasing or decreasing the investment. Moreover, 6 enterprises are effective in scale, which indicates they have an appropriate scale. If efficiency is not optimal, the optimized efficiency can only be achieved by improving the interior operation efficiency instead of increasing or decreasing the investment. Fourthly, there are 15 enterprises with insufficient output, indicating that with the same input, financial support efficiency can be improved by increasing output. Finally, 12 enterprises are in investment redundancy, indicating that with the same output, financial support efficiency can be improved by decreasing input.
4.2Establishment and analysis of logistic model of financial support efficiency
Based on logistic regression model, in this session the work analyzed the influence on market performance from financial support to PV industry.
4.2.1Establishment of logistic model
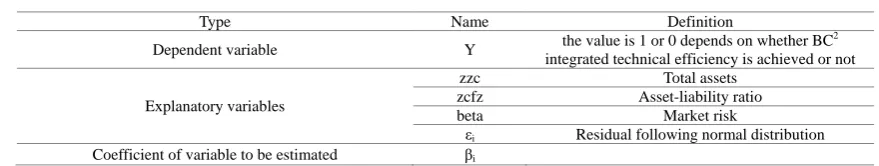
[image:6.595.83.523.572.655.2]In order to study how financial investment factor influences the efficiency of financial support, logistic regression analysis will be introduced. The work set the BC2 integrated technical efficiency (TE) as dependent variable, where whether the value of DMU is 1 or 0 depends on whether it achieves the BC2 integrated technical efficiency or not. Moreover, the input indexes in DEA assessment model (Total assets (zzc), Asset-liability ratio (zcfz) and beta) were introduced into logistic model as explanatory variable. The null hypothesis of this model was defined as no significant relationship between explanatory variable and independent variable Y. Variables and their definition are listed in Table 4.
Table 4 .Model variables
Type Name Definition
Dependent variable Y the value is 1 or 0 depends on whether BC2 integrated technical efficiency is achieved or not
Explanatory variables
zzc Total assets
zcfz Asset-liability ratio
beta Market risk
εi Residual following normal distribution
Coefficient of variable to be estimated βi
The logistic model of financial support to China’s PV industry as following:
i
beta
zcfz
zzc
Y
=
b
1⋅
+
b
2⋅
+
b
3⋅
+
e
(2) 4.2.2Regression analysis on logistic model
___________________________________________________________________________
Table 5. Fit statistics
Hosmer-Lemeshow test
Chi-square df Sig.
5.882 7 0.554
According to the table of fit statistics, the significance probability (sig) of Hosmer-Lemeshow test in this model equals to 0.554, larger than 0.05. Thus it can be considered that the statistical insignificance denies the formal hypothesis that the data fits well in this model, which means the model has a good fit result.
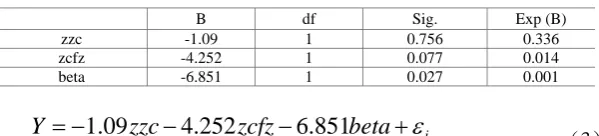
Table 6. Result of regression
B df Sig. Exp (B)
zzc -1.09 1 0.756 0.336
zcfz -4.252 1 0.077 0.014
beta -6.851 1 0.027 0.001
i
beta
zcfz
zzc
Y
=
−
1
.
09
−
4
.
252
−
6
.
851
+
e
(3)
According to the fit result of logistic model, beta and zcfz passed the significance test of sig<0.05 and sig<0.1, respectively. This indicates, in the significance level of 0.05, that the model denies the hypothesis of no significant relationship between beta and Y, with a negative coefficient; beta has a significant negative effect on financial support efficiency. Moreover, in the significance level of 0.1, the model denies the hypothesis of no significant relationship between zcfz and Y, with a negative coefficient. This means asset-liability ratio has a relative significant negative effect on financial support efficiency. At last, zzc didn’t pass the significance test, which means total assets have no significant effect on Y.
4.2.3Conclusion and analysis on the logistic model of financial support
According to the logistic regression analysis, the asset-liability ratio and Beta of have negative effect on financial support efficiency in PV industry between 2010 and 2011. Thus in PV industry, the higher the asset-liability ratio is, the lower chance of effective financial support will be. Similarly, the higher the market risk is, the less chance of effective financial support will be.
For the asset-liability ratio, its average value is 44% in the sampled enterprises, relatively low compared with the average of 53% in China’s manufacturing industry. However, due to the explosive growth of domestic PV enterprises and PV products in 2010, debt financing takes a considerable part in the projects. Facing the contraction of PV market in 2011, pressure was put on those enterprises with large scale of debt financing to repay, because of blocked product sales and slow fund retrieving. In addition, in this stagnant market, increased enterprise risk leads to higher refinancing interest and higher cost of debt financing. Under the double effect of increased financing cost and higher repayment pressure, the higher the asset-liability ratio is, the less effective financial support will be.
For beta, it stands for the risk for the enterprises in financial market, especially for the stock market. The higher beta is, the more heavily that enterprise fluctuates in financial market. From 2009 to the end of 2011, the composite indexes in domestic stock market are 3277.14, 2808.08 and 2199.142, respectively, which are all in downswing period. And because of the negative relationship between beta and financial support efficiency, the larger beta is, the less chance of effective financial support will be.
[image:7.595.158.458.214.282.2]______________________________________________________________________________
5.Main conclusions and policies
New energy industry, represented by PV industry, is strategically important to Chinese sustainable development. Recently development of PV industry is facing difficulties, although China’s government has already offered huge financial support.
According to the work, the current debt financing scale of domestic PV industry hinders the achievement of financial support efficiency, then the development of PV industry. Moreover, PV industry is facing high market risk, which also hinders the achievement of financial support efficiency, then the development of PV industry.
Therefore, methods such as optimizing financial support structure, reducing debt financing, broadening the channel of equity financing and increasing fiscal subsidies can ensure the financial factors a proper support to PV industry. Innovating financial support mode and developing financing for PV projects can also open up a new way to achieving financial support. Moreover, for PV industry, revising laws and regulations is required to improve its industrial strategic status. Enhancing competitiveness and improving operation efficiency for the industry and enterprises are required to improve financial support efficiency. Finally, accelerating regulating industrial standard, increasing the entry barrier of the excess part, strengthening the support to technological innovation and reducing the technical barrier in application can also fix the unreasonable industrial structure in a short time.
Acknowledgments
The paper was supported by China Clean Development Mechanism Fund(2012021), Guangdong Natural Science Fund(S2013010013990) and the Fundamental Research Funds for the Central Universities, SCUT. We are also grateful to the anonymous reviewers for their constructive comments and suggestions on this paper.
REFERENCES
[1] Schreft S. L. & Smith B. D., 1998, "The Effects of Open Market Operations in a Model of Intermediation and Growth", The
Review of Economic Studies, 65(3), 519~550.
[2] Brunnschweiler C. N., 2008, "Cursing the Blessings? Natural Resource Abundance, Institutions, and Economic Growth", World Development, 36(3), 399~419..
[3] Dongshui Su., 2005 ,“Industrial Economy”, Higher Education Press.