Construction Materials and Technology Series 1 2018 ISBN 978-967-2183-19-8
17
CHAPTER 2
IMPROVEMENT OF SOFT SOIL STIFFNESS USING
GEO-COMPOSITE CELLULAR MAT
Tuan Noor Hasanah Tuan Ismail1, Devapriya Chitra Wijeyesekera2, Aima Nadia Mohd Yusoff2, Alvin John Lim Meng Siang2
1Faculty of Engineering Technology
,
2Faculty of Civil and Environmental EngineeringUniversiti Tun Hussein Onn Malaysia
,
Parit Raja,
Batu Pahat,
86400 Johor
,
Malaysia.
2
.
1 INTRODUCTIONThe highway construction over sub-grade consisting of problematic soils gives challenges to the engineer due to their weak geotechnical characteristic [1, 2, 3];
High water content,
High compressibility, and
[image:1.597.139.446.523.688.2] Low bearing capacity.
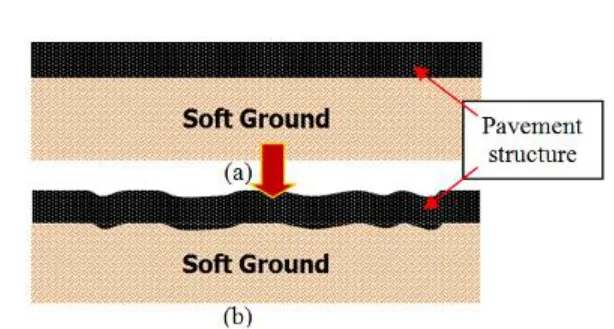
Figure 2.1: Structure road and sub-grade settlements; (a) immediately after completing the construction, (b) differential and non-uniform settlement occur after some times.
Construction Materials and Technology Series 1 2018 ISBN 978-967-2183-19-8
18
embankment weight exacerbate the settlement scenario. It is therefore more critically challenging to construct structure over soft soil (see Figure 3.1). Figure 2.1(a) shows the structure-soil profile immediately after completing the construction of the structure. Figure 2.1(b) shows the non-uniform settlements than can occur sometime after the completion of the construction. It also illustrates that the non-uniform consolidation of foundation soils is reflected in the settlement of the structure. It is command practice to provide the short term solution to this settlement scenario by using additional fill. Unfortunately, this practice aggravates the settlement problem with time. Therefore, the thickness, composition, strength and stiffness of the sub-grade layer is a very important component that influences the long term performance of the road embankment and/or any other structure constructed on it.
Generally, the bearing capacity of soil always associated with its undrained shear strength (Cu)
which can also reflect the consistencies and compressibility of the soils (see Table 2.1). Barnes [6] presented the Table 2.1 which shows 8 consistency of soil. The colour coding in the table also reflects the degree of engineering challenge. In the spirit of the theme of this presentation the relevant soils to be considered are for Cu below 50kN/m2. Head [7] and Hawkins [8] also were reported that the Cu
[image:2.597.92.509.340.601.2]under 50kN/m2 is considered as a soft soil.
Table 2.1: Values of undrained shear strength versus consistency (modified from [9])
Consistency description
Undrained shear
strength, Cu (kN/m2) Code Field identification
Very soft < 20 exudes between fingers when squeezed in hand
Soft 20 – 40 moulded easily by finger pressure Soft to firm 40 – 50 -
Firm 50 – 75 can be moulded by strong finger pressure
Firm to stiff 75 – 100 -
Stiff 100 -150 cannot be moulded by finger but can be indented with thumb Very stiff 150 – 300 can be indented by thumb nail
Hard > 300 broken with difficulty
Table 2.2: CBR’s for commonly sub-grade condition [9]
CBR value Sub-grade strength
< 3% Poor 3% - 5% Normal 5% - 15% good
Construction Materials and Technology Series 1 2018 ISBN 978-967-2183-19-8
19
appropriately thickness of road sub-base layer to spread wheel load over a greater area of the weak sub-grade in order that the sub-grade will not be deformed [11].
The design thicknesses of the pavement structure play an important role to reduce the magnitude of the stresses on sub-grade. The traffic loading is transfer to the underline sub-grade through the pavement structure. To achieve the economy and for proper performance of road, it is necessary to improve the existing soil with the search for economic method of converting locally available problematic soil to suitable construction materials. GCM technology facilitates a lighter fill weight from a stiffer sub-base to be spread on the sub-grade.
The objective of this paper is to investigate the capability of GCM to improve the stiffness of the sub-base, especially when the existing soil consists of soft ground. In this paper the exploratory investigation was done on the standard soil and artificial material. Testing was carried out at different positions of GCM to study their effect on the CBR value and to determine the optimum position of GCM.
2.2 MATERIAL AND TESTING
MATERIAL
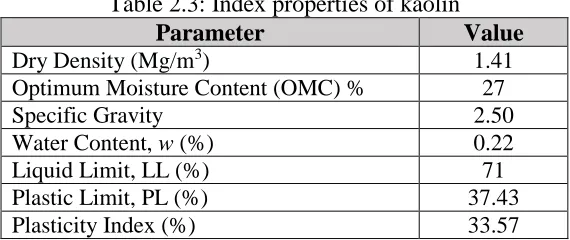
[image:3.597.156.441.459.579.2]One natural soil (kaolin) and two artificial materials (polystyrene and sponge) were selected for this study. Table 2.3 shows index properties of kaolin and Table 2.4 shows the physical properties of polystyrene and sponge used in this study. Based on the compressive strength of polystyrene and sponge lower than 6, it is represented as soft ground conditions. Kaolin was used as a standard soil in this study because it is easy to maintain its moisture content.
Table 2.3: Index properties of kaolin
Parameter Value
Dry Density (Mg/m3) 1.41
Optimum Moisture Content (OMC) % 27
Specific Gravity 2.50
Water Content, w (%) 0.22
Liquid Limit, LL (%) 71
Plastic Limit, PL (%) 37.43
Plasticity Index (%) 33.57
Table 2.4: Physical properties of the polystyrene and sponge used in the study Material
Parameter Sponge Polystyrene
Density (kg/m3) <0.010 0.015
Specific gravity - 0.90–0.95
Compression strength (MPa) <0.001 1.60– 5.2
Construction Materials and Technology Series 1 2018 ISBN 978-967-2183-19-8
20
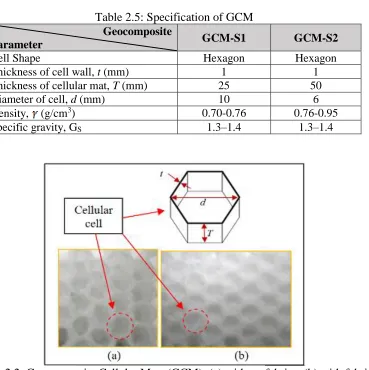
Table 2.5: Specification of GCM
Geocomposite
Parameter GCM-S1 GCM-S2
Cell Shape Hexagon Hexagon
Thickness of cell wall, t (mm) 1 1
Thickness of cellular mat, T (mm) 25 50
Diameter of cell, d (mm) 10 6
Density, (g/cm3) 0.70-0.76 0.76-0.95
[image:4.597.124.493.85.455.2]Specific gravity, GS 1.3–1.4 1.3–1.4
Figure 2.2: Geocomposite Cellular Mats (GCM); (a) without fabrics, (b) with fabrics
VANE SHEAR TEST (VST)
[image:4.597.193.400.554.748.2]Vane Shear Test was carried out using procedure are described in the British Standard (BS1377:1990:Part7) [12]. Figure 2.3 shows the vane apparatus used for vane shear testing.
Construction Materials and Technology Series 1 2018 ISBN 978-967-2183-19-8
21
This consisted of rotating a cruciform shaped vane in the test soil to cause a shear test on a cylindrical surface and two planes formed by the vane during its rotation. Hence a cylinder of soil will resist the torque until the soil fails. The torque applied to rotate the vane at a uniform speed was observed. The laboratory vane (12.7mm wide and 12.7mm long) was used to determine the undrained shear strength of soft soil in tube sample (height: diameter ratio of 1) with an area ratio less than 15% to minimise disturbance. The undrained shear strength (Cu) of the soil can be defined as Equation 2.1.
In this study vane shear test are conducted to classify the soil and investigate the correlations of shear strength.
Where,
Cu = Undrained Shear Strength (kN/m2) T = Torque (k )
k = spring constant
= twist of the spring in degrees
h = shear vane height
d = shear vane diameter
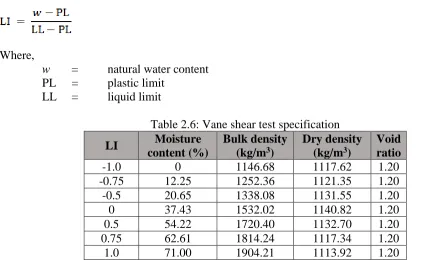
VST was conducted to measure the undrained shear strength of the kaolin for different moisture content. This test was conducted initially with dry powder kaolin (LI=-1) and its moisture content was increased to give samples with different liquidity indices (LI) which are -1.0, -0.75, -0.5, 0, 0.5, 0.75 and 1.0. LI is a dimensionless factor reflecting natural moisture content of a soil with respect to the consistency limits and is defined as in Equation 2.2.
Where,
w = natural water content PL = plastic limit
[image:5.597.53.483.462.740.2]LL = liquid limit
Table 2.6: Vane shear test specification
LI Moisture
content (%)
Bulk density
(kg/m3)
Dry density
(kg/m3)
Void ratio
Construction Materials and Technology Series 1 2018 ISBN 978-967-2183-19-8
22
The authors wish to emphasise that all investigation were carried out initially on dry powdered kaolin (moisture content 2% at LI equal to -1). The moisture content was increased steadily each time by adding water, mixing and leaving for 24 hours for water to be uniformly absorbed before any testing was done. Table 2.6 shows the properties used in VST. It demonstrating that all sample tested at the same void ratio.
CALIFORNIA BEARING RATIO (CBR) TEST
In this study, CBR tests were conducted on kaolin, polystyrene and sponge, with a single layer of GCM. The samples were prepared in the laboratory using dynamic compaction. This sample was compacted in three layers of compaction. Each layer was compacted with 62 blows using a 2.5kg lightweight hammer.
CBR test followed the procedure given in BS1377:1990:Part4 [13]. Figure 2.4 shows the Geocomp LoadTrac II testing machine used for CBR testing. A 49.65mm diameter, solid steel plunger was pushed into the soil surface at a constant rate of penetration of 1 mm/min. The force applied and the penetration was measured until a penetration of at least 5mm was observed. Steel surcharge discs were placed on the soil surface around the plunger to simulate the field surcharge from the pavement layers above. Both the top and bottom surfaces of the soil were tested accordingly.
[image:6.597.88.462.457.721.2]The force-penetration curve is plotted and compared with a standard force-penetration curve which corresponds to a ‘standard’ compacted and confined crushed rock which would give a CBR value of 100%. On the test curve the forces at 2.5mm and 5mm are read off and these are expressed as a percentage of the standard forces at these penetrations, i.e. 13.2kN and 20kN, respectively. CBR values were calculated from the force-penetration curves using Equation 2.3. The CBR value is taken as the higher result.
Construction Materials and Technology Series 1 2018 ISBN 978-967-2183-19-8
23
Figure 2.5: Position of GCM in CBR mould
In this study, CBR testing was carried out on kaolin at liquidity indices (LI) of -0.5, 0, 0.5 and 1.0. The applied force - penetration curve was drawn for the test samples with GCM located at the different positions. GCM was position in a single layer at different depths of 0.2D, 0.3D and 0.4D below the upper surface (see Figure 2.5).
2.3 RESULTS AND DISCUSSION
VANE SHEAR TEST (VST)
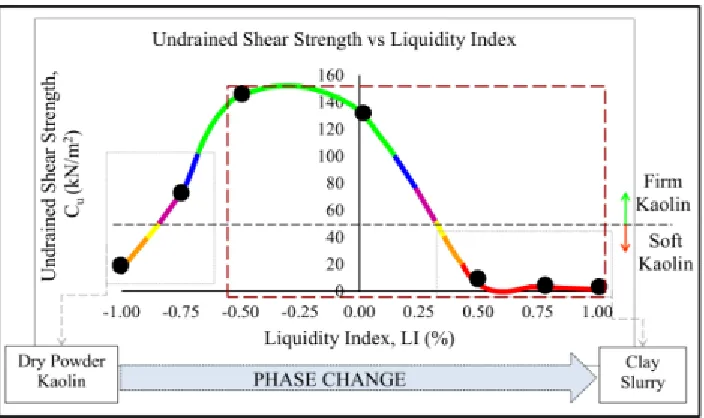
[image:7.597.191.404.95.223.2]The effects of increasing liquidity Index (LI) of the kaolin is to change the phase of the soil from solid to liquid (clay slurry) as shown in Figure 2.6.
Figure 2.6: Phase change of kaolin with liquidity index
Figure 2.7 shows the change in undrained shear strength of kaolin (from dry powder to clay slurry) with increasing liquidity index (LI). Colour code shaded on the line in the figure represents the consistency of soil sample according to undrained shear strength classification in Table 1. Green indicates the kaolin in a firm phase with the Cu in range 100 to 150kN/m2 and red shows the kaolin in
critical soft stage with the Cu below 20kN/m2, when kaolin is in very soft consistency.
[image:7.597.150.451.405.624.2]Construction Materials and Technology Series 1 2018 ISBN 978-967-2183-19-8
24
[image:8.597.124.476.205.414.2](20.65% moisture content). This continues to increases until it achieve the optimum moisture content of 27% (see Figure 2.7). This can be classified as stiff soil. However, shear strength decreases when the LI increase up to 1.0. At high moisture content, the soils become a slurry, which results in low undrained shear strength. The undrained shear strength of soil decreases to 2kN/m2 when the LI increase up to 1.0, this soil is at the liquid limit. This can be classified as very soft soil. These results showed that the liquidity index or moisture content affect the shear strength of the soils. The brown box shown in Figure 2.7 indicates the focus of the study area for this paper.
Figure 2.7: Effect of LI value on kaolin strength
CALIFORNIA BEARING RATIO (CBR)
Although this is not acknowledged as an academically sound test, the parameter from this test is used in the design of road pavements. The test is a quasi-bearing capacity test and the strength condition of the soil will determine the value obtained. The equilibrium CBR beneath a road pavement depends on several factors, such as the soil type, and sub-grade conditions such as the location of the water table (see Figure 2.8).
[image:8.597.135.462.553.750.2]Construction Materials and Technology Series 1 2018 ISBN 978-967-2183-19-8
25
Figure 2.9 shows the CBR values obtained for the study materials. For the original kaolin (control sample-without GCM) the figure shows that the CBR decreases with increasing liquidity index. This, as expected is due to the increased moisture content. Figure 2.9 also reflects the undrained shear strength values over the range of liquidity index. In order to illustrate this further the colour coding is shown on the CBR axis and follows the soil strength classifications based on the Cu.
[image:9.597.144.455.233.424.2]Besides that, Figure 2.9 also indicates the CBR value of the GCM compared to the stiff soil. The CBR of 14% for the GCM-S1 corresponds to a stiff soil. However, very much lower CBR values of 0.73% and 0% were obtained for polystyrene and sponge respectively.
Figure 2.9: CBR-liquidity index variation of study materials
a) Stiffness improvement of Kaolin with GCM
The effect of the use of both GCM-S1 and GCM-S2 on the CBR of kaolin was conducted for the range of LI (-0.5, 0, 0.5 and 1.0). For moisture contents beyond a LI of -0.5, the kaolin behaves as a soft soil. This is also demonstrated for shear strength in Figure 2.7, Figure 2.10 and 2.11 show the variations plotted on different scaled axis.
[image:9.597.147.454.546.728.2]Construction Materials and Technology Series 1 2018 ISBN 978-967-2183-19-8
26
Figure 2.10 with the larger scale (for LI range -0.5 and 0) indicates that with the increase in the GCM depth (d), the CBR value increases (see Figure 10). However, at zero liquidity index (LI=0) and beyond the CBR value decreases, when GCM-S1 and GCM-S2 achieve the respective optimised positions of 67mm (d/b of 1.34) and 45mm (d/b of 0.9). This observation demonstrates the usefulness of the GCM to enhance the poor CBR values of soft soil. Hence, the best position of GCM in kaolin at -0.5 LI achieved when GCM-S1 was placed at 82mm (d/b of 1.64) and 57mm for GCM-S2 (d/b of 1.14).
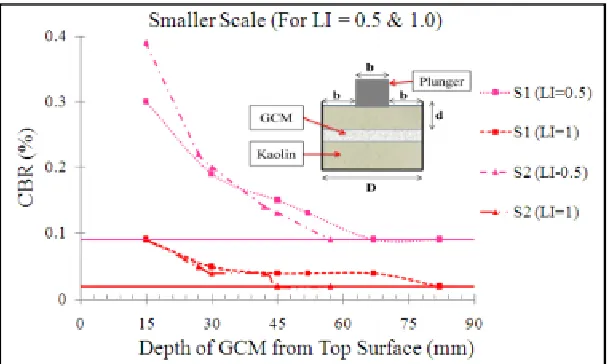
[image:10.597.147.453.343.525.2]Figure 2.11 (smaller scale) illustrates that the CBR decreases as the depth of GCM is increased from 15mm to 82mm for S1 and increases from 15mm to 57mm for S2. The result shows that the highest CBR value at the liquidity index 0.5 was achieved at 15mm depth (position of GCM from surface) about 0.3% for GCM-S1 and 0.4% for GCM-S2 with corresponding increases of 233% and 344%. The highest CBR value at liquidity index 1.0 for both GCM-S1 and GCM-S2 is 0.09% that is about 200% increase. The best position for GCM to improve the CBR value in soft kaolin was nearest to the specimen surface (at 15mm depth). These result showed that position and size of GCM enhances the CBR value of materials.
Figure 2.11: Effect of GCM position on CBR value of kaolin (with LI = 0.5 & 1.0)
Construction Materials and Technology Series 1 2018 ISBN 978-967-2183-19-8
27
b) Stiffness improvement of Polystyrene with GCM
Figure 2.12 shows the effect on the CBR when the GCM is positioned in polystyrene (simulating a soft soil that has lower CBR than kaolin). The CBR value decreases when the GCM position is further away from the specimen surface. However it is still higher than the CBR obtained for polystyrene without GCM (control sample). This is evidence that the stiffness of polystyrene is improved with the placement of the GCM. The highest CBR values of 1.40% and 1.32% were observed for both GCM-S1 and GCM-S2 when placed very near to the surface, representing a CBR increase of 92% and 81% respectively. The best mean position of GCM for use with polystyrene is at 0mm depth from surface. However it is noteworthy that it is not recommended to have the GCM with no overlying soil.
[image:11.597.134.462.344.549.2]c) Stiffness improvement of Sponge with GCM
Figure 2.13 shows the observations from the study of the application of both GCM-S1 and GCM-S2 to improve the CBR value of sponge. The result shows that the highest CBR value for both GCM-S1 and GCM-S2 is 0.075 % and 0.053%. The best position of GCM to improve the CBR value in sponge is at the specimen surface (0mm depth) with increasing 275% for S1 and 165% for S2.
Figure 2.13 Effect of GCM position on CBR value of sponge
2.4 CONCLUSION
In this study, a single layer of GCM placed at different position was evaluated in terms of their stiffness parameter (CBR value) and the important findings of this research are summarized below:
a) The CBR value of soil and artificial materials (polystyrene and sponge) increases with the application of GCM layer.
Construction Materials and Technology Series 1 2018 ISBN 978-967-2183-19-8
28
c) In this study, it was found that the position of the GCM gave an effect to the stiffness value of the materials. The best position for the stiff soil/materials need to be distance from the surface, otherwise the best position of the soft soil/materials must be near with surface. However it is noteworthy that it is not recommended to have the GCM with no overlying soil.
d) There is some evidence that the GCM with larger cell diameter helps draining of over stress kaolin.
The findings found that the GCM have to be positioned close to the surface where the undrained shear strength (Cu) is lower than 50kN/m2. Compared with good soil, GCM gave better
increases to more than 80%.
Construction Materials and Technology Series 1 2018 ISBN 978-967-2183-19-8
29 REFERENCES
[1] Tuan Ismail, T. N. H., Adon, R., Diman, S. F., D. & Devapriya, C. W. Innovative Green Technology and Product Meeting Geo-Environmental Challenges. Malaysia Technical Universities Conference on Engineering & Technology 2012 (MUCET 2012), Vol. 53, (2012), pp. 104-115.
[2] Adon, R., Bakar, I., Devapriya, C. W. & Zainorabidin, A. Overview of the Sustainable Uses of Peat Soil in Malaysia with some Relevant Geotechnical Assessments. International Journal of Integrated Engineering, Vol. 4, (2012), No. 3, pp. 38-46.
[3] Kolay, P.K., Sii, H. Y. and Taib, S.N.L. Tropical Peat Soil Stabilization using Class F Pond Ash from Coal Fired Power Plant. World Academy of Science, Engineering and Technology, 50, (2012).
[4] Huat, B. B. K., Maail, S. & Mohamed, T. A. Effect of Chemical Admixtures on the Engineering Properties of Tropical Peat Soils. American Journal of Applied Sciences, Vol. 2(7), (2005), pp 1113-1120.
[5] Duraisamy, Y., Huat, B. B. K., Muniandy, R. & Aziz, A. A. Compressibility Behavior of Fibrous Peat Reinforced with Cement Columns. International Conference on Construction and Building Technology. E - (09), (2008), pp 93-110.
[6] Barnes, G. 2nd. Ed. Soil Mechanics: Principle and Practice. Macmillan Pres LDT, London, (2012).
[7] Head, K. H. Manual of Soil Laboratory Testing. 1st. Ed. Pentech Press, London Ltd., Vol. 2, (1982).
[8] Hawkins, A. B. General Report: The Nature of Hard Rocks/Soft Soils. in Proceesing of the 2nd Geotechnics of Hard Soils – Soft Rocks, Evangelista & Picarelli, Balkema, Totterdam, (2000).
[9] Hussin, N. A. Correlation between CBR Value and Undrained Shear Strength from Vane Shear Test. Universiti Teknologi Malaysia: Bachelor Degree Thesis, (2008).
[10] JKR Malaysia. Manual on Pavement Structures, Arahan Teknik (Jalan) 5/85, 1985.
[11] Pardeep S. & Gill, K. S. CBR Improvement of Clayey Soil with Geo-grid Reinforcement.
International Journal of Engineering Technology and Advanced Engineering, Vol. 2(6), (2012), pp. 315-318.
[12] BS 1377, Part 7. Soil for Civil Engineering Purposes - Shear Strength Test. British Standards Institution, London, UK, (1990).
[13] BS 1377, Part 4. Soil for Civil Engineering Purposes – California Bearing Ratio Test. British Standards Institution, London, UK, (1990).
![Table 2.1: Values of undrained shear strength versus consistency (modified from [9]) Consistency Undrained shear](https://thumb-us.123doks.com/thumbv2/123dok_us/8752431.892201/2.597.92.509.340.601/table-values-undrained-strength-consistency-modified-consistency-undrained.webp)