Model-based Analysis of Ammonia Generation in
SCR-systems
Lukas Moltner
Department of Industrial Engineering, Management Center Innsbruck, Austria
Copyright © 2015 by authors, all rights reserved. Authors agree that this article remains permanently open access under the terms of the Creative Commons Attribution License 4.0 International License
Abstract
The selective catalytic reduction (SCR) of nitrogenous oxides is the most promising technique to meet prospective emission regulations of cars. Due to its toxic potential the reducing agent ammonia cannot be stored in a car but it can be carried in the form of an urea-water-solution (UWS) which is injected into the hot exhaust gas and reacts to ammonia. This formation of ammonia upstream the catalytic converter is responsible for the efficiency of the complete SCR-process-chain. This paper deals with the numerical analysis and description of interactions between droplets of the urea-water-solution and the exhaust gas. For the description of the droplets’ trajectories, a numeric model was developed, which considers, in contrast to previous surveys, the loss of the droplets’ mass due to evaporation of water and thermal decomposition of urea. The model for the droplets’ motion was extended by an evaporation model for binary fluids and additionally on a kinetic approach to describe the thermal decomposition. This model is able to determine the exact position of flying droplets, the droplets’ velocity, the composition and its current temperature in a gas flow. These parameters are substantial for further considerations of the interactions between droplets and hot surfaces, e.g. wall wetting.Keywords
Exhaust Gas After-treatment, Internal Combustion Engines, NOx, SCR1. Introduction
Diesel engines, in combination with modern charging and injection systems - due to their constant high torque over a wide speed range – deliver excellent driving performance. These characteristics increased the market penetration rate of diesel-driven passenger cars in Europe almost 50% during the last two decades [1]. The big challenge of further developments is to achieve future emission targets safely without dramatically increasing costs compared to competing gasoline engines [2]. Especially the compliance of the strictly limited nitrogen oxide emissions show, that diesel engines require much greater efforts than gasoline
engines. The emission limits EURO 6 in Europe and TIER 2 in the USA imply equal NOx-restrictions for gasoline and diesel engines.
The selective catalytic reduction (SCR) with ammonia is currently, the most effective technology for reducing nitrogen oxides in motor vehicles. The developed and partly established systems differ in the choice of the reducing agent. A major problem for the use in cars is that the entrainment of a separate reducing agent tank is required. Possible leaks in the tank and the piping system can be classified as very harmful due to the toxicity of ammonia. Therefore, only SCR-systems which use NH3-releasing substances are in production or development, e.g. Urea. This substance shows a much smaller toxicological potential and can be carried as an aqueous solution and also be dosed accordingly. Currently, the infrastructural development of a distribution network of urea-water solution (UWS) is taking place. The UWS consists of 32,5 wt.-% urea, standardized to DIN 70700 and is sold under the brand name AdBlue®.
The central importance in implementing a SCR-system is the insertion of the UWS before the catalytic converter. Efficiency of SCR-systems, moderate consumption of the reducing agent, space requirements and complexity, depend on the sufficient ammonia generation and homogenization upstream the catalytic converter.
The formation mechanism of ammonia out of urea is generally described by two single reactions which take place after the evaporation of water out of the droplet and the melting of urea. The first reaction, Eq. (1), represents the thermolytic decomposition of urea to ammonia and isocyanic acid. The following reaction, Eq. (2), shows the hydrolysis of the formed intermediate to another mole of ammonia and CO2and the changes in enthalpy, hi.
(
NH CO2 2)
↔NH3+HNCO 185Therm
kJ h
mol
= +
(1)
3
2 2
HNCO H O+ ↔NH CO+ 96
Hydro kJ h
mol = −
(2)
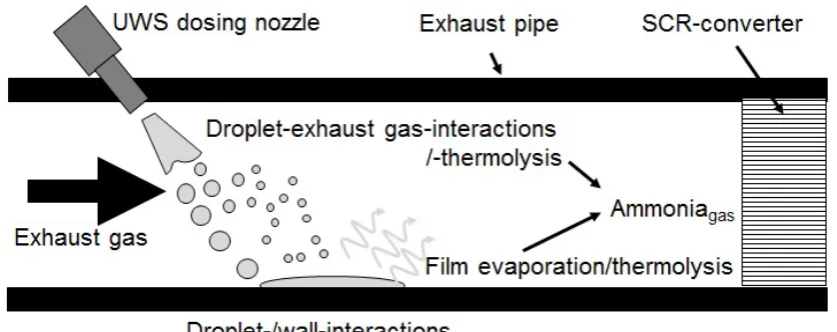
Figure 1. Process chain of a SCR-system
The objective is to describe the various mechanisms of generation and homogenization of ammonia, to provide a basis for the interpretation of mixing or processing routes for the reducing agent. In detail, the injection of the UWS into the exhaust gas, the interaction with the exhaust gas, interactions at hot surfaces in the exhaust system, the separation of the urea-water solution and the chemical sub-steps of the urea decomposition and ammonia generation are of prime importance. The distinction from previous work is the basic consideration for the relevant individual processes that will serve as a basis for further scientific treatises and developments.
2. Fundamentals
[image:2.595.97.516.77.243.2]The basis of the droplet-motion-model supplies the balance of forces acting on a drop in a gas flow, figure 2. From this balance the equation of motion can be derived. For the multi-dimensional motion model, the motion equation is solved for each spatial-axis and determines the droplet velocity and the droplet position. The droplet moves with an initial velocity in the direction of injection.
Figure 2. Balance of forces at a moving droplet in a gas flow
The total force acting on the moving drop is made out of the sum of the single drag forces Fg and the weight FWT and
causes according to Newton's principle of action, a change in velocity , Eq. (3).
dr
dr
du
g wtm
F F
dt
=
+
(3) The drag force Fg is the product of the projected area Apr,
the drag coefficient for drops cdr and the dynamic pressure.
The calculation of the drag coefficient requires the calculation of the Reynolds number using the droplet diameter DTr, the exhaust gas’ density ρg and the dynamic
viscosity ug. For droplets with a Reynolds number Redr< 800
counts Eq. (4)[3]:
(
0,687)
24 1 0,15*
dr dr
dr
c
Re
Re
=
+
(4)And for Reynolds numbers Redr> 800 supplies Eq. (5) the
drag coefficient.
0,44
dr
c
=
(5) The acting force of gravity and buoyant force Fwt isdetermined by the drop volume Vdr, the droplet density ρdr
and the gas density. Substitutions and transformations conclude in Eq. (6), which describes after integration the drop velocity.
(
)
2
* *
3 * * 1 *
4 *
g dr dr g
dr
g dr
dr dr dr
µ c Re
du u u g
dt D
r
r
r
= − + −
(6)
The motion vector is the result of integrating again, Eq. (7):
dr dr
dx
u
dt
=
[image:2.595.63.292.557.736.2]evaporation or chemical reactions are not taken into account. The next chapter deals with the implementation of an evaporation model and a kinetic approach to extend the capabilities of the model
3. Scientific Approach and Methodology
3.1. Droplet Evaporation
For modeling of sprays the Lagrangian approach was chosen. That means that the calculation of trajectories and the heat and mass transfer happens only for a statistically representative number of drops inside a magnitude and not for the whole droplet collective.
Nusselt describes that the evaporation takes place as a diffusion phenomenon in a thin boundary layer between the droplet and the surrounding gas, as long as the relative humidity of the surrounding gas is < 1. If the droplet is circulated continuously by gas with low humidity the evaporation occurs faster than in a statically gaseous atmosphere. From experiments with drops of different liquids and diameter classes Ranz and Marshall [5] developed the dimensionless equation Eq. (8) which describes the mass transfer coefficient km by using the
Sherwood number Sh, diffusion coefficient D, the Reynolds number Redr and the Schmidt number Sc.
1 1
( ) 2 3
( ) ( )
*
2 0,6*Re *
M dr t
t t
k
D
Sh
Sc
D
≡
= +
(8)After computing the mass transfer coefficient kM, the loss
rate of the droplets’ liquid can be determined by Eq. (9). The diffusion of the vapour phase into the exhaust gas takes place on the surface of the droplet Asf and is quantitatively
influenced by the mass transfer coefficient kM and the
expression of the driving power for diffusion phenomena (term in square brackets in Eq. (9)).
( ) ( ) ( ) ( ) ( ) ? 2
*
*
*
gdr g v T
v T t t M H O sf t g dr t
X
p
p
dm
k
A
M
dt
R
T
T
= −
−
(9)3.2. Non-isothermal Kinetic Decomposition of Urea
After the injection of the droplets into the exhaust gas stream, the droplets are heated by convective heat transfer from the exhaust, and evaporation starts. In the first stage the water evaporates, leaving behind urea. The direct decomposition out of aqueous urea solution without prior separation into the water and urea takes place only in a very limited extent. It is confirmed that urea is mainly formed in the two reaction steps according to Eq. (1) and (2). For the quantitative description of the thermolytic decomposition according to Eq. (1) a mathematic power law according to Eq. (10) is applied. This power law describes the reaction rate r as a function of the reaction rate constant ktherm (T) and
the influence of the reacting agent concentration CUrea.
(
k c, Urea)
therm T( )
*
Ureanr
=
k
c
(10)The representation of the reaction rate constant’s temperature dependence for the thermolysis is carried out according to Arrhenius, Eq. (11), and for the hydrolysis according to Eq. (12) [6].
3
23066
4,9*10 *exp
*
thermk
R T
=
−
(11)5
62220
2,5*10 *exp
*
hydrk
R T
=
−
(12)The self-adjusting droplet temperature is determined by the balance of heat, which is supplied by the exhaust gas and the heat consumption caused by the endothermic reaction, Eq. (13).
(
)
(
( ))
( ) ( ) ( ) ( ) 0 3 * * * * * * − + −= w g Tr Tr t Therm
Tr t p Tr t Tr t p Tr f
N t s
H
k A T T m m h
dT
dt m c m c M
(13) The heat transfer rate kw is calculated by using Reynolds number, Prandtl number, and the heat conductivity of the surrounding gas λg, Eq. (14)
1 1
( ) 2 3
( ) ( )
*
2 0,6*Re *Pr
w dr t
t t
g
k D
Nu
≡
λ
= +
(14)In this way, the expanded model is finally able to compute the loss of mass by evaporation and chemical reaction and realizes a more precise calculation of the droplets motion. The final computation was done by a conventional numerical solver based on Euler.
4. Discussion of Results
4.1. Evaporation and Thermal Decomposition of a Non-moving Droplet
constant of the thermolysis increases too and accelerates the reaction. A second steady state level is reached as soon as a thermal equilibrium in the droplet between heat input and the applied heat of reaction is adjusted. This steady state
[image:4.595.98.518.138.404.2]temperature is very close to the ambient gas temperature. The reason for this is due to the high heat transfer between exhaust gas and droplet and the moderate required heat for the reaction [8].
Figure 3. Graphs of the drop mass of pure water and UWS and the droplet temperature of UWS calculated at Tg = 600 K, initial droplet
temperature Tdr = 303 K, urel = 0 m/s, Ddr0 = 70 μm, frequency factor k0 = 4,9 * 103 1/s and activation energy EA Therm = 23.066 J/mol [9]
Figure 4. Thermolysis of urea and hydrolysis of isocyanic acid after the evaporation of water. Tg = 600 K, initial droplet temperatureTdr = 303, urel = 0 m/s,
[image:4.595.90.522.437.719.2]4.2. Hydrolysis of Isocyanic Acid
The simulation describes also the formation of ammonia out of isocyanic acid which is generated during the first thermolytic sub-step. Figure 4 shows the progress of the ammonia generation continued from the calculation shown in Figure 3.
After a very short period of heating up and thermolytic decomposition of urea the hydrolysis of isocyanic acid starts. The required water for the hydrolysis is delivered mainly by the exhaust gas as a product of combustion of hydrocarbons. The consideration of these two chemical reactions shows that the hydrolysis is slower by a multiple compared to the thermolysis at all temperatures and these results in an incomplete formation of ammonia upstream the catalytic converter.
4.3 Model validation and plausibility check
To prove the validity of the described model, an experiment by laser diffraction was conducted. For this purpose the droplet size distribution in the mixing zone was determined 15 cm downstream of the UWS-injection.
According to the model-based calculations a small part of the droplet spectrum must follow directly the exhaust gas and can be detected by laser diffraction. The droplets of larger diameter classes are undetectable due to its inertia they interpenetrate the exhaust flow, hit the opposite wall and deposit there, figure 5.
[image:5.595.314.549.170.270.2]Figure 6 shows the comparison of the results of the simulation model and the experimental output. The experiment and the simulation results show that the droplets` size distribution decreases significantly 15 cm downstream the UWS-injection, which is explainable with the wall contact and deposition of bigger size classes of the initial droplet spectrum.
Figure 5. Simulated droplet´s trajectories till the measuring position of laser
[image:5.595.88.523.429.697.2]The comparison shows generally a good conformity of the diameter classes which are able to follow the exhaust gas flow between the model-based calculations and the experiment. Only the relative frequency around the relative maximum shows inaccuracies. The reason for this might be the method of analysis with discrete diameter classes and on the other hand deviations caused by the resolution of the laser diffraction measurement.
Figure 7. Trajectories of different droplets each with an initial diameter Ddr0 = 70 μm at Tg = 600 K, initial droplet temperature Tdr = 303 K, ug = 25 m/s,
injection angle 45°, initial droplet velocity of 25 m/s, k0Therm = 4,9 * 103 1/s and EA Therm = 23.066 J / mol [9]
4.4. Trajectories of a Single Moving Droplet in the Exhaust Gas
The results of the preliminary study with a stationary droplet in figure 3 and 4 show that, depending on the initial droplet size the drop evaporation as well as the thermal decomposition of urea result in significant mass losses.
This theoretical analysis describes the effect of the decreasing droplet mass to the trajectory of a freely moving droplet in a gas flow.
Figure 7 shows comparatively the results of four different approaches for the motion of a single droplet. It gets injected into a hot gas flow with an angle of 45° and an initial velocity of 25 m/s. It shows the distance which the single droplet traveled in the axial as well as radial direction for:
a droplet with constant mass,
a pure water droplet,
a UWS-droplet including the evaporation of water,
and a UWS-droplet including mass losses caused by evaporation and thermolytic decomposition.
Figure 7 shows that the trajectories differ clearly for the drop with constant mass, pure water droplets from the flight paths of droplets with evaporation and thermolysis. In particular, the trajectory of the droplet with constant mass reaches a substantially larger depth of penetration into the exhaust flow as all other models. In contrast, the pure water droplet achieves due to the large mass loss a much lower penetration depth.
The comparison shows that calculations which are based on droplets with constant mass result in significant deviations of the trajectories of UWS-droplets. Simplified simulations, working with the properties of pure water, are also subject to inaccuracies. The reason for these
inaccuracies is the lack of lowering vapor pressure by the dissolved urea, which leads to a too rapid mass loss and a disproportionately strong deflection. The two models which are working with the properties of UWS and including evaporation and/or evaporation and thermolysis show only marginal differences in the trajectories. The reason for this is the chosen initial droplet diameter for this comparison. This is caused by the fact that the thermal decomposition of urea plays only a minor role, whereas the drop evaporation dominates.
4.5. Trajectories of Droplets in the Mixing Section
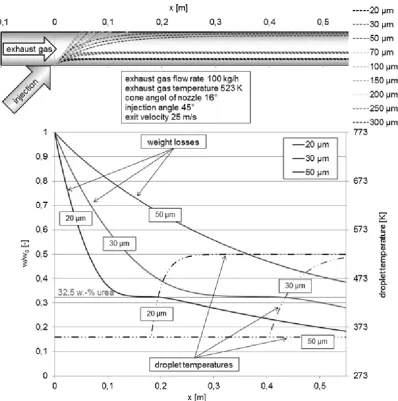
Figure 8 (above) shows the trajectories of different initial droplet sizes with an exhaust gas flow rate of 100 kg/h and a temperature of 523 K inside a straight mixing section with a diameter of 60 mm and a length of 550 mm. It illustrates that only droplets with small diameters can follow the exhaust gas flow, while bigger droplets interpenetrates the gas flow and hit the opposite wall. The simulation model is able to deliver a critical diameter, which represents the biggest possible droplet, which is deflected by the gas flow and will not hit the opposite wall. This critical diameter depends mainly on the gas velocity and density. For this considered operation point this critical diameter is 57 μm.
Figure 8 (below) shows the weight losses of droplets with
an initial diameter of 20, 30 and 50 μm. These diameters are
smaller than the critical diameter and get deflected by the exhaust gas flow. The graphs representing the weight losses
indicates, that the even the smallest diameter class of 20 μm
does not decompose completely and would enter the catalytic converter as a liquid urea droplet. The content of
water in droplets with a size of 50 μm does not even
Figure 8. Trajectories of different droplet diameter (above) and standardized weight loss and the droplet temperature (below) inside the mixing section
5. Conclusions and Forecast
For description of the droplets flight paths in SCR-systems a validated numeric model was developed, which takes on the contrary to previous surveys, the loss of the droplets` mass due to evaporation of water and thermal decomposition of urea into account. The model for the droplets` motion was extended by an evaporation model for binary fluids and by a kinetic approach to describe the thermolysis of urea. This model is able to determine the exact position of the free-flying droplet, the droplets` velocity, the composition and its current temperature. These parameters are substantial for the next consideration, the interactions between droplets and hot surfaces. Especially the wall-wetting and the creation of a wall-film will be investigated because these effects offer opportunities to increase the ammonia generation before the catalytic converter.
For a droplet which moves freely in a hot gas stream could be proved that mass losses due to evaporation or thermal decomposition are responsible for a significant change of the
trajectories compared to droplets with constant mass. Numerical models which use the characteristic data of water to approach the behavior of UWS result also in distinct inaccuracies.
The developed and validated model is not only able to describe trajectories, but it also supplies data of the droplet, which is relevant for predictions in case of wall-contact. For the moment of the droplet impact the model calculates the current droplet mass, diameter, velocity, temperature, viscosity… and allows predictive statements regarding reducing agent / wall interaction.
Another possible application of the model could be the design of pistons and combustion chambers of engines using gasoline direct injection (GDI) to improve either mixture homogenization or stratification.
REFERENCES
[image:7.595.108.507.74.476.2]Emissionsanforderungen für Diesel
SUV`s,“ Forschungsgesellschaft Kraftfahrwesen mbH Aachen, 15. Aachener Kolloquium Fahrzeug- und Motorentechnik, Tagungsband Nr. 1506, 2006.
[2] G. Merker, Verbrennungsmotoren, Wiesbaden: B. G. Teubner, ISBN-10 3-8351-0080-7, 2006.
[3] W. Kümmel, Technische Strömungsmechanik: Theorie und Praxis, B.G. Teubner Verlag, ISBN 978-3-8351-0141-8, 2007.
[4] S. Fischer, AdBlue-Aufbereitung vor dem SCR-Katalysator, Entwicklung und Validierung eines 3D-Simulationsmodells, Vortrag zum Forschungsprojekt am Institut für Fahrzeugantriebe und Automobiltechnik der TU Wien, 30.6.2009, 2009.
[5] W. Ranz und W. Marshall, Evaporation from drops, Chem.
Eng. Prog., Vol. 48, 1952.
[6] F. Birkhold, „Selektive katalytische Reduktion von Stickoxiden in Kraftfahrzeugen: Untersuchung der Einspritzung von Harnstoff-Wasserlösung,“ Dissertation an der Universität Stuttgart, 2007.
[7] S. Yim, Decomposition of Urea into NH3 for the SCR-Process, Industrial & Engineering Chemistry Research: American Chemical Society, Volume 43, Page 4856-4863, 2004. [8] G. Wozniak, Zerstäubungstechnik, ISBN 3-540-41170-4:
Springer, 2003.
![Figure 3. Graphs of the drop mass of pure water and UWS and the droplet temperature of UWS calculated at Ttemperature Tg = 600 K, initial droplet dr = 303 K, urel = 0 m/s, Ddr0 = 70 μm, frequency factor k0 = 4,9 * 103 1/s and activation energy EA Therm = 23.066 J/mol [9]](https://thumb-us.123doks.com/thumbv2/123dok_us/8752326.892176/4.595.90.522.437.719/figure-graphs-temperature-calculated-ttemperature-droplet-frequency-activation.webp)
![Figure 6. Size distributions of the primary spray compared with the measured and calculated secondary spray after wall contact [9]](https://thumb-us.123doks.com/thumbv2/123dok_us/8752326.892176/5.595.88.523.429.697/figure-distributions-primary-compared-measured-calculated-secondary-contact.webp)
![Figure 7. Trajectories of different droplets each with an initial diameter Dinjection angle 45°, initial droplet velocity of 25 m/s, kdr0 = 70 μm at Tg = 600 K, initial droplet temperature Tdr = 303 K, ug = 25 m/s, 0Therm = 4,9 * 103 1/s and EA Therm = 23.066 J / mol [9]](https://thumb-us.123doks.com/thumbv2/123dok_us/8752326.892176/6.595.101.509.74.320/trajectories-different-droplets-diameter-dinjection-velocity-droplet-temperature.webp)