Noise source localisation in a car
environment
Fazenda, BM, Gu, F, Ball, A and Guan, L
Title Noise source localisation in a car environment
Authors Fazenda, BM, Gu, F, Ball, A and Guan, L
Type Conference or Workshop Item
URL This version is available at: http://usir.salford.ac.uk/9436/
Published Date 2009
USIR is a digital collection of the research output of the University of Salford. Where copyright permits, full text material held in the repository is made freely available online and can be read, downloaded and copied for noncommercial private study or research purposes. Please check the manuscript for any further copyright restrictions.
NOISE SOURCE LOCALISATION IN A CAR ENVIRONMENT
B. Fazenda Fengshou Gu Andrew Ball Luyang Guan
Diagnostics Engineering Research Group, School of Computer and Engineering, University of Huddersfield
1
ABSTRACT
Spurious noise (rattles, squeaks, etc) in the interior of car cabinets can be annoying, distractive and indicative of potential performance problems. Fault finding these problems can be difficult since the fault is intermittent and may not necessarily happen under test conditions. A 3 channel system that can record the fault and indicate its location within the cabinet is presented here. The system consists of a coincident microphone array that measures acoustic particle velocity along two orthogonal axes at its location. Detection and direction of noise can be obtained in real time or during post-processing using advanced signal analysis methods. Measurements inside a vehicle show that the very reflective nature of the sound-filed inside a car cabinet present a major challenge and that a combination of advance techniques from diagnostics engineering and room acoustics are required to reliably indicate the direction of the annoying sound.
2
INTRODUCTION
Sound source localisation is an important aspect of monitoring and control engineering with various applications such as environmental monitoring, noise control, medical instrumentation and surveillance to name a few. In these applications, accurate localisation of source direction and distance has been sought, and techniques are varied[1,2,3,4,5].
One such application presented here is the location of annoying noises in the interior of car cabinets. This paper presents the development of a 3 channel system that can record spurious noises and indicate its location within the cabinet, based on the ratio of level originated from the directional sensitivity pattern of the microphones. This is a contrast to the common application of spaced arrays that determine incoming direction of sound from an estimation of time delay of signals arriving at the different microphones.
3
SOURCE LOCALISATION METHODS
3.1 Spaced Microphone Arrays
Traditional methods for sound source localisation generally employ two or more acoustic probes in an array structure with known spacing between them. Extraction of source direction may then be obtained from time delay estimation (TDE) of signals arriving at each probe and/or steerable beam-forming. In time delay estimation, the directional information is extracted by examining the coherence between the signals arriving at each probe using a cross correlation approach. The time differences between the signals arriving at the microphones are directly related to the sound source-to-microphone propagation paths and this can be extracted from the peak value of the cross correlation. In the beam-forming methods a full directional scan is undertaken to determine source direction, which is defined from the maximum signal power for a given angle.
3.2 Coincident Microphone Arrays
An alternative approach to spaced arrays for source localisation may take the form of coincident microphone arrays. In this approach, the microphones are mounted as close as possible to form a virtual point probe. Given their spatially coincident placement, the signals arriving at each microphone are considered to be in phase at least up to frequencies where the wavelength becomes comparable to the spacing between their diaphragms. In the most common approach, the directional sensitivity of the microphones follows a cosine function as shown in Figure 1. In theory, three of such probes are superimposed to provide a measure which is proportional to the particle velocity in each of the three Cartesian directions (x,y,z). A fourth signal containing the total pressure at the probe completes the system (Figure 2). The directional sensitivity of each microphone encodes a level difference between the acquired channels which can be read as directional information. Further details on the conditioning and analysis of probe signals are indicated in section 4.
In [6], such a technique has been described which uses a beam-forming method to localise sound sources using a coincident microphone array. This method uses wavelet analysis to extract the direction of the source from the maximum peak of a 360 degree scan. The probe employed is a commercially available microphone which is sensitive to sound intensity in 3 dimensions. The technique exploits the spectral-temporal changes in the recorded signal and by decomposing the directional signal the maximum peak is identified as the source direction. The system is shown to detect source direction with a mean absolute error of about 7°.
Figure 1 - Polar Pattern for a bi directional microphone
Figure 2 – Representation of directional patterns for each signal in the coincident acoustic probe. X signal represents the front
represents the pressure component. The Z output representing the up been omitted.
4
NOISE SOURCE LOCALIS
4.1 The Soundfield microphone
The probe used in this work is readily available commercially from Soundfield [
The Soundfield microphone (SF) can be thought of as a 3 dimensional microphone, using a combination of 3 pressure gradient
and an additional pressure microphone
W+
Y+ Y-
0°
θ
X- X+
Polar Pattern for a
Representation of directional patterns for each signal in the coincident acoustic represents the front-back intensity, Y represents left-right
the pressure component. The Z output representing the up-down
NOISE SOURCE LOCALISATION SYSTEM
The Soundfield microphone
The probe used in this work is readily available commercially from Soundfield [9].
microphone (SF) can be thought of as a 3 dimensional microphone, using a gradient microphones covering each Cartesian direction (x,y,z) and an additional pressure microphone (w) with omni-directional polar pattern
90°
Representation of directional patterns for each signal in the coincident acoustic right intensity and W down intensity has
.
described in the previous section. In the soundfield microphone this behaviour is achieved using 4 microphone diaphragms arranged in a tetrahedral configuration and placed as close as possible to each other to reduce phase differences. According to the manufacturer, frequency dependent digital signal processing is further applied to compensate for the small distance that actually exists between the capsules (~12mm).
The signals are conditioned and converted into 4 output signals known as ‘B-Format’ representing the particle velocity components in each of the three Cartesian directions X (front-back), Y (left-right) and Z(above-below) and one pressure signal, W, which is non-directional. In this application, only the horizontal components of the B-Format have been used to extract source incidence angle in the horizontal plane.
Per definition, the directional sensitivity of the W signal is constant for all angles. The X and Y signals follow a cos(θ) and sin(θ) function respectively with origin at 0° - see Figure 2.
These three signals are converted into a digital stream which is analysed using a signal analysis algorithm developed in Matlab.
4.2 Direction detection algorithm
This preliminary work shows a simple detection algorithm based on direct analysis of the input signals. Both real-time and post-processing algorithms use the same signal analysis principle described below.
The magnitude of signals arriving from the front, back, left and right directions are obtained by forming a cardioid sensitive microphone pointing in each direction. These directional sensitivity patterns are obtained directly from the microphone signals using a combination of each bi-directional microphone pattern and the omnidirectional one:
= + (1a)
= − (1b)
= + (1c)
ℎ = − (1d)
Figure 3 – Magnitude envelope for directional signals at the microphone. The incoming direction is estimated from the relative level difference between front/back and left/right. Only signals above a given threshold (red line) are considered for analysis.
The envelopes in Figure 3 clearly show the sections of the noise signal arriving at the microphone from the 4 directions. In the case pictured, the source is at 0° on axis, that is, at the front of the microphone array. Note, the front signal is much larger than the back, and the left and right signals have similar magnitude – this indicates a source near on axis to the front of the probe.
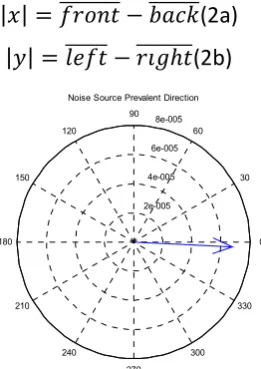
A vector containing the magnitude and direction (Figure 4) of the noise source can now be determined for each section of the signal that is above a given threshold (dotted line):
= − (2a)
= − ℎ(2b)
Figure 4 – Display of estimated incoming source direction. Vector angle and magnitude indicate incoming source direction and strength respectively.
0 0.5 1 1.5 2 2.5 3 3.5 4 4.5 5
0 1 2
x 10-4 FRONT
seconds
0 0.5 1 1.5 2 2.5 3 3.5 4 4.5 5
0 1 2
x 10-4 BACK
seconds
0 0.5 1 1.5 2 2.5 3 3.5 4 4.5 5
0 1 2
x 10-4 LEFT
seconds
0 0.5 1 1.5 2 2.5 3 3.5 4 4.5 5
0 1 2
x 10-4 RIGHT
seconds Noise source signal Magnitude
2e-005 4e-005 6e-005 8e-005 30 210 60 240 90 270 120 300 150 330 180 0
[image:6.595.238.369.517.702.2]5 RESULTS
A set of measurements were taken in the interior of a family size car. A diagram of test
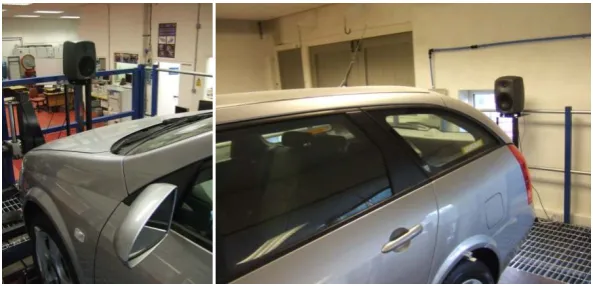
source positions in the cabinet is shown in Figure 9. The microphone has been positioned between the front headrests, in a central position within the cabinet (Figure 5).
Figure 5 – Microphone placement inside the car and between the two front headrests. On-axis direction points straight ahead.
The system was tested under two configurations: Offline testing, where signals were acquired, stored and post processed; and Real time testing where signal acquisition, analysis and display were performed instantly.
5.1 Off line testing
Measurements were taken of a small size loudspeaker replaying a noise file consisting of a ‘squeak’ noise. The small speaker was positioned inside the car at the various positions indicated in Figure 9. Outside the car, 2 larger loudspeakers replayed pink noise to represent road and background noise. This is shown in Figure 6.
Figure 6 – Positioning of noise sources ahead and behind vehicle to generate road and background noise. Pink noise was being reproduced.
[image:7.595.76.192.229.314.2] [image:7.595.77.374.500.643.2]Figure 7 – First stage acquisition signal. The pressure at the microphone is presented.
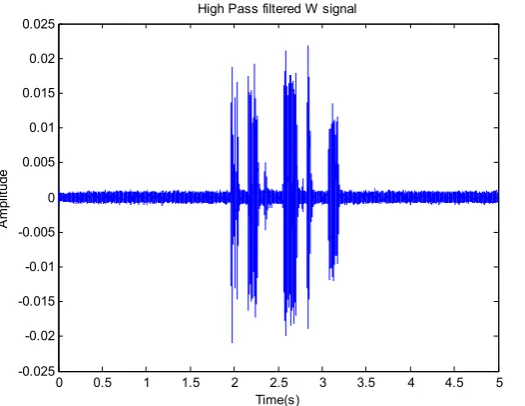
To reveal the noise source inside the car, a high pass filter set at 1000Hz has been applied to the captured data.
Figure 8 – Second stage acquisition data. Post high pass filtering to remove road and background noise.
The smooth envelopes shown in Figure 3 were obtained by applying a moving average filter on the data, and the incoming direction of the source is then obtained as explained in section 4.2.
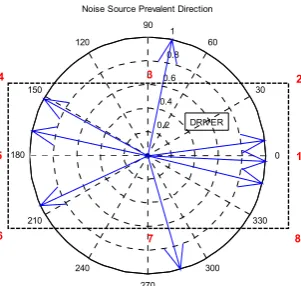
The 8 direction estimations tested inside the car are shown in Figure 9 and compared to the expected directions indicated in red numbers.
0 0.5 1 1.5 2 2.5 3 3.5 4 4.5 5
-0.2 -0.15 -0.1 -0.05 0 0.05 0.1 0.15 0.2 0.25
Time(s)
A
m
p
lit
u
d
e
W signal waveform picked up at the microphone
0 0.5 1 1.5 2 2.5 3 3.5 4 4.5 5
-0.025 -0.02 -0.015 -0.01 -0.005 0 0.005 0.01 0.015 0.02 0.025
Time(s)
A
m
p
lit
u
d
e
[image:8.595.87.350.353.556.2]Figure 9 – Diagrammatic representation of test setup inside car. Original source positions are indicated in red numbers. Estimated incoming source direction for each are indicated using the vectors (in blue). Source strength (vector magnitude) has been normalised.
Estimation of incoming direction is reasonably accurate, except for positions 2 and 8. It is thought that these directions are strongly affected by very early reflections from the windscreen, which alter the signal levels at the microphone. Directions 4,5 and 6, at the back of the vehicle, have an empty space behind (the car tested is an ‘estate’) thus the reflections do not affect these positions as strongly. Given that the microphone was positioned between the front seat headrests, these may also affect the signals at the microphones. In future work, an optimised position in the cabinet is sought.
5.2 Real-Time Source Direction Estimation
[image:9.595.231.382.122.265.2]The system has been developed to analyse incoming time frames of data. Each frame is composed of 8192 samples corresponding to 0.2 seconds. The analysed direction of the noise source is indicated by a stem vector. An average mode has been implemented to accumulate the directions with most recurring results. Results for different source directions and noise source level are shown in the following diagrams. A 3D directional diagram has been added to make use of the height information available with the microphone used.
Figure 10 – Real time display panel.
6 CONCLUSIONS
0.2 0.4 0.6
0.8 1
30
210
60
240 90
270 120
300 150
330
180 0
Noise Source Prevalent Direction
DRIVER
1 3
5
7 8
6
[image:9.595.78.282.571.672.2]A system has been developed to localise a noise source inside a car cabinet. The system is based on simple rules of level ratios and directional patterns obtained from a 4 diaphragm coincident microphone array that is capable of measure sound particle velocity in the 3 Cartesian directions.
Signal analysis is performed using mathematical rules that are computational cheap and simple to implement making this system realistically implementable in a portable stand-alone unit.
Test results show that the system is capable of determining the general direction of the noise source both using post-processing as well as real time methods, whilst in the presence of background noise external to the car cabinet. It has been identified that one of the main challenges for such a system is to achieve a correct analysis which is immune to the highly reflective nature of the car cabinet. Further work is now being undertaken to improve localisation in the presence of reflections. Authors are also working on a system to characterise and classify the nature of the noise and the type of material involved in generating it.
7 REFERENCES
[1] J. Chen, L Yip, J. Elson, H. Wang, D. Maniezzo, R.E. Hudson, K. Yao, D. Estrin, “Coherent
acoustic array processing and localisation on wireless sensor networks”, IEEE Proceedings,
vol. 91, issue 8, pp. 1154 -1162, Aug 2003.
[2] T. Scott Brandes and Robert H. Benson, Soundsource imaging of low-flying airborne targets
with an acoustic camera array, Applied Acoustics, Volume 68, Issue 7, July 2007, Pages
752-765
[3] Reinhard Blumrich and Jürgen Altmann, Medium-range localisation of aircraft via triangulation
Applied Acoustics, Volume 61, Issue 1, September 2000, Pages 65-82
[4] YC Choi and YH Kim, “Near field impulsive source localization in a noisy environment”, J. Sound and Vibration, 303, 209-220, 2007.
[5] K. Nakadai, H.G. Okuno and H. Kitano, “Real-time sound source localization and separation for robot audition”, Kitano Symbiotic System Project, ERATO, Japan Science and Technology Corp., Tokyo, Japan.
[6] B. Gunel, H. Hacihabibouglu, and A.M. Kondoz, “Wavelet packet based analysis of sound fields in room using coincident microphone arrays”, J. Applied Acoustics, in press.
[7] Yano h., Ohta t., Yokoyama s., Tachibana h., “Sound Source Localization by 3-D Sound Intensity Measurement using a 6-channel Microphone System. Part 1 : Principle and Basic Applications”, Proceeding of the Internoise 2008, Shanghai, China
[8] Ohta t., Yano h., Yokoyama s., Tachibana h., “Sound Source Localization by 3-D Sound Intensity Measurement using a 6-channel microphone system. Part 2: Application in room acoustics”, Proceeding of the Internoise 2008, Shanghai, China