SIMULATION OF LIQUID-GAS FOR CPO-METHANOL MIXING PROCESS IN BUBBLE COLUMN REACTOR
MOHD SAIFUL BIN SALEH
A project report submitted in partial fulfillment of the requirement for the award of the
Degree of Master of Mechanical Engineering
Faculty of Mechanical and Manufacturing Engineering Universiti Tun Hussein Onn Malaysia
v
ABSTRACT
The computational fluid dynamics (CFD) highly concern in understanding the complexity hydrodynamics of bubble column. Research on superheated methanol very important in investigate influence towards biodiesel production. The aim of simulation is to find the effect of various size of holes distribution and velocities superheated methanol towards crude palm oil (CPO) in bubble column reactor to predict the effect towards reaction rate between this materials. Superheated methanol gas was dispersed through bubble column reactor contains liquid crude palm oil. This process occurs at atmospheric pressure and temperature of 290°C. This analysis used ANSYS FLUENT fluid flow to simulate and compute the mathematical problem. According to the result from turbulent transient analysis of Volume of Fluid model (VOF), the value contact surface area and gas holdup is highly indicated at model C which is this model provide an open area ratio A=4.76% and at 6 m/s of velocity.
ABSTRAK
Computational Fluid Dynamic (CFD) amat penting dalam memahami hidrodinamik yang kompleks di dalam bubble column reactor. Kajian berkaitan gas methanol panas lampau amat penting bagi menyelidiki kesan terhadap pengeluaran biodiesel. Tujuan simulasi ini adalah untuk mencari kesan daripada saiz lubang masukkan dan halaju gas methanol yang berbeza terhadap minyak mentah kelapa sawit di dalam
reaktor bagi mengesan kesan terhadap nisbah reaksi diantara dua bahan ini. Gas panas lampau methanol disalurkan ke dalam reactor yang mengandungi minyak mentah kelapa sawit. Proses ini dilaksanakan pada tekanan atmosfera dan pada suhu 290°C. Analisis ini menggunakan ANSYS FLUENT bagi membuat simulasi serta menyelesaikan masalah berdasarkan penyelesaiaan matematik secara berkomputer. Keputusan yang diperolehi dengan menggunakan “transient analysis” bagi “Volume of Fluid model (VOF)”, Nilai paling tinggi bagi “contact surface area” dan “gas
holdup” diperolehi pada model C dengan nisbah luas kawasan yang terbuka, A=4.76%, pada halaju 6 m/s. Walaupun peratusan nisbah luas kawasan terbuka bagi model ini lebih tinggi berbanding model lain, namum dengan susunan lubang yang sistematik, ianya dapat mengelak buih bergabung seterusnya meningkatkan nilai “contact surface area” dan “gas holdup”. Walau bagaimanapun, keputusan juga menunjukkan bahawa nilai maksimum bagi “turbulent dissipation rate” diperolehi
vii CONTENTS TITLE DECLARATION DEDICATION ACKNOWLEDGEMENT ABSTRACT ABSTRAK CONTENTS LIST OF TABLES LIST OF FIGURES
LIST OF SYMBOLS AND ABBREVIATIONS LIST OF APPENDICES
i ii iii iv v vi vii x xi xiii xiv CHAPTER 1 INTRODUCTION
1.1 Research background 1.2 Problem statement 1.3 Objective
1.4 Scope of study 1.5 Significant of study
1 2 3 3 3 4 CHAPTER 2 LITERATURE REVIEW
2.1 Flow structure and liquid circulation pattern
2.2 Hydrodynamics regime 2.3 Gas hold up
2.3.1 Effect of superficial gas velocity towards gas hold up
2.4 Mixing time 2.5 Sparger design
2.6 Bubble column geometry
2.6.1 Effect of H/D ratio
2.7 Mixing characteristics factors (W) and interfacial area
2.8 Crude palm oil 2.9 Methanol
2.10 Non-catalytic method 2.11 Supercritical liquid
15 16 17 18 19 20 CHAPTER 3 METHODOLOGY
3.1 Flow chart 3.2 Pre-processor
3.2.1 Model geometry 3.2.2 Parameter for analysis 3.2.3 Meshing
3.3 Solution setup
3.3.1 Boundary conditions 3.4 Solver
3.5 Post-processing
21 22 24 24 26 26 30 30 32 32 CHAPTER 4 RESULT AND DISCUSSION
4.1 Result validation 4.2 Contact Surface Area
4.2.1 Prediction contact surface area at velocity 2 m/s
4.2.2 Prediction contact surface area at velocity 4 m/s
4.2.3 Prediction contact surface area at velocity 6 m/s
4.3 Gas holdup
4.3.1 Effect of velocity towards gas holdup
4.3.1.1 Prediction gas holdup design A
ix
4.3.1.3 Prediction gas holdup design C
4.3.2 Effect of open area ratio and distributor holes size
4.4 Turbulent dissipation rate
4.5 Hydrodynamics behavior and flow pattern 4.5.1 Volume of fraction vapor methanol 4.5.2 Facet average phase volume
fraction methanol 4.5.3 Velocity magnitude
41
43 46 47 47
49 50 CHAPTER 5 CONCLUSION AND RECOMMENDATION
5.1 Conclusion 4.2 Recommendation
54 54 55
LIST OF TABLES
2.1 3.1 3.2 3.3
3.4 3.5 3.6 4.1 4.2
Properties of palm oil Geometry of bubble column Geometry of spargers
Material and thermal properties of bubble column
Meshing statistics Mesh parameters
Summary of boundary conditions Turbulent dissipation rate
Facet average phase volume fraction methanol
18 25 25
xi
LIST OF FIGURES
2.1 2.2 2.3 2.4 2.5 2.6 2.7 2.8 2.9 2.10 2.11 2.12 3.1 3.2 3.3 3.4 3.5
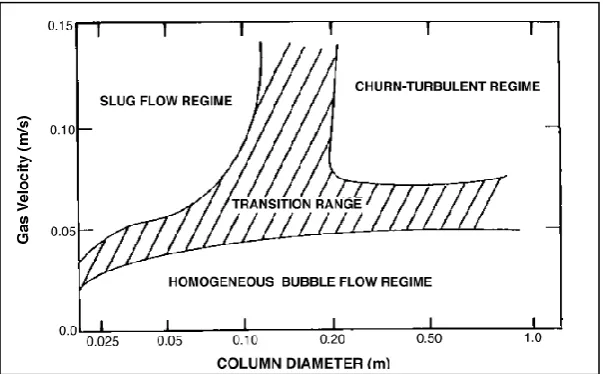
Liquid circulation patterns in bubble columns Flow regime map for bubble columns
The flow regime observed in gas-liquid bubble column reactors
Definition sketch of flow regimes in bubble column
Overall gas holdup (εg) versus superficial gas velocity (Usg)
Effect of superficial gas velocity on gas hold up in air-water system
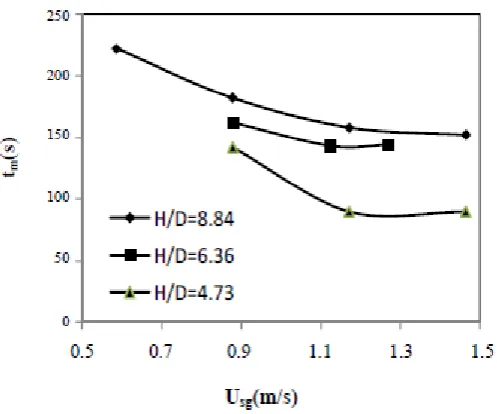
Mixing time (tm) versus superficial gas velocity (Usg) with H/D ratio as a parameter
Axial dispersion coefficient (Dax) versus
superficial gas velocity (Usg) with H/D ratio as a parameter
Gas distributor perforated plates
Gas holdup and flow regime transition using different aeration plates in an air-water system Overall gas holdup (εg) versus superficial gas velocity (Usg) with H/D ratio as a parameter Variation of mixing characteristic factor with phase velocities
CFD modeling overview Flow chart of methodology Cylindrical bubble column Type of holes arrangement Location of face sizing
3.6 3.7 3.8 4.1 4.2 4.3 4.4 4.5 4.6 4.7 4.8 4.9 4.10 4.11 4.12 4.13 4.14 4.15 4.16
Mesh distribution of bubble column and sparger Initial condition for vapor (red) and oil (blue) Plot of residual simulation progress
Gas holdup versus time at velocity 4 m/s Result of gas holdup at 4 m/s previous study Contact surface area versus time at velocity 2 m/s
Contact surface area versus time at velocity 4 m/s
Contact surface area versus time at velocity 6 m/s
Gas holdup versus time for design A Gas holdup versus time for design B Gas holdup versus time for design C Gas holdup versus time at velocity 2 m/s Gas holdup versus time at velocity 4 m/s Gas holdup versus time at velocity 6 m/s Volume fraction vapor
The contour of volume fraction vapor The contour of velocity magnitude mixture Velocity magnitude at 2 second
Vectors velocity magnitude at 0.5 second
xiii
LIST OF SYMBOLS AND ABBREVIATIONS
3D A CAD CFD CPO D,d Dax ƐG FAME H HD k-ε m s, sec tm Usg VG VL VOF W – – – – – – – – – – – – – – – – – – – – Three Dimensional Open area ratio
Computer Aided Design
Computational Fluid Dynamics Crude Palm Oil
Diameter
Axial dispersion coefficient Gas holdup
Fatty Acid Methyl Ester Height
Height of Dispersion k-epsilon
meter second Mixing time
Superficial gas velocity Volume of Gas
Volume of Liquid Volume of Fluid
LIST OF APPENDICES
APPENDIX
A B C D E F G H
TITLE
Table contact surface area design A Table contact surface area design B Table contact surface area design C Table gas holdup design A
Table gas holdup design B Table gas holdup design C Gantt chart project 1 Gantt chart project 2
PAGE
CHAPTER 1
INTRODUCTION
The understanding of complexity fluid dynamics in bubble column reactor is very important due to increasing of application in biodiesel process engineering include on demand to produce biofuel from crude palm oil. Currently, research in biodiesel process mainly use bubble column as device in analyses chemical reaction by experimentally or computationally to obtain the best result in producing new energy (biodiesel fuel) for industrial and mankind application. Regarding to Mahajan, (2010), the capability of bubble columns as gas–liquid contactors and as reactors enable the bubble column to use widely in a lot of application such as in chemical, petrochemical and biochemical industries. Recently, highly increasing of extensive studies based on demand of bubble column especially in field of biochemical engineering, biotechnology as well as in waste water treatment also in syngas conversion process.
Biodiesel is defined as the mono-alkyl esters of long chain fatty acids derived from renewable bio-lipids through the process of trans-esterification of triglycerides or esterification of free fatty acids. It involved low molecular weight alcohols such as methanol and ethanol in the presence of a catalyst to produce methyl or ethyl esters and glycerin (Tio, 2010). Trans-esterification reaction is a reverse reaction of the oil consists of triglycerides with alcohol to form fatty acid alkyl ester and glycerol. Glycerol was separated from the Fatty Acid Methyl Esters (FAME) with both products subsequently purified. The purified FAME was known as biodiesel while the purified glycerol was sold as a co-product.
glycerin. The reaction occurs through three consecutive reversible reactions. First reaction occurs was di-glyceride produced from triglyceride. It were continuous with second reaction where mono-glyceride is produced from di-glyceride and finally glycerin produced as a reaction of mono-glycerides in third reaction. Ester molecules produced in these three reactions (Alsoudy et al., 2012). Thus, at the end of the reaction, the three alkyl ester molecules and one molecule of glycerin obtained.
1.1 Research background
Superheated methanol known as non-catalytic method to produce biodiesel. In addition, by using this superheated methanol trans-esterification, purification of biodiesel has become easier because there is no soap and catalyst in the system (Asri et al., 2013). Both trans-esterification and esterification reaction occurs simultaneously in the non-catalytic method, therefore no cleaning process before and after the reaction. The limitation of this method is the reaction rate of biodiesel production is very low.
This method has advantages such as environmentally friendly because there is no danger of waste. This method was simple without having FFA (free fatty acids) oil refining process before the reaction and no saponification reaction occurs. The reaction rate was influenced by temperature, the flow of methanol, gas hold up and the contact surface between methanol and oils (Wulandani et al., 2015).
Design of obstacle or perforated plate and diameter holes was important in order to improve contact surface area between methanol and oil. Previous studies by (Wulandani et al., 2015) have provided evidence that the design of obstacles and holes diameter produce towards increased response rates for biodiesel production. In the previous research such as by (Saka et al., 2006 and Wulandani et al., 2015), several configuration of perforated plate were installed in the cylinder obstacle and have been simulated by computational fluid dynamics (CFD) method in order to improve reaction rate for produce biodiesel.
3
completely soluble in both FAME and glycerol was become as important properties in order to produce biodiesel.
1.2 Problem statement
The superheated methanol vapor in bubble column is one of Non-catalytic method in biodiesel production and this approach is highly concern. However, this method has certain limitation due to the low rate of reaction of methanol and oil in biodiesel production. The reaction rate basically influenced by methanol flow rate, temperature, gas hold up and contact surface contact between methanol and oil.
1.3 Objective
1. To simulate a superheated methanol vapour in bubble column reactor by using
Non-Catalytic method.
2. To predicting the main parameters of hydrodynamic, such as gas velocity
magnitude, surface contact area and gas hold up of bubble column towards reaction rate of methanol and crude palm oil.
3. To determine the performance of numerical modelling in simulation of superheated methanol vapour in bubble column reactor under different operating conditions.
4. To compare the simulated results with previous experimental or simulated result in order to test the validity of the present models.
1.4 Scope of study
various hydrodynamics parameters. The results were compared to the simulated results from the previous research.
1.5 Significant of study
CHAPTER 2
LITERATURE REVIEW
Bubble column widely uses in biodiesel analysis by experimentally or simulation in producing fuel for using by mankind or industrial. In bubble column process, there are a lot of variety parameters has been studied by researchers to predict behavior of hydrodynamics in biodiesel production. Superheated methanol is Non-catalytic method widely used in order to increase reaction rate of biodiesel production. One of the important parameters can be studied to predict reaction rate in bubble column is surface contact of gas-liquid contactor.
The flow dynamics in bubble column has been studied extensively in past decades by using techniques such as experimental, modeling, and simulation. This studied focusing on approach that probably affects the reaction of gas-liquid in bubble columns such as influence by hydrodynamics regime, bubble column geometry, gas hold up profile, gas velocity, surface contact and sparger. This chapter wills presents the previous contributions made by some researchers for further understanding of fundamentals of bubble columns hydrodynamics to support the methodology of research.
2.1 Flow structure and liquid circulation pattern
circulation behaviour will producing a good degree of mixing and indirectly will enhance heat and mass transfer between fluid and walls.
Based on this behaviour, the circulation of the liquid can be the one of major indicator to observer in predicting of mass or heat transfer coefficient and mixing capability. This phenomenon occurs due to factor such as bubble size, bubble dynamic and holdup. Thus, these factors are very crucial in determining the efficiency of liquid-liquid mixing in bubble columns. Figure 2.1 show the three basic types of liquid circulation pattern occur in bubble column reactor. For ‘a’ types of
circulation called as large-scale circulation, ‘b’ types called as donut-model of Joshi and Sharma (1979) and ‘c’ types called as circulation cells according to Zehner
(1986).
Figure 2.1: Liquid circulation patterns in bubble columns.
2.2 Hydrodynamics regime
7
velocities below 0.05 m/s. In practically, there is no bubble coalescence or break-up on this regime based on sparger design and system properties.
The second flow regime called as heterogeneous regime or churn turbulent regime occurs at superficial gas velocities greater than 0.05 m/s. The characterizing of this regime based on the gas bubble behavior. This behavior occurs caused by the disturbed form of the homogeneous gas–liquid system due to enhanced turbulent motion of gas bubbles and liquid recirculation. The coalescence formed by unsteady flow patterns and large bubbles with short residence times due to high gas velocities dispersed.
[image:18.595.171.473.373.560.2]A slug flow regime has been only observed in small diameter laboratory columns at high gas flow rates. Practically, slug regime is highly unstable and it can be found when the superficial gas velocity is increased further. This regime based on the formation of bubble slugs when larger bubbles are stabilized by the column wall
Figure 2.3: The flow regime observed in gas-liquid bubble column reactors (Mahajan, 2010)
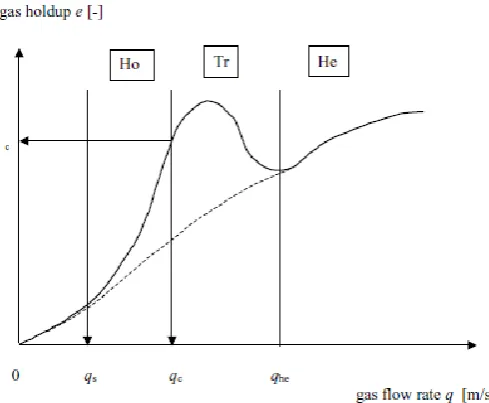
[image:19.595.197.442.508.709.2]Based on Figure 2.4, the study by Naji (2010) also stated that another regime occur called as transition region where gas holdup may go through a maximum. This region located between homogeneous and heterogeneous region. In the transition region, the fast rising bubbles will be produce by coalescence of bubbles based on gas velocity. Automatically it will enhances liquid circulation because the existing an onset of upward liquid circulation in the column center and downward liquid circulation near the column wall.
9
2.3 Gas hold up
One of the important parameter should be considering in bubble column design is overall gas hold up in order to characterize the hydrodynamics of bubble column. The gas hold up can be defined as the fraction of the reactor dynamic volume occupied by the gas (Pirdashti & Kompany, 2009). Moreover, the characterizes retention of the bubble under the liquid depending on gas holdup in a bubble column. As mentioned by Pirdashti et al., (2009), gas hold up depends mainly on the gas velocity, physical properties of the liquid and type of gas sparger. Based on Shintaro Furusaki et al., (2002), gas holdup is defined as the percentage of volume of the gas
phase in the total volume of the dispersion:
At high flow rates the gas holdup decreases in concurrent systems because gas bubbles pass through the column more quickly. In contrast, the gas holdup rises in countercurrent systems. Increasing the viscosity of the liquid phase leads to increased bubble coalescence and thus a decrease in gas holdup. In the simulation analysis, the gas holdup predicted based on ratio of volume methanol gas to the total volume mixture in the column system (Wulandani, Ilham, & Hagiwara, 2012). The determination of gas holdup in superheated methanol focusing in obtaining the effect towards reaction rate.
2.3.1 Effect of superficial gas velocity towards gas hold up.
Figure 2.5: Overall gas holdup (εg) versus superficial gas velocity (Usg) (Pirdashti & Kompany, 2009).
Based on study by Moshtari et al.,(2009), Figure 2.6 show homogeneous flow regime occurs at low gas flow with range between 0.025 m/s and 0.1 m/s which is the gas holdup increase smoothly by increasing of superficial gas velocity. Then, when the gas superficial velocity increases more than 0.1 m/s, it will turn the flow regime into transition regime and heterogeneous flow regime. It can be conclude that the velocity of gas will affect directly towards the changing of the flow regime in bubble column. At low superficial gas velocity, the bubble will appear in small size and travel upward in uniform condition and a helical path without any major collision or coalescence. However, there are some different statement by (Kantarci et al., 2005), which is the increasing of gas velocity in churn-turbulent region affected towards increasing of gas holdup due to large bubble rise upward.
11
Figure 2.6: Effect of superficial gas velocity on gas hold up in air-water system (Moshtari et al., 2009)
2.4 Mixing time
Mixing time is the important indicator of mixing performance in bubble column for mixing process. Typically, mixing time is used in considering of time required for the tracer concentration to reach the desired degree of homogeneity (Pirdashti et al, 2009). Based on the result analysis by Pirdashti et al., (2009); the mixing time decreases with an increase of superficial gas velocity. Figure 2.7 show the result with different of H/D.
important to generated reaction rate between gas-liquid especially in biodiesel production. Increasing contact time will give capability of gas-liquid to react in longer time for producing biodiesel. Contact time causes by turbulence appear in bubble column due to collision among the bubble. Turbulence causes the backflow appear which is rise the contact time between methanol and oil in biodiesel production (Wulandani et al., 2015), thus provide prolonging reaction between methanol and oil. The author also stated that the increasing of turbulent dissipation rate influence towards increasing the collision rate.
Figure 2.7: Mixing time (tm) versus superficial gas velocity (Usg) with H/D ratio as a parameter (Pirdashti & Kompany, 2009)
[image:23.595.187.444.532.720.2]13
2.5 Sparger design
Gas Sparger is important parameters to indicate the characteristic of bubble and indirectly affects gas hold up value. The sparger used to determines the bubble sizes observed in bubble columns. Basically, small orifices of diameter plate enable the formation of small bubble sizes. The common used gas sparger types in recent study are perforated plate, ring type, and porous plate. Regarding to the literature study by Kantarci et al., (2005), stated the smaller sizes of bubble will influencing towards the greater value of the gas hold up. It can be concluded that with small gas distributors their gas hold up values were higher. Literature study of Kantarci et al., (2005) also stated that gas holdup strongly affected by the type of gas distributor. Moreover, the type design of sparger directly will contribute towards small or large sizes of bubble by gas velocity dispersed in bubble column. Practically, the probability size of both small and large bubbles to gas velocity was appearing with ring sparger is lower compared to the perforated plate.
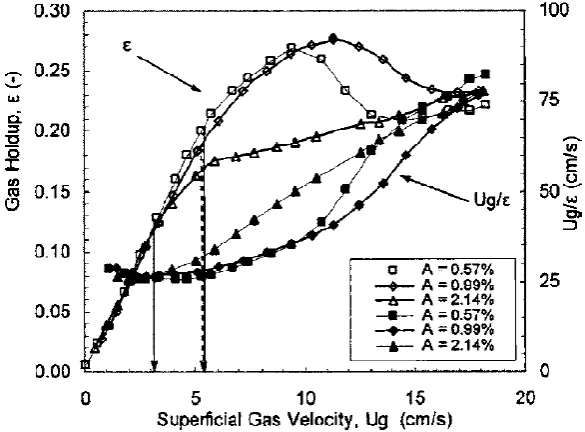
The effect of perforated plate open area analysis by Su et al., (2005) is shown in Figure 2.10 has been studied. From the result, the gas hold up increasing with increasing open area ratio from A=0.57% and A=0.99 %. Based on Figure 2.10, for both A=0.57% and 0.99%, gas holdup increases with increasing superficial gas velocity until a maximum gas holdup is reached, and then gas holdup decreases with increasing superficial gas velocity to a minimum value which indicates the end of the transitional flow regime. For A=2.14%, no maximum gas holdup is observed, and the gas holdup continuously increases with superficial gas velocity. It means that the gas hold up will perform effectively if the perforated plates open area within certain range (A≤1%). If the open area is beyond this range, it will decrease the effectiveness of gas hold up.
Even the holes size increased and influenced increase open area ratio, with the systematic holes arrangement can produce homogeneous bubble rise thus increase gas holdup. Previous study by (Solanki et al. 1992) also stated that at closely spaced holes arrangement could contributed to a higher probability of bubble coalescence compared to a large holes spacing. This behaviour also has been observed by (Xie & B.H. Tan, 2003), with decreasing hole spacing, it will enhanced bubble-bubble interaction and leading to decreasing gas holdup value.
Figure 2.9: Gas distributor perforated plates by (Su & Heindel, 2005)
Figure 2.10: Gas holdup and flow regime transition using different aeration plates in an air-water system(Su & Heindel, 2005)
[image:25.595.173.466.424.640.2]15
2.6 Bubble column geometry
The bubble columns geometry also important criteria that should be taken considerable attention in prediction of hydrodynamics and its influence on transport characteristics. Industrial bubble columns usually operate with a length-to-diameter ratio, or aspect ratio of at least 5. Regarding to Kantarci et al., (2005), the value of ratio in biochemical application usually varies between 2 and 5. Even more, when involved with large gas throughput, the use of large diameter reactors is totally desired.
Basically there are two types of mode of operation are valid for bubble columns, namely the semi batch mode and continuous mode. In continuous operation, the gas and the suspension flow concurrently upward into the column and the suspension that leaves the column is recycled to the feed tank. In the semi batch mode, there are zero liquid throughputs and suspension is stationary. In this mode, the gas dispersed is bubbled upward into the bubble column (Kantarci et al., 2005). Generally, the design and scale-up of bubble column reactors depend on the quantification of three main phenomena:
i. Heat and mass transfer characteristics ii. Mixing characteristics
iii. Chemical kinetics of the reacting system
2.6.1 Effect of H/D ratio
The process of coalescence and dispersion are practically absent in the homogeneous regime and hence the sizes of bubbles are entirely dictated by the sparger design and the physical properties of the gas and liquid phases. In contrast, in the heterogeneous regime, the role of sparger design diminishes depending upon the column height. The total column height can be divided into two regions. Firstly in the sparger region, the bubble size changes with respect to height depending upon the coalescence nature of the liquid phase, the extent of turbulence and the bulk motion. The bubbles attain an equilibrium size at the end of the sparger region.
force due to surface tension. Result by (Pirdashti & Kompany, 2009) show there was practically no critical effect of the H/D ratio on gas holdup as shown in Figure 2.11. The gas holds up value still increase based on increasing of superficial gas velocity. However, the different of H/D ratio have influence in mixing time as show in Figure 2.7.
Figure 2.11: Overall gas holdup (εg) versus superficial gas velocity (Usg) with H/D ratio as a parameter (Pirdashti & Kompany, 2009)
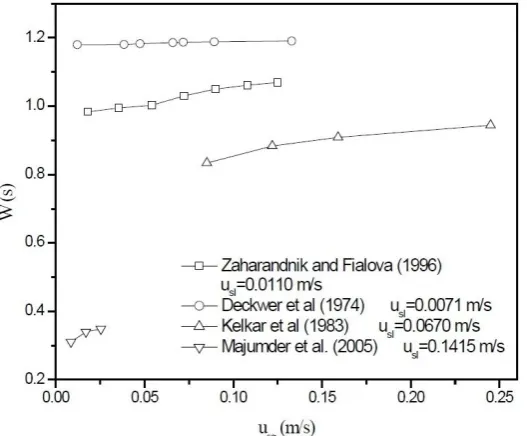
2.7 Mixing characteristics factors (W) and interfacial area
The variation comparison of mixing characteristic factor with gas phase velocities from different author is shown in Figure 2.12. The observation by (Parmar &
Majumder, 2013) show that the mixing characteristic factor (W) increases with increase in gas velocity. Gas velocity indicates a higher dispersion or higher mixing in the column at constant increasing of liquid velocity. The increasing of gas velocity will created the momentum exchange in the column indirectly influence increasing the internal circulation of the gas phase in the column. This will lead more enhancement of spreading of tracer molecule and increase contact surface area.
17
[image:28.595.189.453.299.517.2]interaction with the liquid at low gas velocity compared towards higher gas velocity. These phenomena occur due to large fast-rising bubbles appear and disrupt the system contents. Moreover, in the context of biodiesel production, increasing of methanol feed flow rate wills increased gas-liquid interface area thus increases in enhanced reaction rate (Sagara, 2007). Generally, contact surface area or interfacial area can be described as a potential area occurs by reaction between gas and liquids. In this biodiesel analysis, the contact surface area is measured when high temperature methanol bubble diffused to oil (Crude Palm Oil). Calculation of contact surface area in CFD simulation determined is based on calculation when the volume fraction of methanol and oil is 0.5 respectively (Wulandani et al., 2012.).
Figure 2.12: Variation of mixing characteristic factor with phase velocities (Parmar
& Majumder, 2013)
2.8 Crude palm oil
for heat production, but due to its relatively high melting point, it needs to be heated to reduce its viscosity before combustion(Prof & Esa, 2012).
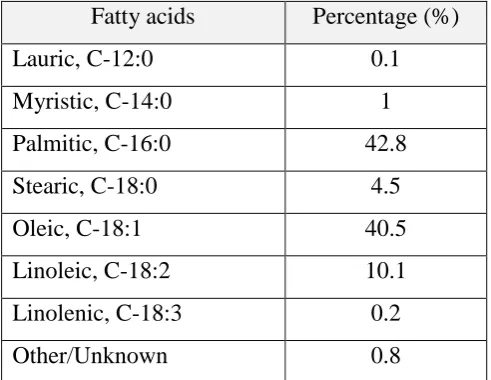
[image:29.595.197.443.353.543.2]Palm oil is derived from the pulp of the fruit of the oil palm Elaesisguineesis. Palm oil is one of the few vegetable oil high saturated fats. It is thus semi-solid at typical temperate climate room temperatures, though it will more often appear as liquid in warmer countries. Palm oil is naturally reddish because it contains a high amount of beta-carotene. Good palm oil must have lower amount of mono and diglycerides compositions. Palm oil is a common cooking ingredient in Southeast Asia and the tropical belt of Africa. Its increasing use in the commercial food industry in other parts of the world is buoyed by its cheaper pricing and the high oxidative stability of the refined product.
Table 2.1: Properties of palm oil (Fei & Teong, 2008)
Fatty acids Percentage (%)
Lauric, C-12:0 0.1
Myristic, C-14:0 1
Palmitic, C-16:0 42.8
Stearic, C-18:0 4.5
Oleic, C-18:1 40.5
Linoleic, C-18:2 10.1
Linolenic, C-18:3 0.2
Other/Unknown 0.8
2.9 Methanol
19
due to its relatively cost. The advantages of methanol due to capability in provide a proper viscosity and boiling point and a high cetane number of the produce biodiesel. The physical condition of methanol is an alcohol and is a colorless, neutral, polar and flammable liquid. The methanol also can miscible with water, alcohols, esters and most other organic solvents. The physical of methanol is only slightly soluble in fats and oils. Methanol as a volatile organic compound also can be present in contaminated condensates. Other common names for methanol include methyl alcohol, methyl hydrate, wood spirit, wood alcohol, and methyl hydroxide. Current implementation process and product produce by methanol are include windshield washer antifreeze, fuels, waste water treatment and biodiesel production.
2.10 Non-catalytic method
Non-catalytic method is another method to overcome the problem occurs during catalytic trans-esterification method. This technology has been produced by Saka and Dadan (Ang, Tan, Lee, & Mohamed, 2014). Both trans-esterification and esterification reaction occurs simultaneously in the non-catalytic reaction method. Therefore no purification process before and after the reaction as a catalyst methods do because existing of catalyst in the process. Trans-esterification is the reaction between oil and methanol to obtain biodiesel (fatty acid methyl ester (FAME) and glycerol). FAME can be produce by catalytic method or non-catalytic method. Currently, several methods have been used in order to produce biodiesel. The conventional method is using homogeneous base catalysts. However, the purification steps are required in this process to remove the catalyst and saponified products, ultimately leading to lower yields of biodiesel (Asri et al., 2013). This process also involved high production cost and energy consumption.
Superheated liquid refers to a liquid that is heated to a temperature higher than the boiling point. Production of biodiesel by superheated methanol are involved the heating process. Methanol liquid is heated to a high temperature above 250°C above the boiling point (64°C) at atmospheric pressure, 0.1 MPa and become as vapor or gas (Asri et al., 2013). Methanol gas is introduced from the bottom of the bubble column reactor into a liquid oil to produce biodiesel by trans-esterification reaction without catalyst. In addition, by using this superheated methanol trans-esterification, purification of biodiesel has become easier because there is no soap and catalyst in the system.
2.11 Supercritical liquid
CHAPTER 3
METHODOLOGY
Recently, many method has been using by researchers to review dynamic flow behavior in bubble column. Some of the method has been using by researcher such as experimental method, finite element method and simulation method by using computational fluid dynamics. In consideration of costing, the evaluation of performance in bubble column using approach by computational fluid dynamics is highly effective compare to experimental setup. The purpose CFD packages use in this research is ANSYS-FLUENT. These packages are based on finite volume method and are used to solve fluid flow and mass transfer problems. CFD allow users to simulate the performance of alternative configurations, eliminating guesswork that would normally be used to establish equipment geometry and process conditions. The use of CFD enables users to obtain solutions of problems with complex geometry and boundary conditions. Advantages of CFD can be summarized as:
1. It provides the flexibility to change design parameters without the expense of hardware changes. It therefore costs less than laboratory or field experiments, allowing users to try more alternative designs than would be feasible otherwise. 2. It has a faster turnaround time than experiments. It guides the users to the root of
problems, and is therefore well suited for trouble-shooting.
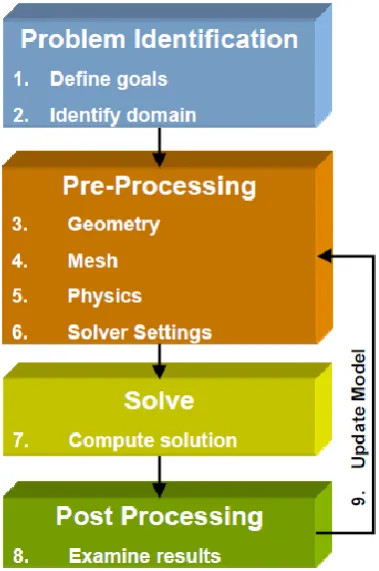
ANSYS FLUENT analysis is the main step in obtaining the result. Regarding to ANSYS FLUENT procedure, there are some basic steps need to follow include sophisticated user interface input problem parameters and to examine the result. Hence, this chapter explained in detail the methodology step based on Figure 3.1 which were shows the CFD modeling overview as a guide in analysis procedure.
Figure 3.1: CFD modeling overview
3.1 Flow chart
[image:33.595.225.415.198.484.2]23
3.2 Pre-processor
Pre-processing consist inputs of flow problem and also become as operator friendly interface and subsequent transformation of this input into a suitable form for application in solver. Pre-processor step performed by using SOLIDWORKS for design and Meshing Design Modular consist in ANSYS FLUENT packages. Hence, below are list of step involved in pre-processing stages.
1. Define the geometry of the region for computational domain. 2. Generated grid for subdivision of the domain.
3. Specified appropriate boundary and continuum conditions at cells
Each cells in various nonlinear equation form used to define the solution of flow problem such as velocity, phase holdup, pressure, and temperature and etc. Influence of accuracy in CFD solution governed by number of cell in grid of meshing. Basically, large numbers of cell produce better solution of accuracy.
3.2.1 Model geometry
56
REFERENCES
Alsoudy, A., Thomsen, M. H., & Janajreh, I. (2012). Influence on process parameters in transesterification of vegetable and waste oil. A review, 64–77.
Ang, G. T., Tan, K. T., Lee, K. T., & Mohamed, A. R. (2014). Biodiesel production via injection of superheated methanol technology at atmospheric pressure. Energy Conversion and Management, 87, 1231–1238.
Asri, N. P., Machmudah, S., Wahyudiono, W., Suprapto, S., Budikarjono, K., Roesyadi, A., & Goto, M. (2013). Non catalytic transesterification of vegetables oil to biodiesel in sub-and supercritical methanol: A kinetic’s Study. Bulletin of Chemical Reaction Engineering & Catalysis, 7(3), 215–223.
Tio Thiam Boon (2010, April). Biodiesel production via homogeneous lewis acid catalyzed transesterification.
Fei, Y. E. E. K., & Teong, L. E. E. K. (2008). Palm oil as feedstocks for biodiesel production via heterogeneous transesterification : optimization study, International conference on environment.
Garino, C. G. G., Mirasso, Miguel E Tornello (2013). Modeling and simulation of the biodiesel production in a pilot continuous reactor, XXXII, 19–22.
Kantarci, N., Borak, F., & Ulgen, K. O. (2005). Bubble column reactors. Process Biochemistry, 40(7), 2263–2283.
Lim, T.H, Bari, S & Yu. C. W.. (2002). Using crude palm oil as diesel engine fuel. AJSTD Vol 19 issue 2, pp 1-13.
Mahajan, V. (2010). CFD analysis of hydrodynamics and mass transfer of a gas-liquid bubble column, National Institute of Technology Rourkela, Roll No. 10600026.
Moshtari, B., Babakhani, E. G., & Moghaddas, J. S. (2009). Experimental study of gas hold-up and bubble behavior in gas – liquid bubble column, 51(1), 2–7.
Naji, O. I. (2010, October). Heat transfer in bubble columns using two different column diameters, Republic of Iraq, Ministry of higher education and scientific research university of technology, Chemical engineering department.
Parmar, R., & Majumder, S. K. (2013). A stochastic analysis of liquid mixing in bubble column, 3(3), 75–79.
Pirdashti, M., & Kompany, R. (2009). Effects of height to diameter ratio and aeration rate on liquid mixing and hydrodynamic properties in a bubble column, 6(3).
Prof, E., & Esa, T. (2012). Alternative liquid biofuels for lime kilns, Lappeenranta University of Technology.
Sagara, R.ie Yamazaki, satoshi Iwamoto, Hiroshi Nabetani, Kiyoshi Osadaka, Osato Mitawaki(2007, March). Noncatalytic alcoholysis of oils for biodiesel fuel production by a semi-batch process. Japan Journal of Food Engineering, Vol. 8 No 1, pp. 11-18.
Saka, S., & Minami, E. (2006, November). A novel non-catalytic biodiesel production process by supercritical methanol, The 2nd Joint International Conference on “Sustainable Energy and Environment (SEE 2006)", 1–6.
Shintaro Furusaki, John Garside, L.S. Fan. (2002). The expanding world of chemical engineering second edition(p.178).
Solanki, M. K. S., Mukherjee, A. K., and Das, T. R., 1992, “Bubble Formation at Closely Spaced Orifices in Aqueous-Solutions,” Chem. Eng. J., 49_1_, pp. 65–71.
Su, X., & Heindel, T. J. (2005). Effect of perforated plate open area on gas holdup in rayon fiber suspensions. Journal of Fluids Engineering, 127(4), 816.
Wulandani, D., Ilham, F., Fitriyan, Y., Siswantara, A. I., Nabetani, H., & Hagiwara, S. (2015). Modification of biodiesel reactor by using of triple obstacle within the bubble column reactor. Energy Procedia, 65, 83–89.
Wulandani, D., Ilham, F., & Hagiwara, S. (2012). The effect of obstacle types on the behavior of methanol bubble in the triglyceride within the column reactor by using cfd simulation, Journal of Mechanical Engineering and Technology, Vol 4 No. 2, 61–68.