Development and validation of HPLC dissolution assay of
simvastatin tablets under normal and accelerated conditions
M. EL Karbane
a,b, Y. Ramli
b, M. Amood Al-Kamarany
b, H. Bouchfra
b, M. Radi
b, K.
Karrouchi
b, Y. Cherrah
a, A. Bouklouze
aand M. Azougagh
c*aPharmaceutical and Toxicological Research Team, Laboratory of Pharmacology and Toxicology, Faculty of
Medicine and Pharmacy, University Mohammed V, Souissi, Rabat, Morocco
b
Physicochemical Service, Drugs Quality Control Laboratory, Division of Drugs and Pharmacy, Ministry of Health, Rabat, Morocco
cInstitut de Formation aux Carrières de Santé de Rabat, Avenue Hassan II, Kilomètre 4,5Rabat, Maroc
_____________________________________________________________________________________________
ABSTRACT
The UV-Vis method required by the USP pharmacopeia for simvastatin tablet dissolution assays suffers from a lack of specificity and reproducibility which limit its use to perform kinetic dissolution profile between the innovator and its generics. This variability caused by the manganese dioxide treatment step or by the hydrolysed compound of simvastatin. In order to obtain an acceptable precision of the percent release of simvastatin under normal and accelerated conditions, a HPLC method was developed and validated according to ICH Q2R1 guidelines. The separation was achieved using a GL Science Inertsil ODS - 3 V (5µm, 150mm×4.6mm i.d.) column. The gradient elution mobile phase was composed of buffer (pH=4.2, 12 mM sodium acetate and adjust pH by glacial acetic acid and acetonitrile at a flow rate of 1.7ml/min. The detection was performed at 238 nm. It was demonstrated that the USP UV-Vis method is not suitable to assess the dissolution kinetic profiles and to perform a comparative study between the innovator and different references of simvastatin. This UV-visible method cannot distinguish between the simvastatin as principal active ingredient and its impurity A obtained by hydrolysis in the dissolution medium test. While it was demonstrated that the HPLC method is more suitable to quantify accurately and precisely the percent release of the innovator and the generics for simvastatin under normal and accelerated conditions
Keywords: Simvastatin, HPLC, Validation, Dissolution profile, Normal and Accelerated Conditions.
_____________________________________________________________________________________________
INTRODUCTION
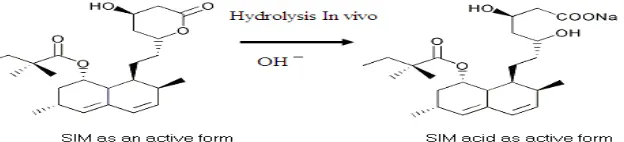
Simvastatin (SIM) is a cholesterol-lowering agent belonging to the class of statins and it has been widely used in the treatment of hypercholesterolemia, dyslipidemia and coronary heart disease [1, 2]. SIM is a weak acid [3] classified as a BCS Class II substance [4,5], practically insoluble in water thus showing dissolution rate-limited absorption and low oral bioavailability [6]. Moreover, at higher pH values, the lactone form of simvastatin is unstable and the equilibrium favours hydrolysis opening the lactone and yielding the hydroxyl acid form (IMP-A) (Fig. 1) [7]
Fig.1: Hydrolysis of SIM In vivo
Nowadays, healthcare system encourage the use of generic products instead the originator for their same quality and low cost. However, the quality of these generics products is required.
The main aim of this study was to assess the quality of the different simvastatin generics products (20mg) obtained from different countries (Spain, India and Morocco) compared to the innovator Zocor by performing their dissolution profiles using the USP Monograph conditions [10] which are recommended also by the FDA [11] and the validated HPLC method instead of the UV-Visible [10]. This last method used by USP [10] gives no reproducible results caused by the manganese dioxide medium its self and by the impurity obtained by the hydrolysis of some SIM generic brands in these conditions.
EXPERIMENTAL SECTION
2.1 Apparatus
The dissolution test was performed in eight station Hanson dissolution tester (model SR8-Plus™ -USA) in accordance with USP 34 general methods [10]. Perkin Elmer UV–Vis spectrophotometer (model Lambda Series 35 -USA) using 1.0-cm quartz cells and a chromatographic system consisted of Waters 2695 pump, auto sampler and Waters 2998 photodiode-array detector (PDA) with Spectra Manager software and Empower Software data registration, respectively, were used for all absorbance measurements. A digital Mettler Toledo pH meter (Switzerland) was used to determine the pH of all solutions. Incubation oven (BINDER GmbH Germany) was used for accelerated stability studies. A Pharma Test (PTB301 Germany) was used to determine the hardness.
2.2 Reagents and samples
The simvastatin standard (99.1 %) was obtained from European Pharmacopeias (Eur Ph) and simvastatin acid (95.0 %) was obtained from LGC GmbH (Germany). The Simvastatin generic tablets were purchased from local, Indian and Spain markets and coded as A, B, C, D and E.
The placebo used in validation procedure is composed by the usual excipients found in the commercial formulation tablets (red iron oxides, yellow iron oxides, opadry, lactose anhydrate, talc, citric acid, acid ascorbic, Butylatedhydroxyanisole, polyvinylpolypyrrolidone, colloidal silica, cellulose, dioxide titanium and magnesium stearate ).
Acetonitrile HPLC grade, sodium dodecyl sulfate, sodium hydroxide and manganese dioxide were from Sigma - Aldrich (Germany). Monobasic sodium phosphate and sodium acetate were obtained from Riedel–de Haeri (Germany). Glacial acetic acid was supplied from Scharlan (Spain).
2.3 Chromatographic Conditions
[image:2.595.216.396.676.742.2]The separation was achieved using a GL Science Inertsil ODS - 3 V (5µ m, 150mm×4.6mm i.d.) column. The gradient elution mobile phase was composed of Buffer (pH=4.2 “12 mM sodium acetate and adjust pH by glacial acetic acid and acetonitrile (Table1) at a flow rate of 1.7ml/min. Detection was performed at 238 nm and all assays were performed at room temperature conditions. The auto sampler was programmed to inject 50µl. The mobile phase was filtered through a 0.45-µ m Millipore filter and degassed by vacuum prior to use
Table 1 : Gradient of mobile phase of RP –HPLC Time (min) Buffer (pH=4.2) Acetonitrile
0 50 50
5 50 50
8 30 70
11 30 70
having a known concentration of about 0.01 mg/ ml. An accurately weighed portion of finely powder tablets, equivalent to about 10 mg of SIM was transferred to 50 ml volumetric flask, diluted to volume with the mixture solution, shacked mechanically for 10 minutes, and sonicated for about 10 minutes to obtain a clear solution. 5ml of this solution was transferred to a 100 ml volumetric flask, diluted to volume with the same diluent and mixed to obtain a solution having a concentration of about 0.01 mg per ml.
2.6 Dissolution test
The dissolution rate studies on conventional SIM tablets were carried out according to the USP paddle method (Apparatus 2), at a stirring rate of 50 rpm at 37 ± 0.5 ° C. The dissolution medium was 900 ml of pH 7.0 buffer solution containing 0.5% sodium dodecyl sulfate in 0.01 M sodium phosphate prepared by dissolving 30 g of sodium dodecyl sulfate and 8.28 g of monobasic sodium phosphate in 6000 mL of water, and adjusting with 50% (w/v) sodium hydroxide solution to a pH of 7.0.
2.6.1 Assay based on the USP method with and without manganese treatment
The UV-Visible method proposed by USP monograph [10] is time-consuming due to the manganese dioxide treatment step. This step consisted of the preparation of the prewashed manganese dioxide by transferring about 10 g of manganese dioxide to 50 ml of dissolution medium in a suitable container, and was shacked vigorously for 5 minutes. The mixture was centrifuged, and the supernatant layer was isolated. This step was repeated twice, first with dissolution medium and then with water. Finally the solid was dried at 100 °C for 1 hour before use. The collected sample was transferred to a centrifuge tube containing about 10 mg of prewashed manganese dioxide per ml of the added solution and was mixed. The mixture solution was stand for 30 minutes with occasional shaking, centrifuged, and a portion of the clear supernatant was used. The dissolution medium is used as blank for all UV Visible measurements.
The amount the sample test and that of the standard solution with a known concentration of SIM which was prepared in the same medium and treated as the same way as the sample test was calculated from the UV absorbance difference corresponding to the wavelengths of 247 nm and 257 nm respectively.
The percent release of the originator (Zocor) and the five generic brands (A, B, C, D and E) with and without treatment with the manganese dioxide was assayed at 30 min by the USP method.
2.6.2 Assay based on the validated RP-HPLC method
The developed and validated method was used to assess the comparative dissolution profiles of the originator and the five generic compounds under normal and accelerated conditions.
Twelve tablets of each product were sampled. During the dissolution process, 5 ml aliquots were withdrawn at 10, 20, 30 and 45 minutes and filtered through 0.45 µ m filters before their injection. The withdrawn aliquots were replaced by dissolution medium. The percent drug release was also quantified by the HPLC method using regression linear equation of the calibration curve.
2.7 Hardness Test
Hardness test was performed using a hardness tester on 10 tablets from each brand at normal and accelerated conditions.
RESULTS AND DISCUSSION
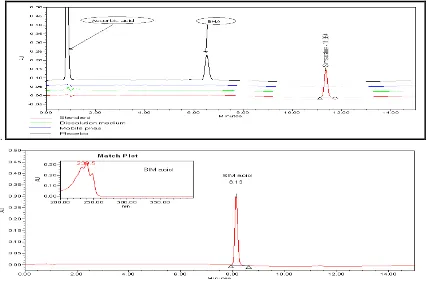
3.1. Validation of HPLC analytical methods 3.1.1. Specificity
.
Fig.2: Specificity of the HPLC method at the accelerated conditions
3.1.2 Calibration curve
In order to bracket the target concentration of SIM after the dissolution experiments, linearity in the range of 2.5 µg /ml to 16.66 µg /ml was evaluated using five concentration levels with two replicate for each level. A linear regression equation was obtained (y= 17328x+10235) with a regression coefficient (r ) of 0.99996.
3.1.3 Precision (repeatability and intermediate precision)
The repeatability (within-day precision) was validated as described on the ICH Q2R1 guidelines, by performing six replicate samples of 11.11 µg /ml of SIM in the same conditions. The calculated mean relative standard deviation (R.S.D) was 1.5% .
The intermediate precision (day-to-day precision) was assessed by the CV% calculated from data obtained by performing six measurements for the nominal concentration (11.11µg/ml) for three independent series. The CV % was 1.8 which confirmed the reproducibility of the HPLC assay.
3.1.4. Accuracy
The accuracy of the method was determined by spiking the placebo with standard SIM at five concentration levels, covering the range of 50 - 140 % of the target concentration. The mean percent recovery 99.99 % falls inside the 95 % confidence interval of 98.01%-101.98%.
3.2. Assay content (HPLC)
The results of SIM content in tablets under normal and accelerated conditions were reported in Table 2. The results show that the percent recoveries for all the SIM products met the acceptance criteria (100 ±5 %).
Table 3: Assay results of tablets at normal and accelerated conditions
Product Normal Conditions
Mean ± RSD (%)
Accelerated Conditions Mean ± RSD (%)
Originator 100.8 ± 0.2 98.5 ± 0.6 Generic A 102.4 ± 1.1 97.4 ± 0.5
Generic B 98.4 ± 0.8 95.9 ± 1.3 Generic C 99.4 ± 0.9 97.1 ± 1.0 Generic D 98.7 ± 1.2 96.4 ± 0.9 Generic E 99.5 ± 1.1 99.4 ± 1.0
3.3. Hardness Test
[image:4.595.182.432.646.733.2]Generic C 124 ± 2.9 120 ± 2.6 Generic D 80 ± 5.1 73 ± 5.5 Generic E 99 ± 3.5 91 ± 4.4
3.4. Dissolution test
3.4.1 UV-VIS method
[image:5.595.188.425.107.193.2]The results of the dissolution test of tablets treated with and without a manganese dioxide were reported in (table-5). These results indicated that the originator, the generics products (C and E) present a significant difference (p<0.05) in the percent release obtained with or without manganese dioxide treatment at normal conditions. While for the generics (A, B and D ) the results are not significant ( p >0.05). Its noticed that at the earlier time measurement points e.g at t= 10 minutes, the relative standard deviation is higher (28 %) than the other times points (less than 10 %) when the USP method was applied to quantify the percent release. Accordingly, the USP method seems to be not adequate for assessing the kinetic dissolution profiles between the innovator and the others references.
Table 5: Percent release with (T) and without (NT) the manganese dioxide treatment at normal conditions, t (min) = 45
Products T
Mean (%) ± RSD (%)
NT Mean (%) ± RSD (%)
Originator 90 ±7.2* 98 ±8.1* Generic A 94 ±12.5 92 ±9.3
Generic B 91 ±13.1 94 ±13.3 Generic C 124 ±2.9* 120 ±2.6* Generic D 89 ±17.0 91 ± 10.5
Generic E 92 ±19.1* 107 ±14.7* * p <0.05
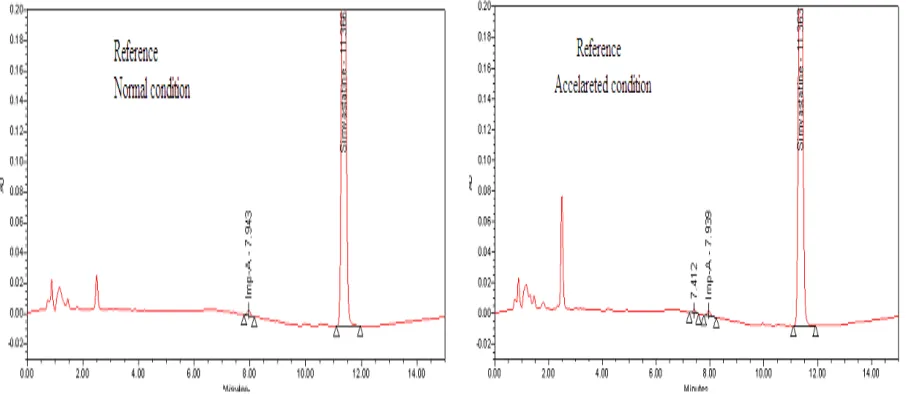
3.4.1 HPLC method
[image:5.595.80.533.543.740.2]Fig.3: Chromatograms of SIM release under normal and accelerated conditions
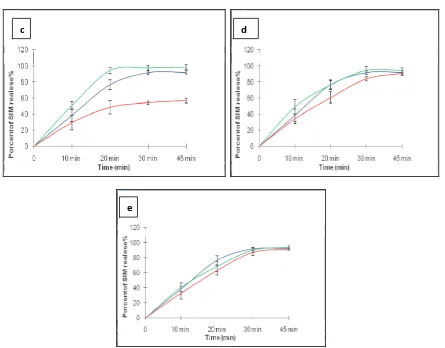
The Comparative kinetic dissolution profiles of the innovator and the generics at normal and accelerated conditions were shown in Figure 4. This kinetic is similar for each for all products under the conditions studied except for the generic B which present a difference in the shape of the kinetic curve at different conditions.
Fig.4: Comparative kinetic dissolution profile of the innovator and the references at normal and accelerated conditions obtained by HPLC method
Légende : Originator normal conditions Originator accelerated conditions
Geniric normal conditions Generic accelerated conditions
In order to cheek this similarity between the two curves related to the dissolution profile at normal and accelerated condition for each product, similarity factor (F2) and dissimilarity factor (F1) were calculated [14] table 8. According to FDA’s guides for industry [13], F1 factor is proportional to the average difference between the two profiles, whereas F2 factor is inversely proportional to the average squared difference between the two profiles, with emphasis on the larger difference among all the time points. According to this guideline, generally, F1 values up to 15 (0–15) and F2 values greater than 50 (50–100) ensure sameness or equivalence of the two curves.
The calculate factors F2 and F1 (table 8) indicated that the A, C and E generic products presented a similar profile for different conditions as the originator and are considered meeting the quality requirement. Concerning the B product, under accelerated condition the F1 value 36.8 (table 8) revealed that this product is not similar to the innovator and its quality don’t be guaranteed.
Table 8: Similarity factor (F2) and dissimilarity factor (F1) of different brands
Products Conditions dissimilarity factor (F2) Similarity Factor(F1)
Originator
N --- ---
Acc 53.7 5.3
Generic A
N 54 4.5
Acc 52.8 7.8
Generic B
N 37.4 14.2
Acc 26.4 36.8
Generic C
N 50.1 5.3
Acc 51.7 9.7
Generic E
N 53.3 4.7
Acc 55.6 8.2
[image:7.595.178.434.626.730.2]CONCLUSION
HPLC method was developed and validated using ICH Q2R1 guidelines for the determination of SIM percent release in different generic and innovator tablets. It was demonstrated that the USP UV-Vis method is not suitable to assess the dissolution kinetic profiles and to perform a comparative study between the innovator and different generics of simvastatin. This UV-visible method cannot distinguish between the SIM as principal active ingredient and its impurity A obtained by hydrolysis at the dissolution medium test. While it was demonstrated that the HPLC method is more suitable to quantify accurately and precisely the percent release of the innovator and the generics for simvastatin under normal and accelerated conditions
Acknowledgements
The authors thank the Moroccan National Drug Control Laboratory (Laboratoire Nationale de Contrôle des Médicaments LNCM) for supporting this study.
REFERENCES
[1] Mauro VF and MacDonald JL. Annals of Pharmacotherapy, 1991, 25, 257 – 264. [2] Todd PA and Goa KL. Simvastatin. Drugs, 1990, 40 , 583 – 607 .
[3] Reinoso, R.F., Sanchez Navarro, A., Garcia, M.J., Prous, J.R, Preclinical pharmacokinetics of statins Methods Find Exp Clin Pharmacol 2002, 24(9): 593
[4] Vikram M. Pandya, Jayvadan K. Patel and Dhaval J. Patel Der Pharmacia Lettre, 2011, 3(2): 129-140
[5] Kasim NA, Whitehouse M, Ramachandran C, Bermejo M, Lennernäs H, Hussain AS, Junginger HE, Stavchansky SA, Midha KK, Shah VP, Amidon GL, Molecular properties of WHO essential drugs and provisional biopharmaceutical classification Mol Pharm. 2004 Jan 12-1:85-96.
[6]. Emami, J. In vitro–in vivo correlation: from theory to applications. J. Pharm. Pharm. Sci. 2006, 9 (2), 169–189. [7] Alvarez-Lueje, A., Valenzuela, C., Squella, J.A., Nu˜nez-Vergara, L.J., 2005. J. AOAC Int. 88, 1631–1636 [8] Singla N, et al. A discriminatory and biorelevant dissolution test method for simvastatin drug products, November 2009 July 23, 2011.
[9]. Videau, J.-Y. Bull. World Health Organ. 2001, 79 (2), 87. [10] Unites State Pharmacopeia ,USP, 2012.
[11]U.S.Food and Drug Administration/ Dissolution Methods
http://www.accessdata.fda.gov/scripts/cder/dissolution/dsp_SearchResults_Dissolutions.cfm?PrintAll=1.
[12] International Conference on Harmonization of Technical Requirement for the Registration of Pharmaceuticals for Human Use Topic Q2 (R1) : ICH, 2005.
[13] Guidance for Industry:Dissolution Testing of Immediate ; Release Solid Oral Dosage Forms FDA August 1997 [14] C. Kalonji Mubengayi, Y. Ramli, M. El Karbane, M. Azougagh, Y. Cherrah and E. M. Essassi , Journal of