Bi-fuel SI Engine Model for Analysis and Optimization
K Rezapour
1, B A Mason
2, A S Wood
2, M K Ebrahimi
2 ,*1Mechanical Engineering Department, IslamicAzad University of Karaj Branch, Alborz, Iran 2School of Engineering and Computing, University of Bradford, West Yorkshire, UK
*Corresponding Author: [email protected]
Copyright © 2014 Horizon Research Publishing All rights reserved.
Abstract
The natural gas as an alternative fuel has economical and environmental benefits. Bi-fuel engines powered by gasoline and compressed natural gas (CNG) are an intermediate and alternative step to dedicated CNG engines. The conversion to bi-fuel CNG engine could be a short-term solution to air pollution problem in many developing countries. In this paper a mathematical model of a bi-fuel four-stroke spark ignition (SI) engine is presented for comparative studies and analysis. It is based on the two-zone combustion model, and it has the ability to simulate turbulent combustion. The model is capable of predicting the cylinder temperature and pressure, heat transfer, brake work , brake thermal and volumetric efficiency, brake torque, brake specific fuel consumption (BSFC), brake mean effective pressure (BMEP), concentration of CO2, brake specific CO (BSCO) and brakespecific NOx (BSNOx). The effect of engine speed, equivalence ratio and performance parameters using gasoline and CNG fuels are analysed. The model has been validated by experimental data using the results obtained from a bi-fuel engine. The results show the capability of the model in terms of engine performance optimization and minimization of the emissions. The engine used in this study is a typical example of a modified bi-fuel engine conversion, which could benefit the researchers in the field.
Keywords
CNG, Bi Fuel, Engine Performance, Emissions, Engine Modeling1. Introduction
Vehicle manufactures are focussing their interests on a diversity of engine technologies [1]. This includes the development of engines that are capable of making use of alternative fuels such as CNG. CNG consists of 88 percent methane and may be used in either CNG or liquefied gas forms in vehicle. CNG is cheaper and cleaner than gasoline but it reduces the engine brake power [2].
Natural gas is a promising alternative fuel, with the potential to meet strict engine emission regulation and is cheaper than other fuels in many countries. Use of natural
gas as an automotive fuel may bring a reduction of environmental pollutants and reduce the economic costs of the transportation sector. As an intermediate step, and an alternative to dedicated CNG engines bi-fuel engines, powered by gasoline and compressed natural gas (CNG) provide many opportunities.
With regard to the climatic situation of some countries, and considering the existence of broad networks of gas distribution natural gas can be a suitable alternative to conventional fuels. The growth of bi-fuel vehicle usage in some countries is dependent on local strategies for the gasification of vehicles, which can be categorized in different levels, for example: workshop conversion of vehicles (short-term approach), factory production of bi-fuel engines (mid-term approach) designing and producing base CNG engine (long-term approach) [2].Developing bi-fuel engines (gasoline and CNG) in the short and mid-term is a strategy for achieving the emission targets in some countries. Therefore, it is necessary to understand the engine performance in these cases. In support of the development of such engines and to aid analysis and improvement in this study, a four-stroke bi-fuel spark ignition (SI) engine model is developed specifically for simulation of turbulent combustion. Furthermore, a thermodynamics model of a bi-fuel SI engine in Matlab environment has been developed based on mathematical model that it described in section 2, and validated by experimental data. This model modified for CNG and gasoline and it has ability for evaluating of the engine performance and the emissions characteristic.
power cycle of a hydrogen-fuelled ICE. Evans and Blaszcsky [8] in their study about characterising the performance and emissions of a bi-fuel Ricardo single cylinder SI research engine showed a 12% power and 5-50% emission reduction when the engine is fuelled using natural gas. Further similar studies [9-11] have also been undertaken looking at CNG and related engine development. The recent works by Rakopoulos, and Michos [12] and Baratta et al. [13] on development of a multi-zone combustion models and simulation code for SI Engines give a detailed analysis required for developing mathematical models and simulation tools. In addition, M.Y.Sulaiman et al. [14] analyzed the characteristic of signal cylinder SI ICE fuelled by LPG. In this study SI engine fuelled by LPG has slightly decrease power output up to 4%, however, engine fuelled LPG reduce on SFC to 28.38%. Ramjee and Vijaya [15] researched on alternative fuels, specifically in CNG fuelled. In this research experimental investigations carried out on the engine performance and exhaust emission of a single cylinder 4 stroke air cooled type engine. The results of this study have been shown that the emission characteristics of CO and HC for CNG fuelled are better than gasoline. Anant et al. [16] investigated the combustion characteristics and the performances parameters of a single cylinder LPG diesel fuel engine by mathematical model. A good prediction results have been obtained between the model and experimental data.
The paper structure content includes, model development, experimental validation on a bi-fuel engine, simulation results, discussion and conclusions.
2. Mathematical Model
The engine model developed herein is a quasi-dimensional, two zones combustion model that solves the differential equations related to compression, combustion and expansion. Intake and exhaust processes computationally are calculated using an approximation method. In this model, the combustion chamber is divided into two zones including of an unburned mixture (zone 1) and burned mixture (zone 2). The distance between the two zones is the flame front. The flame is propagated turbulently and expanded in the combustion chamber over a spherical flame front. An engine model can be developed based on these assumptions and using the mass and energy conversion laws [17].
The thermodynamic properties are provided using the relations proposed by the following expressions [18] that are curve-fitted to the tabulated JANAF thermo-chemical tables [19].
2 3 4
,
5
1 2 3 4
P i
i i i i i
C
U
U T U T
U T
U T
R
=
+
+
+
+
(1)2 3 4
3 5 6
2 4
1
2
i3
i4
i5
i ii i
h
U
U
T
U
T
U
T
U
T
U
RT
=
+
+
+
+
+
T
(2)2 3 4
3 4 5
1 2 2 3 4 7
i i i i
i i i
s U nT U T U T U T U T U
R= + + + + + (3)
where, Cp is the specific heat measured at a constant pressure,
h is the specific enthalpy and s is the specific entropy. The coefficients
U
i1toU
i7are calculated over two different temperature ranges [19]:1) 300 <T<1000 K; and 2) 1000 <T<5000 K.
When modelling with a single fuel, the equivalence ratio can be written as equation (4) [17]. Therefore, it can be calculated for each fuel (CNG or gasoline), separately.
. .
Act St
Fuel
Fuel
Air
Air
φ
=
(4)where, subscript Act. denotes the actual and St. denotes to stoichiometric air/fuel ratios.
The mass in a control volume may be calculated [17]; for
θ
IVC≥ ≥
θ θ
IVO(intake)( )
u
V m θ
ν
= (5) forθEVO≥ ≥θ θIVC(valve closed)
[
]
exp
(
) /
IVC b IVC
m m
=
−
C
θ θ
−
ω
(6)
With integration of
dm =-
C .m
bdθ
ω
, equation6 is determinedbased on boundary conditions. Cb is piston blow by constant
that dependent upon ring design, in this model it was assumed 0.8.
For θEVC≥ ≥
θ
θEVO(blow down and exhaust)b
V m
ν θ) (
= (7)
Subscripts b and u denote the burnt gas and unburned gas regions respectively. The cylinder volume is known at any crank angle, with compression ratio r, volume at TDCVc
(clearance volume) and
ε
=
stroke
2
×
length of rod
[17]:(
)
[
]
− + − −
− +
= 1 cos 11 1 2sin2 0.5
2 1 1 )
( ε θ
ε θ
θ V r
V c (8)
The combustion model is the two-zone model that divides the combustion chamber into unburned and burned zone. These zones distinct by a turbulent flame front that it is solved numerically. Therefore, the combustion parameters such as burnt mass fraction (x=m/mb) combined into the
model consist laminar and turbulent flame speed.
definition of enthalpy [20], this can be stated as:
( , )
( , )
react i prod ad
H
T p
=
H
T p
where, subscript react denotes to reactants and prod denotes to products, Tad is the adiabatic flame temperature, and Ti is the initial flame temperature.
The laminar flame speed with gasoline and CNG (methane) fuels, according to Metghalchi and Keck [21] is calculated as follows:
(
0.77)
,0
0 0
1 2.0
u
L L
T
P
bu
u
x
T
P
α β
=
−
(9)In which P is the pressure and Tu is the unburned zone temperature. T0=298 K and P0=1(atm) are the reference temperature and pressure,
α
,β
andu
L,0 are constants andx
b is the mole fraction of the residual gas in the unburned mixture. These constants are defined as follows for gasoline fuels:2 ,0
2.18 0.8(
1)
0.16 0.22(
1)
0.305 0.549(
1.21)
L
u
α
φ
β
φ
φ
=
−
−
= −
+
−
=
−
−
The flame speed of the natural gas and air mixture has been calculated using the relations presented by Guet al [22]. This relation is:
,0
0 0
u u
L L
T
P
u
u
T
P
γ κ
=
(10)γ and κ depend on
φ
. They are determined the quantities with a non-significant error (0.014%) for different quantities as shown below:2.000 0.438 0 0 1.162 .0374 0 0 2.105 0.504 0 0
0.314
1.2
0.36
1.0
0.259
0.8
u u u u L u uT
P
T
P
T
P
u
T
P
T
P
T
P
φ
φ
φ
− − −
=
=
=
=
(11)There are different methods that may be used for the calculation of the turbulent flame speed. In this paper, the Damkoler method [23] has been used to calculate the turbulent flame speed.
t L
u u u
= +
′
(12)360
0.75 (1 0.5 )
45
p
u′ = u −
θ
− (13) In the above relations, θ is the crank angle at the end of the compression stroke, which is equal to 360 degrees. In addition, up is the engine piston speed.In order to calculation of burnt mass amount during the combustion, it can be determined using the relation as follow [24]:
. . .(1
) / 6
b t
f u L
L
dm
A
u
u
N
d
θ
=
ρ
+
u
(14)2
4
f f
A
=
π
R
(15)1 3
3
(
)
4
b fV
R
π
=
(16) where, N is engine speed in rad/sec, ρu is unburned massdensity (gr/m3), A
f is the flame front area (m2), and Rf is radius of flame (m). Moreover, the correlation between flame radius and flame front area as well as the burned volume is needed. This correlation is closely related to the geometry of combustion chamber. Since, the combustion chamber in the considered engine model is quite simple in shape. The calculation methodology can be found in reference 24 and will not be detailed here.
Under the atmospheric air composition assumption (79%V
Nitrogen and21%v Oxygen), and conditioned φ<3, the
species including O, H, OH and NO are important due to dissociation [17]. Therefore, the combustion reaction becomes:
2 2 1 2 2 2 3 2 4 2 5
6 2 7 8 9 10 0.21 0.79 y
C H O N O N x CO x H O x N x O x CO x H x H x O x OH x NO
α β δ
εφ + + → + + + +
+ + + + +
(17)
x1 to x10 represent the products mole fractions. In addition, with two additional mole fractions in the products including N and Ar, which they [25] are made preparation content user specified air quality, and Depcik [26] improved the Olikara and Borman model. Moreover, the models are used for calculating of CO and NO species that Heywood [27] recommended them.
In terms of heat loss, heat transfer model is expressed [17]:
loss Q Qb u
Q dQ
dθ ω ω − − −
= = (18) where,
(
)
∑
=−
=
, ,p hi bi b wi
b
h
A
T
T
Q
(19)(
)
∑
=−
=
, ,p hi ui u wi
u
h
A
T
T
Q
(20)Abi and Aui are the burned and unburned gases areas in the heat transfer model in contact at temperature Twi with the combustion chamber component, x being the mass fraction burned and subscripts h, p and ℓ denoting to cylinder head, piston crown and linear, respectively. The following relations are [17]:
5 . 0
x
A
A
bi=
i (21)0.5
(1
)
ui i
Wher,
A A A
i=
h+
, and are determined2
2
b
A
h=
π
(Hemispherical cylinder head),
4
2
b
A
p=
π
(Flat pistoncrown), and
b
V
A
=
4
(
θ
)
(Linear surface area exposed to gases).The heat transfer rate is calculated using the following equation from Woschni [28]:
.
0.2 0.8 0.55 0.8
( .
.
.
).(
)
w w
Q A c b P T
=
− −u
T
−
T
(23)In this equation, the speed u is determined from:
1 2
.
(
)
.
r m r r pV T
P P
P V
u c u
=
+
c
−
(24)where
2
p
LN
[image:4.595.78.557.205.707.2]u
=
(25) Parameter Pr, Tr and Vr are evaluated at any reference condition, such as inlet valve closure. In addition, Aw, Pm, L and N are cylinder wall area, motoring pressure, piston stroke and engine speed respectively. The values for c1and c2 suggested by Woschni are listed in Table 1.Table 1. Woschni’s formula parameters [28]
Gas exchange c1= 6.18 c2= 0
Compression c1= 2.28 c2=0
Combustion and expansion c1= 2.28 c2= 3.24E-3
By solving the equations of energy conversion for each stage, the pressure and temperature rate changes can be calculated [17].
(
)
, ,
(
2)
b b b
ui b wi
i h p
b b b u b b
p p b p
h
A T T
dT
v
nv
dp
h h
dx
x x
C
d
θ
m c x
ω
C
nT d
θ
xc
d
θ
ω
=
−
−
∂
−
=
+
+
− −
∂
∑
(26)(
)
θ
ω
θ
d
dp
nT
nv
C
v
x
c
m
T
T
A
h
d
dT
u u p u p p hi ui u wi
u u u
∂
∂
+
−
−
−
=
=∑
)
1
(
,, (27)
dp
A B C
d
θ
D E
+ +
=
+
(28)where:
1
dV
VC
bA
m d
θ
ω
=
+
(29), ,
(
)
, ,(
)
b u
i h p bi b wi i h p ui u wi
b b u u
p b b p u u
A T T
A T T
v
nv
v
nv
h
B
m
ω
c
nT
T
c
nT
T
= =
∂
−
∂
−
=
+
∂
∂
∑
∑
(30)(
2)
(
)
b
b u b b
b u b
b p b
nv h h
C
dx
dx
C
v v
v
x x
d
θ
nT c T
d
θ
ω
∂
−
= −
−
−
− −
∂
(31)2 2
b
b b b b
p b b
v
nv
v
nv
D x
c T
nT
p
np
∂
∂
=
+
∂
∂
(32)2 2
(1
)
u
u u u u
p u u
v
nv
v
nv
E
x
c T
nT
p
np
∂
∂
= −
+
∂
∂
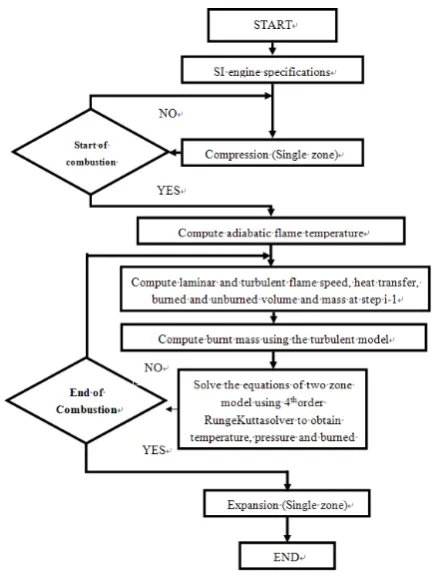
Equations (26)-(33) are functions ofθ, p, Tb and Tu have been solved using a fourth order Rung-Kutta solver. A detailed solution procedure of the quasi-dimensional combustion model is shown in Figure 1.
Figure 1. Solution procedure of the quasi-dimensional combustion model
Intake and exhaust processes are calculated using an approximation method [29]. In this method pressure loss is determined during the intake process by the Bernoulli equation for one-dimensional incompressible flow. In addition, intake pressure and temperature, exhaust pressure and temperature, and volumetric efficiency are determined as:
0
i i
p
=
p
− ∆
p
(34)0
(
) / (1
)
i r e r
T
=
T
+ ∆ +
T
γ
T
+
γ
(35)0
(1.25 1.05)
e
p
=
−
p
(36)1/3
/ ( / )
e b b e
T T
=
p p
(37)0 0
0
[ ( 1)](r r p p T Ti )[ ( T r eT )]
ed
v ϕ γ
η
= − + ∆ +(38)
pi,
∆
pi, Ti, pe, Te, Tb, Pb,γ ,φ
r ed, andη
vare intakepressure, pressure loss (manifold), intake temperature, exhaust pressure and temperature, burned temperature and pressure, mole fraction, charge up efficiency (depends on to engine revolution and air fuel ratio [29]) and volumetric efficiency, respectively. Moreover, only the initial conditions in intake and the final conditions in exhaust are determined for calculating of volumetric efficiency. Thermodynamic properties of the cylinder are calculated
based on thermodynamic and heat transfer models in crank angle.
Therefore, simulation and modelling of pressure, temperature, work and heat transfer is possible for the bi-fuel four stroke SI engine running on gasoline and CNG fuels. The solution procedure of the quasi-dimensional combustion model is shown in Figure 1.
The total friction work consists of three major components. These components are pumping work, rubbing friction work, and accessory work. Data at WOT for several 4 stroke cycle, 4 cylinder SI engines, for providing total motored friction mean effective pressure (FMEP), as an engine speed function are adequately correlated by a relation as [30]:
( ) 0.97 0.15( ) 0.05( )
1000 1000
N N
FMEP bar = + + (39)
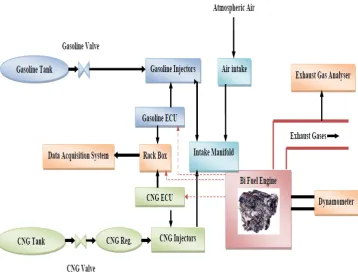
3. Model Validation
Model validation is undertaken through experimentation using the engine specified in Table 2. The engine is operated over its speed range, 1500-6000 r/min, at wide open throttle (WOT). The layout of the test rig shows in Figure 2.The test engine was a bi-fuel (gasoline and CNG) engine and prepared with an appropriate bi-fuelling system. Sensor applied for data gathering include of an angle encoder, lambda, air mass flow meter, intake manifold, oil and fuel temperatures and pressures, exhaust manifold, outlet water and oil thermocouples and intake manifold and oil pressure gauges. Data were gathered from the sensors and transferred to a data acquisition system. In addition, brake torque, brake power and exhaust gas NOx, CO, CO2, total unburned
hydrocarbons (THC), and O2 concentrations in this study. In
this model, CNG and gasoline have been considered with composition of CH4 and C7H14 based on the properties and
compositions of CNG and gasoline that used in the tests [31], respectively.
Table 2. The engine specifications
Engine type Four stroke, bi-fuel spark ignition
Fuel system MPFI
Induction Naturally aspirated
Number of cylinder 4 cylinder – In line
Bore (mm) 83
Stroke (mm) 81.4
Connecting Rod (mm) 150.2
Displacement Volume (cm3) 1761
Compression ratio 9.25
Maximum Power 68.65 kW @ 6000 rpm
Maximum torque 143 Nm @ 2500 rpm
Inlet valve opening (IVO) 32o bTDC
Inlet valve closing (IVC) 64o aBDC
Exhaust valve opening (EVO) 59o bTDC
[image:5.595.299.552.537.753.2]Figure 2. The layout of test rig
For model validation, the experimental results are compared. In running the model, the composition of CNG and gasoline are taken as methane (CH4), and C7H14,
respectively, in accordance with the literature [31]. Model and experimental results such as brake power (BP), brake specific CO (BSCO), brake specific NOx (BSNOx) and
cylinder pressure are compared in Figures 3 to 10. The results of model from viewpoint of trend and amount show good agreement compare to the experimental finding (about 8% mean relative error). Therefore, the results support the fact that the model is valid for prediction of performance and emissions of the bi-fuel engine through the range tested.
[image:6.595.322.538.458.715.2]Figure 3. The comparison brake power results (gasoline)
Figure 4. The comparison brake power results (CNG)
Figure5. Comparison of BSNOx results (gasoline)
1500 2000 2500 3000 3500 4000 4500 5000 5500 6000 10
20 30 40 50 60 70 80
r/min
B
rak
e P
ow
er
(k
W)
Experimental Theoretical
1500 2000 2500 3000 3500 4000 4500 5000 5500 6000 10
20 30 40 50 60 70
r/min
B
rak
e P
ow
er
(k
W)
Experimental Theoretical
1500 2000 2500 3000 3500 4000 4500 5000 5500 6000 0
1 2 3 4 5 6 7 8
r/min
BS
N
Ox
(g
rm
/Kw
h)
[image:6.595.64.286.535.724.2]Figure 6. Comparison of BSNOx results (CNG)
Figure 7. Comparison of BSCO results (gasoline)
Figure 8. Comparison of BSCO results (CNG)
Figure 9. Comparison cylinder pressure for gasoline and CNG fuels in
various crank position
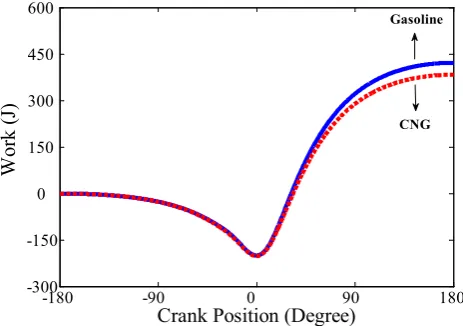
Figure10. Comparison work done for gasoline and CNG fuels in various
crank position
4. Engine Thermodynamic
Characteristics, Performance and
Emissions
The validated model can be used to predict cylinder pressure, work done, heat transfer, brake thermal and volumetric efficiency, brake power (BP), brake mean effective pressure (BMEP), brake specific fuel consumption (BSFC), equivalence ratio, BSNOx, BSCO and CO2
concentration in exhaust gases. The engine performance and emissions for both fuels are now analysed and discussed.
In Figures 10 to 11, cylinder pressure, work done for gasoline and CNG fuels as calculated by the validated model are shown. In these predictions N=3000 rpm and a spark timing of 25obTDC is assumed. It is clear that cylinder
pressure, work done for CNG engines are less than gasoline. In addition, the engine performance in a specific engine has a high dependency on the physical condition of the cylinder mixture.
1500 2000 2500 3000 3500 4000 4500 5000 5500 6000 0
2 4 6 8 10
r/min
BS
N
O x
(
gr
m
/Kw
h
)
Theoretical Experimental
1500 2000 2500 3000 3500 4000 4500 5000 5500 6000 0
0.5 1 1.5 2 2.5 3
r/min
B
SC
O (
gr
m
/Kw
h)
Theoretical Experimental
1500 2000 2500 3000 3500 4000 4500 5000 5500 6000 0
0.5 1 1.5 2
r/min
B
S
C
O (
gr
m
/Kw
h
)
Theoretical Experimental
-1800 -90 0 90 180
1 2 3 4 5 6 7
Crank Position (Degree)
Pre
ss
ure
(M
Pa
)
Gasoline
CNG
-180 -90 0 90 180
-300 -150 0 150 300 450 600
Crank Position (Degree)
W
ork
(J
)
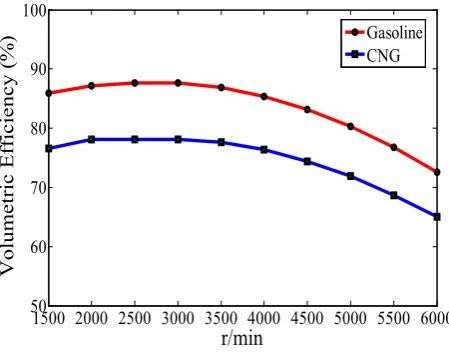
[image:7.595.313.547.76.234.2] [image:7.595.316.548.272.435.2]Figure 11. Comparison volumetric efficiency for gasoline and CNG fuels in various engine speeds
[image:8.595.313.549.93.273.2] [image:8.595.61.294.401.564.2]The power produced in a specific engine has a high dependency on the physical condition of the cylinder mixture. Therefore, the volumetric efficiency performs one of the most significant roles among the other engine parameters. In Figure 12, the calculated volumetric efficiency of the engine is shown at an engine speed for the gasoline and CNG fuels. Generally, the volumetric efficiency of a CNG engine is less (c.11%) than gasoline.
Figure 12. Comparison thermal efficiency for gasoline and CNG fuels in
various engine speeds
This reduction in volumetric efficiency is due to two main reasons: Firstly, the vaporisation of gasoline produces a cooling effect on the intake charge. Therefore, the density of the charge is increased and the volumetric efficiency increases. Whereas with CNG, as it is already in the gaseous form at ambient vehicle temperatures cooling will not take place. Secondly, CNG fuel occupies a large volume in the inlet mixture; this displaces the oxygen available for combustion. These are the main reasons for a decrease in volumetric efficiency when the engine is CNG fuelled. Figure 13 shows that the brake thermal efficiency of a CNG engine is less (c. 4.5%) than a gasoline fuelled engine, hence for the CNG engine the work produced is less even though
the heating value of CNG fuel is greater than gasoline.
Figure 13. Comparison brake power for gasoline and CNG fuels in
various engine speeds
In Figure 14, the comparative brake power (BP) of fuels is observed. As can be seen CNG produces less power (c.15.5%) when compared with gasoline. The reason is due to the lower volumetric efficiency of the engine when fuelled with natural gas. It should be noted that this engine has been designed for use with gasoline and not CNG. If the engine had been designed for CNG, it would have had a better performance. In order to alleviate this problem, it is possible to use turbo charging and redesign the intake manifold. Additionally the compression ratio of the engine may be increased because natural gas has a higher octane number compared with gasoline, thus the knock limit is raised.
Figure 14. Comparison BMEP for gasoline and CNG fuels in various
engine speeds
In Figure 15, the predicted BMEP of CNG and gasoline fuels is compared. For naturally aspirated engines the maximum BMEP is normally between 850 and 1050kPa [4]. As can be seen from the figure the engine BMEP when fuelled with CNG is less than gasoline by a maximum of 17%. This reduction is due to two main reasons. Firstly, the flame speed of CNG is less than gasoline [4, 27] for the same spark advance. The part of BMEP reduction happens with CNG operation that is due to longer ignition delay and lower flame speed of CNG. Therefore, the combustion should start
1500 2000 2500 3000 3500 4000 4500 5000 5500 6000 50
60 70 80 90 100
r/min
V
olu
me
tr
ic
E
ff
ic
ie
nc
y (
%
) Gasoline
CNG
1500 2000 2500 3000 3500 4000 4500 5000 5500 6000 22
24 26 28 30 32
r/min
T
he
rm
al
E
ffi
ci
en
cy
(%)
Gasoline CNG
1500 2000 2500 3000 3500 4000 4500 5000 5500 6000 10
20 30 40 50 60 70 80
r/min
B
rak
e P
ow
er
(k
W)
Gasoline CNG
1500 2000 2500 3000 3500 4000 4500 5000 5500 6000 6.5
7 7.5 8 8.5 9 9.5
r/min
BM
EP
(b
ar)
[image:8.595.316.548.461.604.2]earlier with respect to top dead centre (TDC) and there is greater negative work done on the piston before TDC compared to gasoline. Secondly, the volumetric efficiency that plays one of the most important roles and in CNG engine is less than gasoline. For these reasons, the BMEP of CNG engine is less than gasoline. In addition, the reminder of the BMEP reduction is due to the displacement of air by CNG fuelled when the engine is gasoline base designed.
Figure 15. Comparison BSFC for gasoline and CNG fuels in various
engine speeds
The BSFC for the fuels under study is compared in Figure 16. It is obvious that the BSFC for the CNG engine is less than (c. 9%) gasoline. The main reason is the greater natural gas heating value compared to gasoline.
Figure 16. Comparison BP variations in various equivalence ratio
(gasoline)
Equivalence ratio (
φ
) has an important effect on engine performance and emissions. The figure 17 shows this effect and it shows that brake power changes from 14 to 72 kW over the range ofφ
and speeds of the engine. Also,φ
has a significant effect on the rate of NOx emissions. The point ofmaximum NOx emission occurs for all engine speeds at near
φ
=0.8, leaning or enriching the mixture from this point decrease NOx emission rate (Fig. 18) [27, 30]. However, themodel predicts CO emissions is low when the mixture is lean (
φ
< 0.8), and afterφ
> 0.8, CO emission increases (Figure 19) [27, 30].Figure 17. Comparison of NOx mole fraction in various equivalence ratio
[image:9.595.316.548.77.248.2](gasoline)
Figure 18. Comparison of CO mole fraction in various equivalince ratio
(gasoline)
Figure 19. Comparison BSNOx for gasoline and CNG fuels in various
[image:9.595.62.298.179.334.2]engine speeds
Figure 20, shows BSNOx emissions for both CNG and
gasoline fuels. It is clear that more BSNOxis created by CNG
fuel than gasoline. The reactions that lead to the NOx
formation takes place mainly at high temperatures. As mentioned earlier, the effect of cooling at the time of
15 20 25 30 35 40 45 50 55 60
280 290 300 310 320 330 340 350 360
r/min(*100)
BS
FC
(g
r/k
W
-h
r)
Gasoline CNG
0.7 0.8 0.9 1 1.1 1.2
10 20 30 40 50 60 70 80
Equivalence Ratio (φ)
B
rak
e P
ow
er
(k
W)
1500 r/min 2000 r/min 2500 r/min 3000 r/min 3500 r/min 4000 r/min 4500 r/min 5000 r/min 5500 r/min 6000 r/min
0.4 0.6 0.8 1 1.2 1.4 1.6
0 1 2 3 4 5 6 x 10⁻³
NO
x
Equivalence Ratio (
φ
)
1500 r/min 2000 r/min 2500 r/min 3000 r/min 3500 r/min 4000 r/min 4500 r/min 5000 r/min 5500 r/min 6000 r/min
0.4 0.6 0.8 1 1.2 1.4 1.6
0 0.02 0.04 0.06 0.08 0.1 0.12 0.14
C
O
Equivalence Ratio (φ)
1500 r/min 2000 r/min 2500 r/min 3000 r/min 3500 r/min 4000 r/min 4500 r/min 5000 r/min 5500 r/min 6000 r/min
1500 2000 2500 3000 3500 4000 4500 5000 5500 6000 0
1 2 3 4 5 6 7 8
r/min
BS
N
O x
(g
rm
/Kw
h)
[image:9.595.316.549.292.453.2] [image:9.595.65.292.427.585.2] [image:9.595.315.549.495.655.2]evaporation does not occur for CNG. Consequently, the initial temperature of CNG air/fuel charge at the start of combustion will be greater than gasoline.
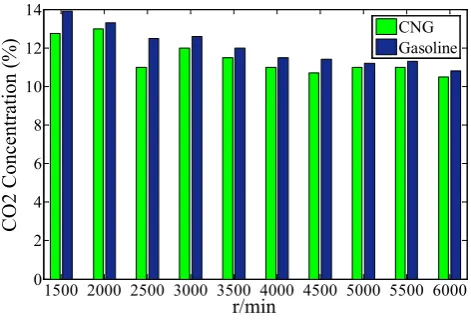
Figure 20. Comparison CO2 concentration for gasoline and CNG fuels in
various engine speeds
This will lead to the increase of the maximum temperature in cylinder and finally produce more NOx. On the other hand,
with regard to the fact that the flame speed of CNG is less than gasoline, there will be a need to have a greater spark advance as compared to gasoline. The greater spark advance will increase the maximum temperature and pressure inside the cylinder. Three-way catalytic converters are used in vehicle emissions control system and can be used to treat NOx reduction specifically with the CNG operation (0.91<φ
< 0.95). In addition, natural gas contains very little sulphur oxide (10 PPM) and for this reason has a lowest destructive effect on catalytic converters compared with gasoline [2].
In Figures 21 and 22, the concentration of CO2 and BSCO
in exhaust gases may be observed. The amount of CO2 in
hydrocarbon combustion is proportional to the carbon to hydrogen ratio. The main component of natural gas is methane, which has the lowest carbon to hydrogen ratio (C/H Ratio) compared with other hydrocarbons. Therefore, the CO2 produced in CNG combustion is less than gasoline (Fig.
21).
Figure 21. Comparison BSCO for gasoline and CNG fuels in various
engine speeds
The C/H ratio of fuel affects the production of CO, for this reason CO produced in CNG combustion less than gasoline (Fig. 22). In addition, flame quenching at the walls of the cylinder and the wall oil film deposits are additional sources of CO.
Finally, as a significant result, this case study is shown, which average rate reductions of CO2 and CO for CNG
engine compared to gasoline are about 29 g/Km and 8 g/Km [2] respectively. With the assumption of mean travel through the distance of each vehicle about 30000 Km the annual rate reduction of CO2 and CO for each CNG engine will be about
860 and 240 kg/year, respectively compared to gasoline engine.
Figure 22. Comparison BSCO for gasoline and CNG fuels in various
engine speeds
5. Conclusions
A quasi dimensional thermodynamic model of bi-fuel (CNG and Gasoline) spark ignition engine is presented in this paper. It is capable of simulating turbulent combustion and compared to CFD it is computationally faster.The results of the model were compared to experimental data and the validity of the model was confirmed. The model is capable of prediction and analysis and it is useful for optimisation of the engine performance parameters. The results shows the benefits and disadvantages of CNG as an alternative fuel for gasoline based designed bi-fuel engine used as a midterm approach solution.
Natural gas has smaller C/H ratio of fuel in comparison to gasoline and for this reason it produces the lower amounts of CO2 and CO, these reductions are significant annually when
the vehicles are used in heavy traffic situations. CNG fuel decreases volumetric efficiency, increases temperature of combustion and finally it produces more BSNOx when
compared to gasoline. However, three-way catalytic converter is a part of vehicle emissions control system and can treat NOx with the CNG operation (0.91<
φ
< 0.95).Moreover, natural gas in this study contained very little sulphur oxide and for this reason has a lower destructive
1500 2000 2500 3000 3500 4000 4500 5000 5500 6000 0
2 4 6 8 10 12 14
r/min
C
O
2 C
onc
ent
ra
tion (
%
) CNGGasoline
1500 2000 2500 3000 3500 4000 4500 5000 5500 6000 0
2 4 6 8 10 12 14
r/min
C
O
2 C
onc
ent
ra
tion (
%
) CNGGasoline
1500 2000 2500 3000 3500 4000 4500 5000 5500 6000 0
0.5 1 1.5 2 2.5 3
r/min
B
SC
O (
gr
m
/Kw
h)
[image:10.595.316.548.241.420.2] [image:10.595.60.295.569.726.2]effect upon catalytic converters compared with gasoline. In addition, CNG is usually cheaper than gasoline and therefore it is a more economical fuel. The BSFC of an engine fuelled with CNG is less than gasoline-fuelled and the main reason is the greater heating value of natural gas compared to gasoline. The volumetric efficiency plays the most important role between the other engine parameters, i.e., the decreasing of volumetric efficiency in CNG will decrease the BMEP and finally decrease work done. Therefore, the thermal efficiency of a CNG fuelled engine is less than gasoline. Using CNG will decrease brake power (BP) in gasoline base engine designed. In order to remove this problem it is possible to use a turbo charger, redesigned intake manifold and increase the compression ratio.
In order to obtain an engine with lowest pollution, better performance as shown by the result of this paper, engines should be designed specifically for each type of fuel. Therefore, in the bi-fuel engine, the optimality of the performance parameters should be sacrificed.
Conflict of Interests
We, as the authors of this manuscript do not have any direct financial relation with the commercial identities mentioned in this paper that might lead to a conflict of interest for any of the authors.
Notation
A: Area exposed to heat transfer (m2)
aBDC: After BDC
aTDC: After TDC
b: Bore of cylinder (m) bBDC: Before BDC
bTDC: Before TDC
Cp: Specific heat at constant pressure (J.kg-1.k-1)
Cb: Blow by coefficient (s-1)
E: Total energy (J) EVC: Exhaust valve closing EVO: Exhaust valve opening H: Enthalpy (J)
h: Specific enthalpy (J.kg-1)
h: Heat transfer coefficient (W.m-2.K-1)
IVC: Inlet valve closing IVO: Inlet valve opening m: Mass (kg)
P: Pressure (Pa) PPM: Particle per million Q: Heat transfer (J) r: Compression ratio R: Gas constant
RON: Research octane number S: Specific entropy (J.kg-1.K-1)
T: Temperature (K)
up: Engine piston speed (m/s)
v: Specific volume (m3.kg-1)
V: Volume (m3)
W: Work done (J) WOT: Wide open throttle
x: Burnt mass fraction θ: Crank angle (°CA) θ0: Start of combustion (°CA)
∆θ: Total combustion duration (°CA) ω: Angular velocity (rad.s-1)
φ: Equivalence ratio ed
ϕ
: Charge up efficiency rγ
: Mole fractionREFERENCES
[1] Cho H.M., He B.Q., Spark Ignition Natural Gas Engines-A Review, Journal of Energy Conversion and Management, 2007, 48-608-618.
[2] Rezapour K., Ebrahimi K.M., The Necessity of Using CNG Fuel and Gasification of Vehicle in Iran, Proceeding of 3rd International Energy, Exergy and Environment Symposium (IEEES3), 2007.
[3] Lapetz J., McCarthny D., Greenfield N., Czapski R., Geftos and T., Rosson J., Development of the Ford QVM CNG Bi-Fuel 4.9L F-Series Pickup Truck, Society of Automotive Engineering, 1996, Paper N0.960850.
[4] DuanS.Y., Using Natural Gas in Engines: Laboratory Experience with the use of Natural Gas Fuel in IC Engine, IMechE Seminar Publication, 1996, pp. 39-46.
[5] Zuo C., Zhao K.A., Quasi-dimensional Model of SI Natural Gas Engines with Pre-chamber, Society of Automotive Engineers, 1997, Paper No. 972994.
[6] Conte E., Boulouchos K., A Quasi-Dimensional Model for Estimating the Influence of Hydrogen-Rich Gas Addition on Turbulent Flame Speed and Flame Front Propagation in IC-SI Engines, SAE, 2005, Paper No. 2005-01-0232.
[7] Verhelst S., Sierens R., A Quasi-Dimensional Model for the Power Cycle of a Hydrogen-Fuelled ICE, Int. J Hydrogen Energy, 2007, 32, 3545-3554.
[8] Evan R.L., BlaszczykJ.A., Comparative Study of The Performance and Exhaust Emissions of a Spark Ignition Engine Fuelled by Natural Gas and Gasoline, Proc. Inst. Mech. Engrs., 1997, D00295.
[9] Sun X., Lutz A., Vermiglio E., Arold M., and Wiedmann T., The Development of the GM 2.2 CNG Bi-Fuel Passenger Cars, Society of Automotive Engineers, 1998, Paper No.982445.
[10] Valpato O., Theunissen F., andMazara R., Engine Management for Multi Fuel Plus Compressed Natural Gas Vehicles, Society of Automotive Engineers, 2005, Paper Series 2005-01-3777.
Retrofitted Gasoline Vehicle, Journal of fuel research, Fuel 85, 2006, p. 717.
[12] Rakopoulos C.D., and MichosC.N., Development and Validation of a Multi-Zone Combustion Model for Performance and Nitric Oxide Formation in Syngas Fueled Spark Ignition Engine, Energy Convers and Manage, 2008, 49, 2924-2938.
[13] Baratta M., Catania A.E., Spessa E., and Vassallo A., Development and Assessment of a Multi-zone Combustion Simulation Code for SI Engines Based on a Novel Fractal Model´, SAE, 2006, Paper No. 2006-01-0048
[14] Sulaiman M.Y., Ayob M.R., Meran I., Performance of Single Cylinder Spark Ignition Engine Fueled by LPG, Procedia Engineering Journal, Volume 53, 2013, 579-585
[15] Ramjee E., Vijaya Kumar Reddy K., Performance Analysis of a 4-Stroke SI Engine Using CNG As an Alternative Fuel, Indian Journal of Science and technology, Volume 4, No.7, July 2011
[16] Joshi A., Poonia M.P., Jethoo A.S., Mathematical Modeling of the Dual Fuel Engine Cycle, International Journal of Engineering and Innovative Technology (IJEIT), Volume 2, Issue 1, July 2012
[17] Ferguson C.R., Internal Combustion Engines, Applied Thermo-sciences, New York, John Wiley and Sons, 1968 [18] Gordon S., and McBride B.J., Computer Program for
Calculation of Complex Chemical Equilibrium Composition, Rocket Performance, Incident and Reflected Shocks, and Chapman Jouguet Detonations, NASA publication, 1971, SP-273.
[19] JANAF Thermo-Chemical Tables, United States National Bureau of Standard Publication, 1971, NSRDS-NBS 37. [20] Cengel Yunus A., Thermodynamic an Engineering Approach,
Fifth Edition, McGraw Hill, 2005.
[21] Methghalchi M., Keck, J.C., Laminar Burning Velocity of
Propane Air Mixture at High Temperature and Pressure, Combustion and Flame, 1980, 143-154.
[22] Gu X. J., Haq M. Z., Lawes M., and Woolley R., Laminar Burning Velocity and Markstein Lengths of Methane-Air Mixtures, Combustion and Flame, 2000, 12, pp. 41-58. [23] Verhelst S., A Study of the Combustion in Hydrogen-Fuelled
Internal Combustion Engines, PhD thesis, Ghent University, Gent, Belgium, 2005.
[24] Boulouchos K., Steiner T., and Dimopoulos P., Investigation of Flame Speed Models for Flame Growth during Premixed Engine Combustion, Society of Automotive Engineers, 1994, Paper No. 940476.
[25] Olikara C., and Borman G.L., Calculating Properties of Equilibrium Combustion Products with Some Application to I.C. Engines, Society of Automotive Engineers, 1975, Paper No. 750468.
[26] Depcik C., Open-Ended Thermodynamic Cycle Simulation, M.S. Thesis, University of Michigan, Ann Arbor, 2000. [27] Heywood J.B, Internal Combustion Engines Fundamentals,
New York, McGraw Hill, 1998.
[28] Woschni G., A Universally Applicable Equation for the Instantaneous Heat Transfer Coefficient in the Internal Combustion Engine, Society of Automotive Engineers, 1967, Paper No.670931
[29] Bayraktar. H., and Durgun O., Mathematical Modelling of Spark Ignition Engine Cycles, Energy Sources 25, 2003, pp 651–666.
[30] Ferguson Colin R., and Kirkpatrick Allan T., Internal Combustion Engines: Applied Thermo science, 2nd Ed, John Wiley & Sons Inc, 2001.
![Table 1. Woschni’s formula parameters [28]](https://thumb-us.123doks.com/thumbv2/123dok_us/8759487.893641/4.595.78.557.205.707/table-woschni-s-formula-parameters.webp)