Spectroscopic measurements of Si-O recombination process in laser-induced
quartz vapor plumes
Masanori Fuyuki1∗, Seiji Sugita1, Toshihiko Kadono2, Sunao Hasegawa3, and Takafumi Matsui1
1Department of Complexity Science and Engineering, University of Tokyo, 5-1-5 Kashiwanoha, Kashiwa, Chiba 277-8561, Japan 2Institute for Frontier Research on Earth Evolution, Japan Marine Science and Technology Center,
2-15 Natsushima-cho, Yokosuka-city, Kanagawa 237-0061, Japan
3Research Division for Planetary Science, The Institute of Space and Astronautical Science, 3-1-1 Yoshinodai, Sagamihara, Kanagawa 229-8510, Japan
(Received September 20, 2003; Revised June 9, 2006; Accepted January 16, 2007; Online published June 8, 2007)
The thermal dissociation of SiO2in impact-induced vapor is very important because it controls the redox state
of the vapor. However, the thermal dissociation of SiO2 and its recombination are not well understood. The
present study investigates experimentally the kinetics of the Si-O recombination process at high temperatures. Laser-induced quartz vapor is observed by means of time-resolved spectroscopy, and the atomic lines of Si and molecular bands of SiO are measured in order to estimate the temperature and the column densities of Si and SiO. The results of these experiments show that Si and O recombine as the vapor cools from 5000 to 3000 K. A comparison of the observed chemical composition and equilibrium calculations suggests that the recombination reaction between Si and O proceeds rather efficiently under a condition that differs significantly from the thermo-chemical equilibrium. This result is explained well if the rate constant of the Si-O recombination process does not depend strongly on the temperature; the activation energy is very small. These results suggest that the Si-O recombination process may not be approximated by a frequently-used ‘freeze-out’ model.
Key words: Si-O recombination process, laser-induced quartz vapor plume, time-resolved spectroscopy, Si atomic lines, SiO molecular bands, chemical equilibrium calculation, activation energy.
1.
Introduction
The heavy bombardment of planetesimals is considered to have occurred during the early stage of the Earth’s his-tory (e.g., BVSP, 1981). The degassing of these planetesi-mals during impacts resulted in the release of volatiles. An important aspect of vaporization of silicates, as opposed to degassing of volatile components, is the thermal
dissocia-tion of SiO2. Mukhinet al.(1989) suggested that molecular
oxygen released by the thermal dissociation of SiO2 in an
impact-induced vapor plume may play an important role in controlling the redox state of carbon and metals and, con-sequently affect the origin and evolution of planetary atmo-spheres and life.
In addition to the asteroids and comets, small particles— the so-called interplanetary dust particles (IDP’s)— constantly impact the surface of airless bodies, such as
as-teroids and the moon (e.g., Divine, 1993; Sasaki et al.,
2001). Since the main component of IDP’s is silicate, the
dissociation of SiO2 in such small-size vapor plumes also
plays an important role in the formation of the regolith on the lunar surface.
The recombination process of Si and O atoms to SiO and
∗Now at Genesis Research Institute, Inc., Futamata 717-86, Chiba
272-0001, Japan.
Copyright cThe Society of Geomagnetism and Earth, Planetary and Space Sci-ences (SGEPSS); The Seismological Society of Japan; The Volcanological Society of Japan; The Geodetic Society of Japan; The Japanese Society for Planetary Sci-ences; TERRAPUB.
O2 molecules is the first step in the formation process of
SiO2: the second step consists of SiO+O2 → SiO2+O
or SiO + O → SiO2. These reactions take place at
very high temperatures. A number of calculations have been conducted to estimate the rate constants of such high-temperature reactions among different molecules. The ox-idation process of Al is sometimes used to estimate that of Si. Park (1976) provided the rate constants of gas-phase reactions (including Al, Cl, O, and H) expected to occur among the constituents of the exhaust gas of a solid-fuel rocket engine in the hot region behind the Mach disk. In these rate constants, the activation energy of an exothermic reactions was assumed to be 0 kJ/mol. Park and Arnold (1978) subsequently applied this assumption to these reac-tions including Si.
The properties of C atoms, such as collisional cross sec-tion with other atoms and molecules, are also often used to
predict the properties of Si. Fegleyet al.(1986) provided
the rate constants of the reactions relevant to destruction process of CN and HNO by a large impact in the shock-heated atmosphere of the ancient Earth. In their list, the activation energy of the exothermic reactions are not
neces-sarily∼0 kJ/mol, but the value depends on the reactants. In
other words, some rate constants depend on temperature ex-ponentially and some others do not. Given this background, it is therefore impossible to predict whether the rate con-stant of the Si-O recombination process and that of SiO-O
have∼0 kJ/mol activation energy based solely on a
com-parison with other elements.
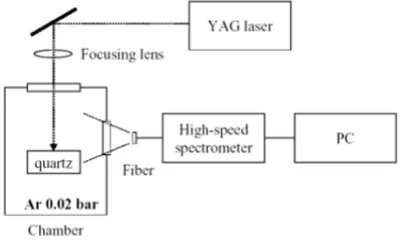
Fig. 1. A schematic diagram of our experimental system.
Usingab initiocalculation, Andreazza et al.(1995)
es-timated the rate constant of the recombination of Si and O and found that it does not depend on the temperature ex-ponentially and that the activation energy of the process is
∼0 kJ/mol. In their calculation, the Si-O recombination is
assumed to be a radiative association reaction.
The objective of the experiments reported here was to in-vestigate empirically whether the rate constant of the Si-O recombination process is strongly temperature dependent; i.e., whether the activation energy of the process is practi-cally 0 kJ/mol or significantly higher than 0 kJ/mol.
Small activation energy as this has a very important im-plication to planetary science. Silicates in impact-induced vapor plumes are often assumed to condense and essen-tially to go outside the chemical reaction system at very high temperatures and to have no influence on the subse-quent chemical reactions among volatile elements, such as C, N, and H, at lower temperatures. This is based on a so-called ‘freeze-out’ model. In this model, when the tempera-ture is higher than the quenching temperatempera-ture, the chemical composition is given by the equilibrium composition at that temperature. When the temperature goes below the quench-ing temperature, the chemical reaction stops suddenly; con-sequently, the chemical composition becomes fixed at the quenching temperature, and freeze-out occurs. However, such a freeze-out model works only if the activation energy of the reaction is high. If the activation energy is small, such a sudden cessation of the chemical reaction does not occur and a freeze-out model is not applicable.
In the experiments described here, we used a pulsed laser
to heat quartz (i.e., SiO2) to produce a vapor of Si and O
atoms. Then the resulting vapor plumes were then observed using a high-speed spectrometer. Based on our analysis of the spectroscopic data, we estimated a change in the chemi-cal composition during expansion and cooling of the plume. We also calculated the equilibrium chemical composition of the high-temperature vapor and compared it with the ob-served chemical composition. Taking the cooling rate of the vapor and the number ratio of reactants and products into consideration, we discuss how the rate constant of Si-O recombination reaction is temperature-dependent.
2.
Experiments
2.1 Experimental condition
Our experimental system is schematically shown in Fig. 1. A quartz sample was placed in a vacuum chamber
filled with argon (0.02 bar). Argon does not react with the chemical compounds in the resulting vapor but it does slow the expansion speed of vapor, thereby allowing more time for spectroscopic observation. The sample was exposed to
a Nd:YAG laser pulse (wavelength: 1.06μm, energy per
pulse: 380 mJ, and pulse width: 15 ns). The diameter of the irradiation spot was 2 mmand, therefore, the power
den-sity of the beam was about 109 W/cm2. Laser-induced
va-por plumes were observed using a high-speed spectrometer (PI-MAX 1024, Prinston Instruments.). The wavelength of the spectrometer was calibrated using a Hg lamp, and ob-servation were made between 160 nm and 440 nm. The full width of the half maximum (FWHM) of the instrumental function of our system is 0.90 nm. For the intensity calibra-tion, we used a Xenon lamp (Hamamatsu Photonics Inc., model L7810). Exposure of the spectrometer was triggered by a photodiode that captures the laser light scattered on the target. The rise time of the photodiode is 5 ns.
2.2 Experimental results
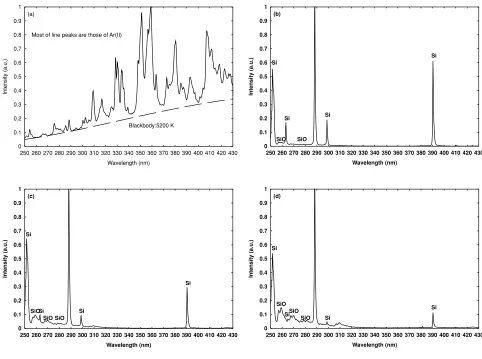
About 10–20 mg of the quartz sample was lost after the sample had been exposed 1000 times to the laser pulse. Fig-ure 2 shows the observed spectra as a function of time after the laser irradiation. In order to improve the signal-to-noise (S/N) ratio, more than 100 pieces of data were added to-gether under the same irradiation conditions. Immediately after a laser irradiation, blackbody radiation and ionized ar-gon lines were observed (Fig. 2(a)). The Arar-gon II lines indicate the presence of ionized plasma and the possible non-thermal acceleration of the plume by the electron cloud during the earliest stage of a laser-induced plume. Several microseconds after the irradiation, the spectra of Si and SiO
produced by the dissociation of SiO2 appeared (Fig. 2(b)).
Emission bands between 250 and 300 nm are those of SiO Main System. All of the spectra shown in Fig. 2 (b)–(d) are normalized with the intensity of the Si line spectrum at 288
nm. In the observation period between 20 and 100μs, the
blackbody radiation was not as strong as the Si line emis-sions or SiO band emisemis-sions, indicating that the vapor ex-panded and that condensates are not the main components of the vapor plume but that the gas phase is dominant during this period of time. We found that the normalized intensity of the SiO spectra increased with time, suggesting that Si and O were recombining rapidly and that the oxygen fugac-ity in the vapor plume decreased rapidly as the vapor cooled down. Atomic oxygens emit their line spectrum strongly at 777 nm (Wiese and Martin, 1980), but this wavelength is far from the region where SiO molecules emit their band spectra. The ICCD detector is also very insensitive to such a long wavelength. In order to observe emission spectrum with high enough spectral resolution to analyze observed spectra, we focused on observing the spectra of Si and SiO in the UV wavelength range. After the observation, we ex-amined the inside of the chamber and found condensates around the sample.
3.
Analysis
(a
250 260 270 280 290 300 310 320 330 340 350 360 370 380 390 400 410 420 430
In
250 260 270 280 290 300 310 320 330 340 350 360 370 380 390 400 410 420 430
Wavelength (nm)
250 260 270 280 290 300 310 320 330 340 350 360 370 380 390 400 410 420 430
In
250 260 270 280 290 300 310 320 330 340 350 360 370 380 390 400 410 420 430
In
Wavelength (nm) Blackbody:5200 K Most of line peaks are those of Ar(II)
(a)
Fig. 2. Observed emission spectra as a function of time after the laser irradiation. Exposure time for each spectrum is: (a) 10–13 ns, (b) 20–21μs, (c) 40–60μs, (d) 80–100μs. The number of data added together for each condition is: (a) 100, (b) 500, (c) 500, (d) 500. The intensity scale for the spectra in Fig. 2(b)–(d) is normalized by Si line spectrum at 288.1 nm. The band emissions at 307 nm and 310 nm in Fig. 2(d) are those of NO due to contamination of Air.
of Si to SiO from the ratio of spectral intensity of Si line emission to SiO band emission.
NSi
where NSi and NSiO are the number densities of each
species,ISiandISiOare the intensities of observed spectra,
ESiis an intensity of the theoretical emission spectrum from
a Si atom without self-absorption, and ESiO is an intensity
of the theoretical emission spectrum from a SiO particle
without self-absorption. The symbolsτSi andτSiO denote
the optical thickness of Si and SiO, respectively.
The first step is to measure the temperature of the vapor in the earliest stage of vapor expansion based on the black-body radiation observed. The second step is to estimate the temperature of Si at different observation times based on the intensities of Si lines, followed by and estimation of the temperature based on the SiO spectral pattern. Unlike Si spectra, each rotational line in the SiO band cannot be spec-trally separated. The temperature and column density of SiO are then estimated simultaneously. The optical
thick-nessτSiOof the SiO Main system is calculated based on the
estimated temperature and column density, and the
emis-sion intensities ESi and ESiO are then calculated as
func-tions of temperature. Using these values, we are able to
determine the number ratio of NSi/NSiOat different
obser-vation periods.
3.1 The initial vapor temperature
During the first few microseconds after laser irradiation, the blackbody radiation from the dense vapor was so strong that its shape could be used to estimate the temperature (Fig. 2(a)). Comparing theoretical spectra of blackbody ra-diation with the observed spectra, we found that the temper-ature of the vapor in an early stage is about 5200 K (Fig. 3).
3.2 The temperature of Si
Emission lines of Si appeared at 5μs after laser
irradia-tion (Fig. 2(b)). Using optically thin spectral lines, we are able to measure the excitation temperature of atoms (Griem,
1964; Sugitaet al., 1998). However, when there is a large
population of atoms in the lower energy level of the elec-tronic transition that associate with a line emission, the line becomes optically thick and self-absorption occurs (Griem,
1964; Cannon, 1985; Sugitaet al., 1998).
Fig. 3. The blackbody radiation obtained in the early stage of observation (10–13 ns) and Plank functions at various temperatures. Note that the functions are scaled to fit the intensity of the observed spectrum at 260 nm.
0 10000 20000 30000 40000 50000 60000 70000 80000
240 250 260 270 280 290 300 310 320 330 340 350 360 370 380 390 400
E
ner
gy Level
E
/k (K
)
Wavelength (nm) 0
10000 20000 30000 40000 50000 60000 70000 80000
240 250 260 270 280 290 300 310 320 330 340 350 360 370 380 390 400
E
ner
gy Level
E
/k (K
)
Wavelength (nm)
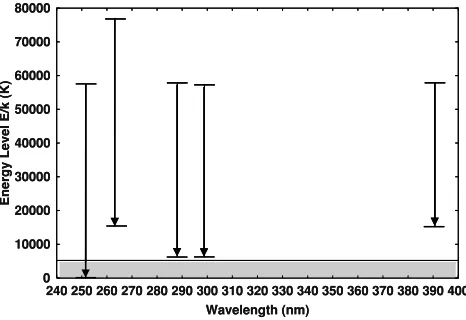
Fig. 4. The upper and lower energy levels of electronic transitions for line emissions of Si. The gray zone shows the region of the temperature the vapor plume is expected to experience during expansion.
and which line does not.
Using optically thin Si spectral lines, we can measure the excitation temperature of Si. Since the lower energy lev-els of the spectral lines at 263 nm and 391 nm are much higher than the gray zone in Fig. 4, the populations of the these energy levels are much smaller than unity throughout the observation period. We assume that the lines are well thermalized. In a thermodynamic equilibrium, the popula-tions of these states are given by a Boltzmann distribution:
gexp(−E/kT)/Z, where Z, g, E,k, andT are partition
function, statistical weight, energy level of a state, Boltz-mann constant, and temperature, respectively. The popula-tion of the lower energy levels of the line at 263 nm and that
of the line at 391 nm are the same; exp(−15394.24/T)/Z
(Wiese and Martin, 1980). The vapor we observed was ex-pected to cool and fall below the initial temperature of 5200 K during our observation. In this range of temperature, the
partition functionZis approximately unity. In the vapor we
observed, the ratio of the population of the energy level to the total number of atom Si in the vapor plume was then ex-pected to be less than 0.05. As the temperature decreases,
2000 4000 6000 8000
1 5 10 50 100 200
T
e
mperature (K)
Time (us)
Fig. 5. The excitation temperature of Si measured as a function of time. The data show that the vapor plume cools monotonically.
this population ratio will decrease furthermore. Thus spec-tra lines at 263 nm and 391 nm are most likely to be op-tically thin. Assuming that the lines are well thermalized, we can use them to estimate the excitation temperature. Fig-ure 5 shows the temperatFig-ure measFig-ured as a function of time. The data show that the vapor plume cooled monotonically throughout the observation time.
3.3 The temperature and column density of SiO
Although the SiO band spectrum consists of many in-dividual rotational lines, it appeared as a continuous band spectrum with our limited spectral resolution. Thus it was impossible to estimate the temperature and the column den-sity by measuring individual rotational lines of SiO. In or-der to estimate those quantities, we calculated the synthetic spectrograms of the SiO emission band at different atures and densities and searched for the optimum temper-ature and column density that minimize the difference be-tween the synthetics and the observed spectrum in the laser experiments.
There are three steps in such calculations (e.g., Sugita and Schultz, 2003). The first step is to calculate a “source” spectrum, i.e., emission intensity per a unit mass of SiO molecules. This step considers all of the rotational lines and the effects of line broadening but neglects self-absorption. The second step is to calculate the effect of self-absorption, and the third step is to assess the effect of the finite spectral resolution of spectrometers. The details of the procedures are given in Appendix A.
When a synthetic spectrogram is calculated, the result of the synthetic calculation can be compared with experimen-tal results. As such the optimum temperature and column density of SiO that minimize the difference between an ex-perimental spectrum and a theoretical spectrum can then be determined.
The spectral pattern of theoretical synthetics is controlled by both the temperature and the column density of SiO
molecules and the Lorentz/Doppler broadening ratioα. The
ratioαis different for each rotational line of a source
spec-trum (see Appendix B). Here we use the ratio αfor the
rotational line at 270 nm as the reference ratioα. For
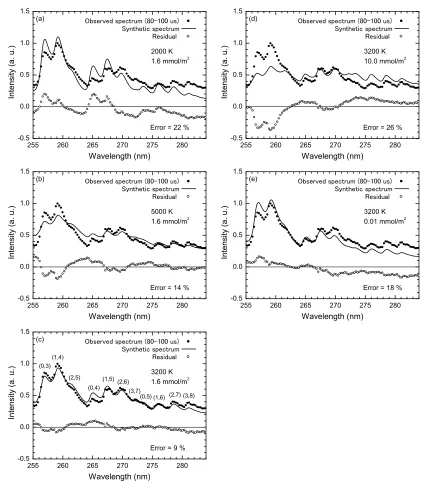
Fig. 6. Comparison between an observed spectrum and several theoretical synthetics of the SiO Main System with various model parameters. The bands of strong intensities are separated into three parts byν. The observed spectrum was obtained in the observation period between 80μs and 100μs. The calculation is only for a single value of the line-broadening ratioαof 0.1.
a synthetic spectrum and compared this with an observed spectrum. The degree of similarity was assessed with the
square meanErof the difference defined as
Er =
Isyn(λ)−Iobs(λ)
2
dλ
[Iobs(λ)]2dλ (2)
whereIsynandIobsare a synthetic and an observed spectra,
respectively (e.g., Sugita and Schultz, 2003). The
combi-nation of the parameters that minimizes the errorEris
con-sidered to be the optimum condition to describe an observed emission spectrum.
A comparison between an observed spectrum of the SiO Main System and theoretical synthetics with different con-trolling parameters is shown in Fig. 6. The bands of strong
intensities are separated into three parts with differentν,
where ν is the difference in vibrational quantum
num-ber between the upper and lower states associated with the emission. When too low a temperature is used for a synthetic calculation, the intensities of the band heads at shorter wavelengths of each part become too high, whereas those at longer wavelengths become too low (Fig. 6(a)). When too high a temperature is used, the intensities of the band heads at shorter wavelengths of each part become too low, whereas those at longer wavelengths become too high (Fig. 6(b)). Only when an optimum temperature is chosen can the pattern of intensity be reproduced with a small error (Fig. 6(c)). Note that the intensity of a synthetic spectrum is optimally scaled in such a way that the mean square
-5.0
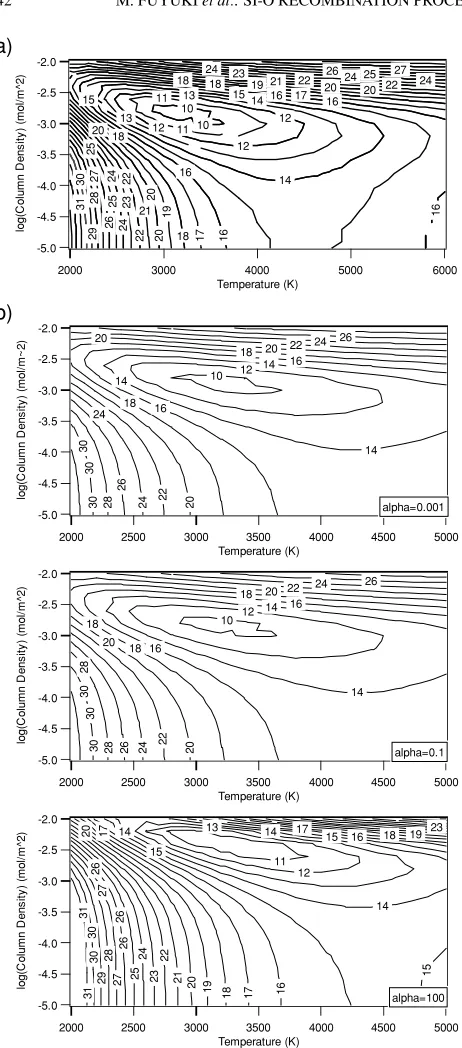
Fig. 7. (a) Contour map of the square mean error (%) of synthetic spectra as a function of both temperature and column density of SiO molecules. The observed spectrum shown in Fig. 6 is used here for the analysis. The minimum error is given by the temperature of 3200 K and column density of 1.6 mmol/m2. This error analysis assumes the ratio of line-broadening factorαof 0.1. The optimum temperature depends only a little onα, and the optimum column density depends somewhat onα. (b) Contour maps of the square mean error (%) of synthetic spectra as a function of both temperature and column density of SiO molecules. The observed spectrum shown in Fig. 6 is used here for the analysis. The line broadening ratioαfor each estimation is indicated in the figures. These figures show how the optimum set of temperature and column density depends onα. The optimum temperature depends only a little onα, and the optimum column density depends somewhat onα.
When too large or too low a value of column density of SiO molecules is used, a synthetic spectrum with the opti-mum temperature fails to resemble the observed spectrum.
1e-005 0.0001 0.001 0.01
2000 2500 3000 3500 4000 4500 5000 5500 6000
Colum
Fig. 8. The temperature and column density derived from SiO molecular radiation. The data points denoted by diamonds in the figure are ob-served 20–21μs, 40–60μs, 60–80μs, and 80–100μs after the laser irradiation, respectively from the right to the left. The temperature and column density with the square meanErof the difference smaller than 12% are considered to be the optimum. The vertical error bars are es-timated by the uncertainty in the electronic transition probability (30%) and that in the line-broadening ratioα. With largerα, the optimal col-umn density becomes higher. The data points denoted by diamonds on each cross indicates the values whenαis assumed 1.0. Horizontal errors are estimated by only the square meanEr.
A gas body emits the blackbody radiation when the source spectrum is fully self-absorbed. Since the optimum tem-perature in our study was relatively low (i.e., 3200 K), the intensity of blackbody radiation was stronger at a longer wavelength within the range (250–430 nm) covered. When too large a value of column density was used, the spectrum of SiO became close to the blackbody radiation (Fig. 6(d)). When too low a value of column density was used, the opposite occured; i.e., the intensity at the shorter wave-length became stronger and that at the longer wavewave-length became weaker (Fig. 6(e)). Consequently, both temperature and self-absorption changed the shape of the emission spec-trum, and the effects of the two parameters were different. Thus a quantitative analysis can determine simultaneously the optimum values of both temperature and column den-sity.
The square mean Er of the difference for the same
ob-served spectrum is shown in Fig. 7(a) as a function of both the temperature and column density of SiO molecules. Fig-ure 7(a) shows that the optimum temperatFig-ure and column
densities are about 3200 K and 1.6 mmol/m2, respectively.
In our analysis, the temperature and column density with
the square mean Er of the difference smaller than 12%
are treated as optimum. The calculation is only for a
sin-gle value of the line-broadening factorαof 0.1. The
op-timum range of temperature depends only very little onα,
and that of optimum column density depends somewhat on
α(Fig. 7(b)). The optimum ranges of temperature and
col-umn density as a function of assumedαare calculated for
the emission spectrum of each observation period.
A summary of the temperature and column density de-rived from SiO molecular emission is given in Fig. 8, which shows the temperature and column density of SiO observed
Fig. 9. The optical thickness of synthetic spectra as a function of temper-ature and column density. The line-broadening ratioαis assumed 0.1. The optimum sets of temperature and column density with the errorEr
smaller than 12% are also shown in the figure. The observation periods for optimum sets are 20–21μs, 40–60μs, 60–80μs, and 80–100μs, respectively from right to left.
laser irradiation. The optimum sets of temperature and
col-umn density with the error Er smaller than 12% are also
shown in Fig. 8. The vertical error bars also indicate the uncertainty due to the electronic transition probability (30%
(Parket al., 1993)) and the line-broadening ratioα. A larger
αvalue leads to a higher column density. It is because line
broadening weakens the effect of self-absorption and the
column density strengthens the effect. The range ofαis
de-termined using the collision rate of Si. The detail is given in Appendix B.
It is to be noted that the column density of SiO was seen to increase as the temperature decreased. This trend cannot be explained by a simple expansion of the vapor without chemical reactions. If the vapor expands without chemical reactions, the column densities of compounds should de-crease with temperature. Thus, the observed inde-crease in the column density of SiO indicates that SiO may have resulted from Si-O recombination process in the vapor. This is dis-cussed in detail in Section 4.
3.4 The degree of self-absorption of SiO main system
It is necessary to determine the degree of self-absorption of the SiO Main system in order to derive the number ra-tio of Si to SiO from the rara-tio of Si line emission inten-sity to that of SiO band emission (see Eq. (1)). The optical thickness for each observed spectrum was calculated using the optimum temperature and column density determined
in Section 3.3. Figure 9 shows the optical thicknessτ of
synthetic spectra as a function of temperature and column
density. The line-broadening ratioαis assumed to be 0.1.
Figure 9 shows that the optical thickness of the SiO Main system is smaller than 0.5. With a larger line-broadening
ra-tioα, the optimum column density is lower and the optical
thickness does not depend on the ratio. The optical thick-ness of the SiO Main system fell within the range from 0 to 0.5 during the observation.
3.5 The temperatures of Si and SiO
We can now compare the temperatures of Si and SiO (Figs. 5 and 8). These were found to agree well in the
i
O
ty
S
i
I
n
tens
i
Ra
t
i
o of
0.01 0.1 1 10
10 100
vs S
Time (us)
Fig. 10. The ratio of intensity of observed spectra of Si emission line at 391 nm to that of the SiO Main system between 256 nm and 284 nm.
observation periods between 40 and 80μs. The difference
between their central values is less than 200 K. Thus, the Si and SiO we observed are likely to be in the most luminous part of the vapor. However, the Si and SiO temperatures
do not agree very well between 20 and 21μs and between
80 and 100μs. In the spectrum observed during the early
stage (i.e., 20–21μs), the intensity of the SiO Main system
is so weak that its pattern is not observed with a high S/N ratio. Thus the temperature of SiO determined is not very reliable. In the spectrum observed during a late stage (i.e.,
80–100 μs), the line spectrum of Si 263 nm is so weak
that the excitation temperature of Si determined has a large uncertainty. Then, we assume that the temperature of Si and that of SiO are the same in the observation periods between
20 and 100μs. The excitation temperature of Si used was
that of the most luminous part of the vapor between 20 and
21μs and the SiO temperature is used was that of vapor
between 40 and 100μs.
The temperatureT of an expanding vapor plume is fitted
well by a power-law function of timet,T = A×t−b, where
Aandbare constants (Kadonoet al., 2002). The value ofb
is 0.22±0.02 for the vapor plumes observed in this study.
A characteristic timescale of the cooling of the vaporθT is
given by
θT =!!!!(d T/dt)
T !!
!!−1. (3)
The cooling rate changes as the vapor cools. The timescale
θT depends on the temperature by the power of about−5.7.
3.6 Si versus SiO in the vapor plume
Figure 10 shows the ratio of the intensity of the Si line at 391 nm to that of the SiO Main system between 256 nm and 284 nm in the observed spectra. This ratio is the ratio
ISiO/ISiin Eq. (1). Figure 11 shows the intensitiesESiand
ESiOof the theoretical emission spectra from a Si atom and
a SiO molecule. Using the temperature of the vapor, the
ratio ESiO/ESiin Eq. (1) was calculated for each
observa-tion period. The optical thickness τ of Si at 391 nm can
0.01
2000 2500 3000 3500 4000 4500 5000
Intens
2000 2500 3000 3500 4000 4500 5000
Intens
Fig. 11. The intensities of theoretical source spectra from: (a) a Si atom at 391 nm and (b) a SiO molecule between 256 nm and 284 nm.
ratio of Si atoms to SiO molecules as a function of temper-ature. The monotonic decrease in the Si/SiO ratio strongly suggests that silicon atoms and oxygen atoms recombine to SiO molecules as the temperature decreases.
4.
Discussion
In this section, we discuss the chemical equilibrium cal-culation of the Si-O system under possible conditions with the aim of determining whether the observed reaction pro-cess is consistent with a chemical-equilibrium model.
4.1 The chemical equilibrium of the SiO2system
We carried out chemical equilibrium calculation us-ing the Gibbs-free-energy minimization method and the
JANAF thermo-chemical tables (Chaseet al., 1985). Since
the samples used for the experiments are SiO2 crystals,
the calculation system comprises entirely Si and O; the silicon-to-oxygen ratio is 1:2. The following atoms and molecules are included in the calculation: Si(g), SiO(g),
SiO2(g), O(g), O2(g), Si(c), SiO2(c). The symbols (g) and
(c) indicate gas and condensed phases, respectively. The ideal and Van der Waals equation of state are used for the gas-phase calculation. Note that Van der Waals radius of
the SiO2 molecule is much larger than those of the other
molecules. We use Van der Waals equation of state only for
SiO2molecule. The critical constants of SiO2molecule are
given by Ahrens and O’keefe (1972).
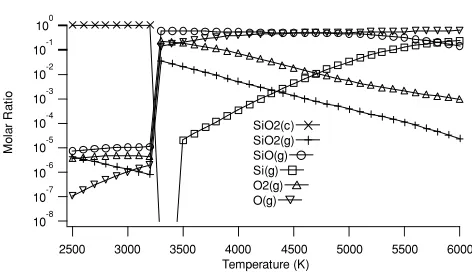
Figure 13 shows the molar fraction of each compound under a chemical equilibrium as a function of temperature between 2500 and 6000 K at 1 bar. We fix the pressure for this calculation to show how the chemical equilibrium depends on temperature. The value of 1 bar is just a refer-ence pressure between the highest and lowest pressures ex-pected for the vapor. The pressure of the vapor observed is expected to be several thousand bars immediately after the
laser irradiation (Hamanoet al., 2003). The pressure of the
ambient gas Ar is 0.02 bar. Thus the pressure of the vapor we observe is expected to change between the two values. In a thermal equilibrium system at high temperatures, most
of SiO2 molecules are dissociated to Si and O atoms. As
the system cools under an equilibrium, Si and O atoms
re-combine to SiO and O2molecules. When the system cools
further, almost all of the gas compounds recombine to
liq-uid SiO2. The temperature at which condensation begins
depends on pressure: if the pressure of the system is higher, the incipient condensation temperature is higher, and vice versa.
It should be noted that there is always a possibility that ionic compounds are produced by the vaporization of rocks (Kubicki and Stolper, 1993). In our experiment, this trans-lates into the possibility that ionic compounds such as
[SiO4]4− and Si+were produced. There is also a
possibil-ity that clusters will be produced. However, as there is no quantitative thermodynamic data for these ionic compounds and clusters to date, it was not possible to investigate quan-titatively the effect of their production on the chemical equi-librium conditions. We use the JANAF table, which is the most recent thermodynamic data available, for the thermo-dynamic calculations and the interpretation of our experi-mental data. The calculation of thermodynamic equilibria, including those of ionic compounds and clusters, will be the focus of future investigations.
We did not observe any blackbody radiation in our ex-periment (Fig. 2(b)–(d)). Thus, laser-induced vapor plumes are most likely to be entirely gaseous. Nevertheless, the absence of strong blackbody radiation cannot fully remove the possibility that there may be some processes that are not observed by visible-light spectroscopy, such as the for-mation of nano-size particles. Nano-size particles are too small to emit visible blackbody radiation and in our calcu-lation, these are effectively included as condensed phase:
SiO2(c) and Si(c). We investigated the possibility that SiO2
condensed in our vapor plume during the spectroscopic ob-servation by comparing the calculated P-T path of the vapor
in the experiment with the saturation curve of SiO2.
We first investigated whether SiO2 had already begun
to condense immediately after the laser irradiation on the sample. We calculated the initial temperature of the va-por plume by extrapolating the observed temperature as a function of time after the laser irradiation. For the initial pressure, we use the equation between the initial tempera-ture and pressure of a laser-induced vapor plume in Sugita et al.(2003). The estimated values are 8600 K and 120 bar;
this pressure is lower than the saturation pressure of SiO2
0.1 1 10 100
2000 2500 3000 3500 4000 4500 5000 5500 6000
Molar Rat
Fig. 12. The number ratio of Si/SiO as a function of temperature. The observation periods for the data points are 20–21μs, 40–60μs, 60–80 μs, and 80–100μs, respectively from right to left. The vertical error bars indicate the uncertainty ofτSiO(0∼ 0.5) and that of electronic transition probabilities of the emission line and band. The data points denoted by diamonds on each cross indicate the value whenτSiOis assumed to be 0.
10-8
Fig. 13. The molar fraction of each compound under a chemical equilib-rium condition. The pressure of the system is fixed at 1 bar.
condensation immediately after the laser irradiation. Alter-natively, the plume was most likely gaseous immediately after the laser irradiation and expanded adiabatically with-out condensation. Condensation starts, however, when the adiabatic curve of the vapor encounters the saturation curve
of SiO2. After this, the pressure and temperature of the
va-por changes along the saturation curve of SiO2.
We next estimated the temperature at which the conden-sation began by calculating the adiabatic curve using the ini-tial temperature and pressure estimated above. The specific heat of the vapor changes as chemical reactions proceed. The ratio of specific heats of Si and O atoms are 1.67, and
the ratio of specific heat of SiO2 molecule is 1.29. Their
recombination reaction is exothermal. Thus, the effective ratio of specific heats is definitely lower than 1.67 and may be slightly lower than 1.29. For the calculation, we as-sumed that the specific heat of the vapor is constant during the adiabatic expansion. We used different values—from 1.1 to 1.67—for the ratio of specific heat for the calcula-tion. The resulting temperature at which the adiabatic curve
encounters the SiO2 saturation curve is between 2000 K
and 4000 K. During the spectroscopic observation period
0.0001
2000 2500 3000 3500 4000 4500 5000 5500 6000
S
Fig. 14. The number ratio of Si/SiO as a function of temperature. The data points with error bars represent the observed Si/SiO number ratio. The observation periods for the data points are 20–21μs, 40–60μs, 60–80 μs, and 80–100μs, respectively from right to left. The four lines rep-resent Si/SiO in chemical equilibrium conditions. Constant pressures [0.02 bar (dash line), 1 bar (dot line), and 10 bar (dash-dot line)] and the saturation pressure of SiO2(dash-dot-dot line) are assumed for cal-culations. If the vapor observed is in a chemical equilibrium, Si/SiO of the vapor is within the region below the dash line (chemical equilib-rium at pressure=0.02 bar). However, the data in the figure show that the Si/SiO ratio is out of any possible equilibrium condition but that it changes from 10 to 0.1 as a function of time. This suggests that Si and O recombine under a non-equilibrium.
(20–100μs), the temperature of the vapor decreased from
4400 K to 3200 K. The estimation of the temperature for the beginning of the condensation indicates that there is a
pos-sibility that the SiO2condensation started during the
obser-vation period. We therefore took the effect of SiO2
conden-sation into account when we investigated whether the Si-O recombination process proceeds under a non-equilibrium condition.
4.2 The recombination of Si and O under a non-equilibrium condition
In order to understand how Si and O recombine within a high-temperature plume, we compared the observed num-ber ratio of Si to SiO with theoretical estimates based on chemical equilibrium.
There are two possibilities for the expansion of the vapor plume in our spectroscopic observation. One possibility is that the vapor plume expanded adiabatically without
con-densation. The other possibility is that SiO2 condensation
proceeded and that the vapor plume evolved along the
sat-uration curve of SiO2. Taking both these possibilities into
account, we investigated whether the Si-O recombination process was consistent with the chemical equilibrium con-dition.
(chemical equilibrium at pressure of 0.02 bar). However, Fig. 14 shows that all the data points are consistently out-side this region throughout the observed time period. Al-though the upper temperature estimates (i.e., the right end of the error bars) for the first three observation times are be-low the 0.02 bar line, the vapor plume is likely to be present at higher than ambient pressure (i.e., 0.02 bar) during the early stage of its expansion. Thus, it is very likely that the observed Si/SiO ratio is not in a chemical equilibrium and that the ratio still changes as a function of time.
Here, it is noted that there is a possibility that the
for-mation rates of the SiO2 gas and solid are very slow,
lead-ing a non-equilibrium chemical composition. Nevertheless, such a factor actually does not change our conclusion. The number ratio of Si to SiO in the chemical equilibrium
cal-culation not including SiO2 is almost equal to that in the
calculation including SiO2. The reason for this is that SiO2
is a very minor component in the gas phase at temperatures and pressures in this study.
We next investigated the Si-O recombination process as-suming the latter possibility. If the Si-O recombination pro-ceeded under the equilibrium condition of the experiment, the Si/SiO ratio in the experiment and that in the chemical
equilibrium calculation on the SiO2saturation curve would
coincide. The calculated Si/SiO ratio on the SiO2
satura-tion curve is shown in Fig. 14 as a dash-dot-dot line, and the Si/SiO ratio in the experiment is significantly higher than this line. Models assuming the chemical equilibrium condition cannot explain the Si-O recombination process
observed regardless of whether the SiO2condensation
pro-ceeded simultaneously or not. Thus, it is very likely that the Si-O recombination reaction proceeds under a non-equilibrium condition.
The transition from equilibrium to non-equilibrium oc-curs when the rate of reaction becomes lower than the cool-ing rate of the vapor. The coolcool-ing rate of the vapor in our experiment is temperature-dependent (see Section 3.5). The timescale of cooling is proportional to the temperature to
the−5.7th power during the observation period between 20
μs and 100μs. The temperature decreases from 4400 K to
3200 K and the cooling timescale increases by a factor of about 6.
The rate of the Si-O reaction is controlled by both the densities of the reactants and the rate constant. The
timescale θSiO of the Si-O recombination process is
de-scribed as
where kSiO is the rate constant, and M is a third-body
molecule/atom. The angular parenthesis in Eq. (4) denotes the densities of the species. If the heat of reaction is emitted
as a photon, [M] is not included in Eq. (4).
Since the number ratio [Si]/[SiO] changes from 15 to 0.5,
the timescale of the reactionθSiO increases at least 30-fold
during the observation period between 20μs and 100μs.
During this same period, the number densities of the O atom and a third particle, if any, are also expected to decrease.
This decrease makes the timescaleθSiOeven longer.
At 20 μs after irradiation, the vapor is under a
non-equilibrium condition (Fig. 14) andθSiOis somewhat longer
thanθT. Between 20μs and 100μs,θSiOincreases at least
by a factor of 30, whereasθT increases by only sixfold. If
the activation energy of the Si-O reaction is high and,
conse-quently, thus the rate constantkSiOdepends on temperature
exponentially, the difference in the two timescales increases exponentially: in other words, the rate of the reaction would very rapidly become lower than the cooling rate of the va-por once the reaction departs from the equilibrium in the cooling vapor.
The experimental results, however, show that the recom-bination process proceeds even under a non-equilibrium condition, with the number ratio of Si to SiO changing from 15 to 0.5. This strongly suggests that the rate constant for the recombination process is not strongly temperature-dependent; i.e., the effective activation energy of the pro-cess is very low. This result is qualitatively consistent with
the ab initio calculation of Andreazzaet al.(1995).
In the system in which the temperature and pressure are decreasing simultaneously, the main cause for the quench-ing of a reaction is generally the decrease in temperature. However, for a reaction whose activation energy is approx-imately 0 kJ/mol such as the present Si-O recombination process, the rate coefficient depends only slightly on the temperature. Thus, a sudden decrease in the reaction rate at a certain temperature does not occur. This reaction does not involve quenching at a certain temperature. For such a re-action, decreases in the densities of reactants mainly cause the decrease in the reaction rate. Thus, we do not consider that the Si-O recombination reaction can be explained by a simple ‘freeze-out’ model in which a chemical reaction suddenly stops at a certain temperature.
5.
Concluding Remarks
We observed emission spectra of laser-induced quartz va-por to investigate how the rate constant of the Si-O recombi-nation process depends on temperature. We observed black-body radiation for the plume during the first few microsec-onds and then atomic lines of Si and molecular bands of
SiO in the subsequent 100μs. The ratio of intensities of Si
to SiO emission changed with time, indicating the recombi-nation of Si and O.
In order to determine the number ratio of Si to SiO, we measured the temperature and the degrees of self-absorption of Si and SiO as functions of time. We used a spectral inversion method to analyze the SiO band emission quantitatively. The result of this analysis shows that Si and O recombined as the vapor cooled from 5000 K to 3000 K.
The thermodynamic calculation of SiO2vapor was
con-ducted to compare the theoretical value with the empirical results. The comparison strongly suggests that Si and O re-combined even under a non-equilibrium condition. Taking the cooling rate of the vapor into consideration, we con-clude that the rate constant of the Si-O recombination re-action does not depend on temperature exponentially; its activation energy is approximately 0 kJ/mol in the region between 3000 K and 5000 K.
plume. However, a quenching process may not work in the
Si-O reaction. The oxygen dissociated from SiO2controls
the redox state of the compounds. Therefore, the chemical reaction between Si and O under a non-equilibrium condi-tion needs to be considered when we investigate the chemi-cal evolution of an impact-induced vapor plume on planets and moons.
Acknowledgments. The authors wish to thank N. Iwagami and
M. Nakamura for their fruitful discussions on the SiO spectrum, T. Kozasa and the late G. Igarashi and for information about kinetic parameters, and S. Ohno for experimental support. The authors also appreciate valuable comments by M. V. Gerasimov, S. Sasaki, and an anonymous reviewer. This research is partially supported by Grant in Aid from Japan Society for the Promotion of Science and Sumitomo Foundation.
Appendix A. Calculation of synthetic
spectro-grams of SiO band emission
In Section 3.3, the inversion analysis of SiO band emis-sion is conducted to estimate the temperature and column density of SiO. Sugita and Schultz (2003) describe the
pro-cedures to calculate synthetic spectrogram of the C2 band
emission. C2band emission and SiO band emissions are of
different types of the electronic transition system. The
sys-tem of C2 band emission analyzed by Sugita and Schultz
(2003) is that of the C2 Swan band system. It is a triplet
parallel transition system A3g → X3u. In contrast,
the SiO band emissions we observed are those of the SiO Main system which is a singlet non-parallel transition
sys-tem A1→ X1+. We describe here the procedures used
to calculate synthetic spectrogram of emission bands of the SiO Main system.
Although the SiO band spectrum consists of numerous individual rotational lines (e.g., Herzberg, 1950), it is ob-served as a continuous spectrum. The wavelength or wave number of each rotational line of a molecular band emission is calculated from the difference in two rotational energy
levels. The wave numberνof a rotational line is given by
ν=Te−Te+G(v)−G(v)+F(J)−F(J) (A.1)
where Te is the energy level of an electronic state at the
equilibrium position,Gis vibrational energy,Fis rotational
energy, ν vibrational quantum number, and J is the total
rotational quantum number. A single prime and a double prime denote the upper and the lower states of an electronic transition of molecules, respectively. Note that the energies
Te,G, and F are in the unit of wave number (cm−1). The
vibrational energyG(ν)is approximated as
G(v)=ωe
spin splitting does not exist for the SiO Main system. The effective line wavelength of a singlet transition in the SiO Main system is approximated as
F(J)=F(K)=BvK(K+1)−Dv
where K, Bv, and Dv are the rotational quantum number
and two rotational constants for the vibrational level of v,
respectively. The rotational constantsBv, andDvare given
by
equilibrium position. These constants, which are necessary
for the calculation are taken from Lagerqvistet al.(1973)
and Barrow and Stone (1975).
The spectral radiance E(λ) of spontaneous emission
from a rotational line is given by
E(λ)= 4π
whereis the resultant orbital angular momentum of the
electron along the internuclear axis,λcis the central
wave-length of a rotational line,ε0is the dielectric constant of the
vacuum,r¯vv is the characteristic inter-nuclear separation
for the(v, v)transition (γ-centroid),qvv is the
Franck-Condon factor, SJ
J is line strength factor, |Re(r¯vv)|is
the square of the electronic transition moment, φ is the
line broadening factor, and N is the number density of
SiO in the upper energy level of the transition. Liszt and
Smith (1972) calculated the Franck-Condon factorqvv of
SiO using RKR. Park et al.(1993) use the RKR
Franck-Condon factor and spectroscopic observation to determine
electronic transition moment|Re(r¯vv)|2 of the SiO Main
system. The line strength factorSJJdepends on the
rota-tional line branch. IfJ=J−1, a rotational line belongs
to the P branch; ifJ= J, it belongs to the Q branch, and
if J = J+1, it belongs to the R branch. The strength
factor for the P, Q, and R branches, respectively, are given by
The symbolKdenotes the rotational quantum number
with-out spin. For the SiO Main system,Kequals toJ.
The number densityNof SiO in the upper state is given
by a Boltzmann distribution if the thermal equilibrium is achieved
whereN0is the total number density of SiO in the all energy
factor (Arnoldet al., 1969). Electronic multiplicity is given by
d =δ (2S+1) (A.11)
whereδandSare the lambda doubling factor and quantum
number of resultant spin, respectively. For the upper
elec-tronic state of the SiO Main systemA1,δandSare 2 and
0, respectively.
The partition factorZof SiO is calculated with
Z(T)=
where vJmax is the cut-off vibrational quantum number
(Arnoldet al., 1969). The cut-off number satisfies either
exp
The rightmost summation of Eq. (A.12) is carried out over 15 electronic states compiled by Huber and Herzberg (1979).
The line broadening in Eq. (A.6) considers both Doppler
and collision broadenings. The details are described in
Appendix B.
A source spectrum obtained by integration ofE(λ)in Eq.
(A.6) is a spectrum emitted from an optically thin radiation source. In reality, however, the source is altered by the ef-fect of self-absorption because a radiation source has finite
optical thickness. The radiance I after self-absorption is
given by
whereBTandlare the blackbody radiation function at
tem-peratureT and the thickness of radiation source along the
line of sight, respectively (e.g., Arnoldet al., 1969).
Equa-tion (A.15) assumes that the radiaEqua-tion source is homoge-neous and in thermal equilibrium. Incident radiation from outside of the radiation source is also assumed to be negli-gible. Since radiation sources produced by laser-irradiation
are not expected to be homogeneous (Kadonoet al., 2002),
Eq. (A.15) does not apply in a strict sense. Nevertheless, it should provide a first-order estimate of the spectral charac-teristics of a radiation source.
The radianceI in Eq. (A.15) is often called a “true
trum”. The effect of finite spectral resolution of the spec-trometer needs to be introduced in order to convert a “true spectrum” into a “synthetic spectrum” that can be compared directly with an observed spectrum. A synthetic spectrum is given by a convolution of a true spectrum and the in-strumental function of a spectrograph (e.g., Seshadri and Jones, 1963). Since the spectral resolution our
spectrome-ter (FWHM ∼ 0.90 nm) is much larger than the width of
a typical atomic line, the line profile of an atomic emission line from a Mercury-argon lamp obtained by the spectrom-eter provides the instrumental function.
Appendix B. Line broadening of a rotational line
of the SiO Main system
In order to calculate a source spectrum of SiO, the line broadening of each rotational line has to be determined. The line broadening includes both Doppler and Lorentz
broadenings. The FWHM of Doppler broadening σD is
given by
molecular weight of SiO, respectively (e.g., Mitchell and
Zemansky, 1961). The FWHM of Lorentz BroadeningσL
is derived as
where ν is the frequency of emission light and γ is the
collision rate of atoms or molecules. The conversion of
ν to 22πγ is given by the principle of uncertainty. The
convolution of Doppler and Lorentz broadenings is given by Voigt function. We use the approximate formula for Voigt function derived by Whiting (1968).
φ(λ−λc)
A line widthσvis the Voigt line width and defined as
σv= σL
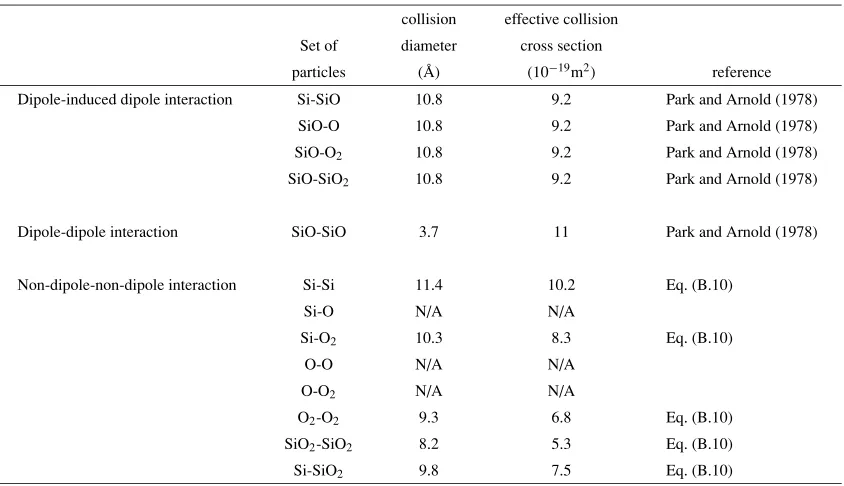
Table 1. Effective collision cross sections in the vapor plume. collision effective collision Set of diameter cross section
particles ( ˚A) (10−19m2) reference
Dipole-induced dipole interaction Si-SiO 10.8 9.2 Park and Arnold (1978)
SiO-O 10.8 9.2 Park and Arnold (1978)
SiO-O2 10.8 9.2 Park and Arnold (1978)
SiO-SiO2 10.8 9.2 Park and Arnold (1978)
Dipole-dipole interaction SiO-SiO 3.7 11 Park and Arnold (1978)
Non-dipole-non-dipole interaction Si-Si 11.4 10.2 Eq. (B.10)
Si-O N/A N/A
Si-O2 10.3 8.3 Eq. (B.10)
O-O N/A N/A
O-O2 N/A N/A
O2-O2 9.3 6.8 Eq. (B.10)
SiO2-SiO2 8.2 5.3 Eq. (B.10)
Si-SiO2 9.8 7.5 Eq. (B.10)
is within 0.27 nm. Thus the Voigt line width used as that of true spectrum of Si at 390.6 nm is estimated to be smaller than 0.27 nm:
σv <0.27 nm. (B.6)
Using Eqs. (B.1), (B.2), (B.5), and (B.6), the collision rate of Si is given as
γ < πλ2c c
(0.27 nm)2−
2λc c
2RTln 2
μ 2
(0.27 nm)
=3.5×1012×1.0−1.2×10⁻⁸T (Hz). (B.7)
Thus the upper limit of the collision rateγmax of Si is
de-scribed as
γmax Si=3.5×1012×
1.0−1.2×10⁻⁸T (Hz). (B.8)
We consider the cross sections of Si atoms and other atoms and molecules in the vapor plume to estimate the
lower limit of the collision rate. The collision rateγ in Eq.
(B.2) is described as
γ =v
i
NiQi (B.9)
wherevis the average velocity of Si atoms,Niis the
num-ber density of each chemical composition i in the vapor
plume, and Qi is the effective collisional cross section of
Si atoms and other atoms and molecules.
The cross sections of many atoms and molecules have been studied both by theory and experiment. The cross sec-tion of atoms (or molecules) depends slightly on the tem-perature (Park and Arnold, 1978). The collision diameter Dcollison of the non-dipole-non-dipole interaction is
calcu-lated by the summation of Van der Waals radii of collision
partners,rV DW 1andrV DW 2(Park and Arnold, 1978):
Dcollison=2(rV DW 1+rV DW 2) . (B.10)
Van der Waals radius of SiO2 is derived from Ahrens and
O’keefe (1972): those of Si and O2 are given by Kagaku
Binran (1984). The cross sections of the collision expected in the vapor we observed are listed in Table 1. The cross
section of Si and O2 is smaller than those of Si and other
atoms or molecules. Thus the summation of cross sections in Eq. (B.9) is the smallest when the vapor consists of only
Si and O2.
At a lower pressure, the collision rate between atoms and molecules is lower. The lower limit of the pressure is considered to be that of the ambient Ar atmosphere used in our experiment (i.e., 0.02 bar). We use this value to estimate the lower limit of the collision rate of Si.
We use the ideal equation of state for the vapor at the pressure of 0.02 bar and a temperature of over 2500 K. The
average velocity of Si,v, in Eq. (B.9) is given as
1
2μv
2=C
VT (B.11)
whereCV is molar heat capacity at a constant volume of
Si, 32R. The summation of the number densities of each
chemical composition is given as
i Ni =
P NA
RT (B.12)
whereNAis the Avogadro number.
Substituting Eqs. (B.11) and (B.12) to (B.9), the lower
limit of the collision rateγminis given as
γmin Si =QminPmin
) 3 μRTNA
=3.6×10⁹√1
T (Hz). (B.13)
larger than that of SiO. There are two reasons for this. The first is that Si atoms are lighter than SiO molecules and thus move at higher velocities: the atomic weight of Si is 28 and molecular weight of SiO is 44. Using the following equation by Penner (1959), we can estimate that the difference in collision frequency due to the difference in weight is a factor of 1.25:
γ ∝ √P
Tμ. (B.14)
Secondly, the cross section between Si and other atoms and molecules is equal to or greater than that of SiO (Ta-ble 1). When the vapor is dominated by atoms and non-polar molecules, the cross section of Si is almost the same as that of SiO. However, if the vapor is dominated by dipole molecules, the cross section of Si is 8.7-fold greater than that of SiO. We do not know the exact chemical composi-tion of the vapor; we only know that Si and SiO exists in
the same vapor. Consequently, the collision rateγSiOof SiO
needs to include a free parameterβ,
γSiO=βγSi. (B.15)
The value of the ratioβ ranges from 0.09 to 0.8. Using
Eqs. (B.8), (B.13), and (B.15), we obtain the upper limit γmax SiOand the lower limitγmin SiOof the collision rate of
SiO,
Substituting Eqs. (B.16) and (B.17) into (B.2), the upper
and lower limits of the Lorentz broadeningσL max SiOand
σL min SiO are estimated. For a rotational line of the SiO
Main system at 270 nm,
σL max SiO=2.7×10⁻¹⁰
Then the maximum and minimum Lorentz/Doppler
broad-ening ratiosαmax SiOandαmin SiOare
In Section 3.3, the Lorentz/Doppler broadening ratioαis
used as a free parameter to explain the methods and results of our analysis. Since the temperature of the vapor ranges
from 3000 K to 5200 K, the range ofαis about 0.0001 to
150.
The effect of the line broadening is calculated up to 10 Voigt widths away from the center of the line. In the
op-timum case, the error due to this truncation is 10−6for the
Voigt width equal to the Lorentz width. In the worst case, the error is 6.3% for the Voigt breadth equal to the Doppler breadth (Whiting, 1968). The Doppler widths of Si and SiO
are larger than 10−3nm for the wavelength range between
250 mm and 300 nm when the temperature is higher than 2000 K. Consequently, in our study, we used a wavelength
increment of 10−4nm and reconstructed the precise profile
of a spectral line.
References
Andreazza, C. M., P. D. Singh, and G. C. Sanzovo, The radiative associa-tion of C and S, C+and S, Si and O, and Si+and O,Astrophys. J.,451, 889–893, 1995.
Arnold, J. O., E. E. Whiting, and G. C. Lyle, Line by line calculation of spectra from diatomic molecules and atoms assuming a voigt line profile,J. Quant. Spectrosc. Radiat. Transfer,9, 775–798, 1969. Ahrens, T. J. and J. D. O’keefe, Shock melting and vaporization of lunar
rocks and minerals,Moon,4, 214–249, 1972.
Barrow, R. F. and T. J. Stone, The identification of a new band system associated with gaseous silicon monoxide,J. Phys.,B8, L13–L15, 1975. Basaltic Volcanism Study Project (BVSP),Basaltic Volcanism on the
Ter-restrial Planets, Pergamon, 1286 pp., New York, 1981.
Cannon, C. J.,The Transfer of Spectral Line Radiation, 541 pp., Cam-bridge Univ. Press, New York, 1985.
Chase, M. W., Jr., C. A. Davies, J. R. Downey, Jr., D. J. Frurip, R. A. Mc-Donald, and A. N. Syverud, JANAF Thermochemical Tables 3rd edi-tion,Journal of Physical and Chemical Reference Data, 14 Supplement No. 1, 1856 pp., 1985.
Divine, N., Five populations of interplanetary meteoroids,J. Geophys. Res.,98E9, 17029–17048, 1993.
Fegley, B., Jr., R. G. Prinn, H. Hartman, and G. H. Watkins, Chemical effects of large impacts on the earth’s primitive atmosphere,Nature, 319, 305–308, 1986.
Griem, H. R.,Plasma Spectroscopy, 580 pp., McGraw-Hill, New York, 1964.
Kadono, T., S. Sugita, N. K. Mitani, M. Fuyuki, S. Ohno, Y. Sekine, and T. Matsui, Vapor clouds generated by laser ablation and hypervelocity impact,Geophys. Res. Lett.,29(20), 1979–1982, 2002.
Kubicki, J. D. and E. M. Stolper, Evaporation kinetics of Mg2SiO4crystals and melts from molecular dynamics simulations,Lunar Planet. Sci. Conf. XXIV, no. 829, 1993.
Hamano, K., S. Sugita, T. Kadono, and T. Matsui, A new method to measure the pressure of impact-induced vapor clouds,Lunar Planet. Sci. Conf. XXXIV, no. 1647, 2003.
Herzberg, G.,Molecular Spectra and Molecular Structure, I, Diatomic Molecules, 2nd ed., 678 pp., D. Van Nostrand, New York, 1950. Huber, K. P. and G. Herzberg,Molecular Spectra and Molecular Structure
VI. Constants of Diatomic Molecules, 716 pp., Van Nostrand-Reinhold, New York, 1979.
Lagerqvist, A., I. Renhorn, and N. Elander, The spectrum of SiO in the vacuum ultraviolet Region,J. Molec. Spectrosc.,46, 285–315, 1973. Langhoff, S. R. and J. O. Arnold, Theoretical study of the X1+, A1, C1−,
and E1+states of the SiO molecule,J. Chem. Phys.,70(02), 853–863,
1979.
Liszt, H. S. and W. H. Smith, RKR Franck-Condon factors for blue and ultraviolet transitions of some molecules of astrophysical interest and some comments on the interstellar abundance of CH, CH+and SiH+,J. Quant. Spectrosc. Radiat. Transfer,12, 947–958, 1972.
Mitchell, A. C. G. and M. W. Zemansky,Resonance Radiation and Exited Atoms, 338 pp., Cambridge University Press, London, 1961.
Mukhin, L. M., M. V. Gerasimov, and E. N. Safonova, Origin of precur-sors of organic molecules during evaporation of meteorites and mafic terrestrial rocks,Nature,340, 46–48, 1989.
Park, C., High temperature reformation of aluminum and chlorine com-pounds behind the mach disk of a solid-fuel rocket exhaust,Atmos. En-viron.,10, 693–702, 1976.
Park, C. and J. O. Arnold, A shock-tube determination of the SiO(A1 -X1+) transition moment,J. Quant. Spectrosc. Radiat. Transfer,19,
1–10, 1978.
578 pp., Addison-Wesley, London, 1959.
Sasaki, S., K. Nakamura, Y. Hamabe, E. Kurahashi, and T. Hiroi, Produc-tion of iron nanoparticles by laser irradiaProduc-tion in a simulaProduc-tion of lunar-like space weathering,Nature,410, 555–557, 2001.
Seshadri, K. S. and R. S. Jones, The shapes and intensities of infrared absorption bands-A review,Spectrochim Acta,19, 1013–1085, 1963. Sugita, S. and P. H. Schultz, Interaction between impact-induced vapor
clouds and an atmosphere 1: Spectroscopic observation,J. Geophys. Res.,101E6, 2003.
Sugita, S., P. H. Schultz, and M. A. Adams, Spectroscopic measure-ments of vapor clouds due to oblique impacts,J. Geophys. Res.,103E8, 19,427–19,441, 1998.
Sugita, S., T. Kadono, S. Ohno, K. Hamano, and T. Matsui, Does laser
ablation vapor simulate impact vapor?,Lunar Planet. Sci. Conf. XXXIV, no. 1573, 2003.
The Chemical Society of Japan,Kagaku Binran Kisohen II Kaitei 3 ban, Maruzen, 1984.
Whiting, E. E., An empirical approximation to Voight profile,J. Quant. Spectrosc. Radiat. Transfer,8, 1379–1384, 1968.
Wiese, W. L. and G. A. Martin,Wavelength and Transition Probabilities for Atoms and Atomic Ions, Part II. Transition Probabilities, 359–406, National Bureau of Standards, Washington D.C., 1980.