International Journal of Emerging Technology and Advanced Engineering
Website: www.ijetae.com (ISSN 2250-2459, Volume 2, Issue 9, September 2012)409
Performance evaluation of On Demand MANET protocols for
different mobility models
Prajakta M. Dhamanskar
1, Dr. Nupur Giri
21 Lecturer, IT Dept. FR.CRCE., Bandra, Mumbai, India.
2Professor, Computer Engg. Dept.VESIT, HMCC, Mumbai, india.
Abstract—MANET (Mobile Ad hoc Network) is collection of independent mobile nodes that communicate with each other via radio waves. There is no infrastructure support for this network so each mobile node acts as a router to forward data packets to other mobile nodes. As the nodes are frequently moving the topology of the network changes dynamically. This paper presents the performance of on-demand routing protocols such as AODV, DSR and TORA for mobile nodes following four mobility models such as Random Waypoint (RWP), Random Walk (RW), Manhattan Grid and Reference Point Group mobility model (RPGM). The work describes their performance with respect to three performance metrics such as End-to-End delay, Packet Delivery ratio and Normalized Routing Load in simulation environment by increasing the number of nodes in the network in first scenario and by increasing the speed of mobile nodes and keeping the number of nodes constant in second scenario. The results help in the basic understanding of the protocols and the mobility models followed by the mobile nodes as well as in decision making while choosing routing protocol for appropriate traffic characteristics and QoS parameters. The simulations are carried out using ns2.
Keywords—AODV, DSR, TORA, RPGM, RWP, Manhattan Grid, RW.
I. INTRODUCTION
Until now much more research has been done in Mobile
Ad-hoc Networks (MANET) where networks are
self-organizing and self-configuring. The network topology changes frequently as the nodes in the network are mobile. Nodes in these networks utilize the same random access wireless channel. Each node in the network acts as host as well as router that route data to or from other nodes in network. In MANET there is no infrastructure support but in wireless networks there is base station and access point. If a source node transmits packets to destination node in MANET, then as the destination node might be out of range of a source node; it is always necessary to find a path between source and destination nodes to successfully forward the packets. So Ad-Hoc Routing protocols are used and are classified as On-demand (Reactive), Table-driven (Proactive) and Hybrid routing protocols.
AODV and DSR are Reactive protocols, DSDV and OLSR are proactive protocols and ZRP is hybrid protocol [7], [8].
Mobility models [7] are of two categories: entity mobility model and group mobility model. Entity mobility model describes individual node movement whereas Group mobility model describes group movement as well as individual node movement inside groups. Most of the group mobility models can be implemented by RPGM model. Random Waypoint and Manhattan Grid are characterized to be entity mobility model. Waal and Gerharz [11] developed BonnMotion[13] , a software package used to generate many standard mobility patterns. It is used for generating movement scenarios of Random Waypoint, RPGM, Manhattan Grid, and Gauss Markov mobility patterns.
Random Waypoint Mobility Model includes pauses
between changes in direction and/or speed. In Random
Walk Mobility Model a mobile node moves from its
current location to a new location by randomly choosing a speed and direction in which to travel from pre-defined ranges, respectively [min-speed, max-speed] and [0, 2*pi] respectively. The node travels in either a constant time
interval t or a constant traveled distance d, and repeats the
same procedure. Reference Point Group Mobility Model
represents the random motion of a group of mobile nodes as well as the random motion of each individual mobile node within the group. Group movements are based upon the path traveled by a logical center called as group leader
of the group. And Manhattan Grid Mobility Model is
similar to a city section with streets crossing each other perpendicularly. Therefore, nodes move only to top, down, left and right directions. [12].
International Journal of Emerging Technology and Advanced Engineering
Website: www.ijetae.com (ISSN 2250-2459, Volume 2, Issue 9, September 2012)410
In second scenario the number of nodes are constant i.e. 30 nodes and the speed of mobile nodes is varied from 1.5 m/s to 30 m/s. The rest of the simulation parameters are discussed in Table II.
II. REVIEW OF PREVIOUS WORK
The work in [2] evaluates the performance of AODV, DSR and TORA with identical loads and environment conditions with respect to two performance metrics such as average End-to-End delay and packet delivery ratio using only one mobility model i.e. Random Waypoint Mobility Model. The work in [4] describes the characteristics of ad hoc routing protocols such as AODV, OLSR, and TORA based on the performance metrics such as packet delivery ratio, end-to-end delay, routing overhead by increasing number of nodes in the network and it proves that AODV and TORA performs well in dense networks than OLSR in terms of packet delivery ratio. The work in [3] analyzes the behavior of MANET routing protocols such as AODV, DSR, DSDV, OLSR and DYMO under three mobility models such as RWP, RPGM, and CMM and concludes that, DSR uses source routing and route caches and does not depend on any periodic or timer-based activities. DSR exploits caching aggressively and maintains multiple routes per destination. AODV, on the other hand, uses routing tables, one route per destination, and destination sequence numbers, to determine freshness of routes. It concludes that for metrics such as delay and delivery rate, DSR outperforms AODV in less stressful situations and AODV outperforms DSR in more stressful situations. Work in [8] does the analysis on simulation results of three protocols, such as AODV, DSR and DSDV using ns2. As AODV is designed for up to thousands of nodes while DSR is designed up to two hundred nodes. AODV performed better in dense environment except packet loss. DSR and AODV both performed well. AODV and DSR are proved to be better than DSDV.
The novel approach in this paper evaluates performance of three routing protocols such as AODV, DSR and TORA for mobile nodes following four mobility models such as RWP, RW, RPGM and Manhattan Grid with respect to three parameters such as Packet Delivery Ratio, Normalized Routing Load and End-to-End Delay.
The work in [14] analyses the performance of AODV, DSR and DSDV for entity mobility models and group mobility models under parameters such as Packet Delivery Ratio, Routing Protocol Overhead and End to End Delay and concludes that AODV performs best with group mobility model, DSR has lowest routing overhead and DSDV performs best with entity mobility models.
III. SIMULATION MODEL
A. Parameters for Performance Analysis
Following parameters were evaluated for the performance of Ad-hoc on demand MANET routing protocols.
1. Packet Delivery Ratio (PDR) = ―Total packets received by constant bit sources (CBR) / Total number of packets sent by CBR sink at destination‖;
2. Average Delay = ―Sum [for each i equal to packet number, (time packet i received - time packet i sent)] / Total packets transmitted‖;
3.Normalized Routing Load (NRL)= “Total routing control packets / total received packets‖.
B. Network Scenario generation
BonnMotion, was used to generate nodes positions and their movement pattern, for the four mobility models mentioned as above. Two scenarios were simulated as shown in Tables I and II below.
C. Network Traffic generation
Network traffic can be generated by using a network traffic generating tool supported by ns2 which is in $NS2_HOME/indep-utils/cmu-scen-gen/cbrgen.tcl [8]. It is used to create Constant Bit Rate (CBR) traffic connections between wireless nodes. The number of nodes and maximum number of connections to be setup between them, a random seed and in case of CBR connections, a rate whose inverse value is used to compute the interval time between the CBR packets is as shown in the Table I below.
D. Simulation Parameters
International Journal of Emerging Technology and Advanced Engineering
Website: www.ijetae.com (ISSN 2250-2459, Volume 2, Issue 9, September 2012)411
In first scenario simulations were carried out for varying number of nodes and in second scenario for varying speed of mobile nodes.
TABLEI
SIMULATION PARAMETERS FOR SCENARIO 1
Parameter
Number of nodes
25 50 75 100
Simulation area 500 * 500 700 * 700 1000 * 1000 1200 * 1200
Simulation Time(s) 300 300 300 300
Speed (m/s) 30 30 30 30
Pause (s) 10 10 10 10
Traffic nodes 15 30 50 75
Groups 5 5 5 5
Nodes per group 5 10 15 20
Mobility Models RWP, RW, RPGM, Manhattan Grid
Rate 2.5 Mbps
Traffic Type CBR
Protocols AODV, DSR and TORA
TABLEII
SIMULATION PARAMETERS FOR SCENARIO II
Parameter AODV DSR TORA
Nodes 30 30 30
Pause 10 10 10
Simulation time 300 s 300 s 100 s
Rate Mbps 2.5 Mbps 2.5 Mbps 2.5
Traffic nodes 10 10 10
Speed 1.5, 5, 10, 15, 20, 25, 30
Mobility models RPGM, Manhattan Grid, RWP, RW
Traffic type CBR
Nodes per group in
RPGM 6
IV. SIMULATION RESULTS AND ANALYSIS FOR SCENARIO I
A. AODV
AODV protocol responds immediately using RREP messages to the changes in the network topology due to mobility of nodes and so the PDR of AODV is greater than that of DSR. From figure I, it is observed that as the number of nodes increases and goes beyond 50, the PDR decreases but among all the four mobility models PDR in Manhattan Grid is the worst because in Manhattan Grid model nodes move in forward and backward direction, right or left and directions are perpendicular to each other and the velocity of a node is restricted by the velocity of the preceding node on the same lane also when two mobile nodes diverge the probability of breaking the traffic signal increases. PDR is best in RPGM model because RPGM is the group mobility model and group leader determines the group motion behavior and each member of the group is uniformly distributed in the neighborhood of the group leader and each node deviates its speed and direction from that of the group leader.
FIGURE I PDRVS NODES IN AODV
International Journal of Emerging Technology and Advanced Engineering
Website: www.ijetae.com (ISSN 2250-2459, Volume 2, Issue 9, September 2012) [image:4.612.52.289.128.314.2]412 FIGURE II NRL VS NODES IN AODV
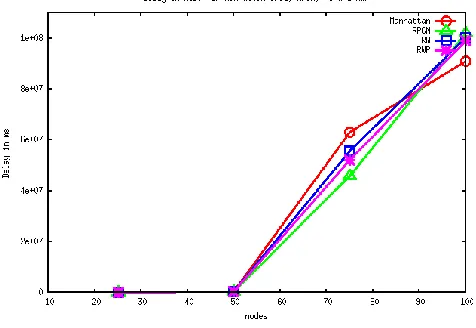
Average end-to-end delay in AODV increases as the number of nodes increases and goes beyond 50 due to congestion in the network, the time required in route discovery when the routes breaks occurs frequently due to changes in the network topology. From figure III, it is observed that up to 75 nodes, delay in Manhattan Grid model is the highest because the nodes can move only in four directions with predefined probabilities to change direction only at the intersection points. End-to-End Delay is least in RPGM model and it is observed that after 75 nodes delay is least in Manhattan Grid because in RPGM, the size of the group becomes larger, so the probability that the source and destination being in different groups increases and also the number of nodes and groups on the path increase, increasing the delay.
FIGURE III DELAY VS NODES IN AODV
B. DSR
From figure IV it is observed that the PDR decreases as the number of nodes in the network increases because with increasing nodes congestion in the network increases, also routing load increases and because of that delay also increases resulting in decreasing PDR. Performance of all the four mobility models for PDR is similar but it is best in RPGM as it is group mobility model but after 75 nodes as the nodes increases the group size also increases and again congestion in the group increases, resulting in worst PDR.
[image:4.612.326.561.316.500.2]Each DSR node keeps track of routes of which it is aware in its route cache so it refers to its cache whenever it requires route and performs the route discovery less frequently than AODV. Therefore NRL is less in DSR as compared to AODV.
FIGURE IV PDR VS NODES IN DSR
From figure V, it is observed that in DSR protocol the NRL increases as the number of nodes increases and goes beyond 50. Performance of all the four mobility models for NRL is similar but after 75 nodes as the number of nodes increases, NRL is highest in RPGM model because the group size increases and congestion also increases in the group. So in RPGM model routing overhead increases in DSR as in DSR every node carries routing information in its packet header, and as the size of the network increases the routing overhead increases.
[image:4.612.50.288.500.664.2]International Journal of Emerging Technology and Advanced Engineering
Website: www.ijetae.com (ISSN 2250-2459, Volume 2, Issue 9, September 2012)413
[image:5.612.48.289.221.591.2]From figure VI, it is observed that the performance of all the mobility models is similar but after 75 nodes, in RPGM model delay is least because RPGM is group mobility model and velocity of the group members deviates as that of the group leader but in Manhattan Grid model delay is highest because of the restriction on movement and velocity of nodes in Manhattan Grid model.
FIGURE V NRL VS NODES IN DSR
FIGURE VI DELAY VS NODES IN DSR
C. TORA
TORA protocol finds multiple paths from source to destination. So even if the network topology changes frequently due to mobility of nodes, TORA does not react at all. And therefore PDR in TORA is the best as compared to AODV and DSR.
TORA does not require periodic update of routing information. In TORA the control messages in network are reduced because nodes query for path only when it needs to send a packet to the destination.
[image:5.612.326.562.269.435.2]Therefore NRL in TORA is average and from figure VII it is observed that NRL remains constant for all the mobility models but in RWP model it is highest as the number of nodes increases beyond 75 because as the network size increases, overhead increases due to congestion and nodes are moving in any random direction and after reaching at the random destination pauses for some time and again start moving with random velocity. And in RPGM model it is least because RPGM is group mobility model and mobility of each group member is decided by the group leader.
FIGURE VII NRL VS NODES IN TORA
[image:5.612.325.559.557.708.2]In TORA when all the routes to destination are lost, new routes needs to be determined and in this case route construction may not occur quickly resulting in lengthy delays. From fig. VIII it is observed that as the number of nodes increases delay increases. The performance of all the mobility models is the same but up to 75 nodes delay in RW is highest and as the nodes goes beyond 75 delays in Manhattan Grid model is highest because of the restriction on node movement and velocity in congested network.
International Journal of Emerging Technology and Advanced Engineering
Website: www.ijetae.com (ISSN 2250-2459, Volume 2, Issue 9, September 2012)414
V. SIMULATION RESULTS AND ANALYSIS FOR SCENARIO II
[image:6.612.50.288.128.357.2]A. AODV
FIGURE IX NRL VS SPEED IN AODV
From fig. IX it is observed that in RPGM mobility model the NRL is minimum and it is not increasing even at increasing speed of mobile nodes, as it is group mobility model and the group members are uniformly distributed around the group leader. But in Manhattan Grid model at low speed the NRL is lower than RW model but at higher speed NRL is highest in Manhattan Grid model due to restriction on node movement.
[image:6.612.321.559.163.364.2]From fig X it is observed that in AODV protocol as the speed of mobile nodes increases the probability of frequent link breakages also increases and so that the delay also increases up to some max value and after that it decreases and again at high speed delay increases. But in RPGM model delay is lowest of all mobility models and in Manhattan Grid models it is highest.
FIGURE X DELAY VS SPEED IN AODV
B. DSR
[image:6.612.327.561.445.626.2]From fig XI it is observed that in DSR protocol also for RPGM model Delay is lowest and in Manhattan Grid model it is highest.
FIGURE XI DELAY VS SPEED IN DSR
From fig XII it is observed that in DSR protocol the performance of the entire four mobility models is same i.e. with increasing speed of mobile nodes the NRL slightly increases because at high speed the links breaks very frequently causing RERR messages which increases the overhead.
FIGURE XII NRL VS SPEED IN DSR
[image:6.612.48.287.541.710.2]International Journal of Emerging Technology and Advanced Engineering
Website: www.ijetae.com (ISSN 2250-2459, Volume 2, Issue 9, September 2012) [image:7.612.53.288.122.315.2]415 FIGURE XIII PDR IN AODV, DSR AND TORA
From fig XIV it is observed that NRL is highest in TORA protocol but it is lowest in DSR because each DSR node has route cache which it refers for finding alternative route in case of link breakages due mobility of nodes. So reduces the probability of route discovery causing reduced routing overhead.
FIGURE XIV NRL IN AODV, DSR AND TORA
VI. CONCLUSION
This work uses ns2 simulator and evaluates the performance of three widely used Ad hoc on demand routing protocols under different mobility models and parameters such as Packet Delivery Ratio, Normalized Routing Overhead and End-to-end delay.
From the simulation results the conclusion is that performance of RPGM mobility model is the best and performance of Manhattan Grid is the worst as compared to other mobility models for all the three protocols. PDR of AODV and TORA is greater than that of DSR but PDR of TORA is the best. NRL is the least in DSR and Delay is average in TORA.
VII. FUTURE WORK
In future performance of proactive MANET routing protocols could be evaluated and could be compared with the performance of reactive routing protocols under different parameters and different mobility models.
REFERENCES
[1] Santhamurthy T., A Comparative Study of Mutli-Hop Wireless Ad-Hoc network Routing Protocols in MANET. IJCSI International Journal of Computer Science Issues, Vol. 8 September 2011. [2] Gupta A. K., Sadawarti H., Verma A. K. , Performance analysis of
AODV, DSR & TORA Routing Protocols IACSIT International Journal of Engineering and Technology. Vol. 2, No.2, April 2010 [3] Tyagi S.S., Chauhan R.K., Performance Analysis of Proactive and
ReactiveRouting Protocols for Ad hoc Networks. 2010 International Journal of Computer Applications (0975 – 8887) Vol. 1 – No. 14 [4] Kuppusamy P., Thirunavukkarasu K., Kalavathi B., A study and
Comparison of OLSR, AODV, and TORA Routing Protocols in Ad Hoc Networks. 2011 IEEE.
[5] Maan F., Mazhar N.: MANET Routing Protocols Vs Mobility Models, A Performance Evaluation. 2011 IEEE.
[6] Bouhorma M., Bentaouit H., Boudhir A., Performance Comparison of Ad-hoc Routing Protocols AODV and DSR. 2009 IEEE Brown, L. D., Hua, H., and Gao, C. 2003. A widget framework for augmented interaction in SCAPE.
[7] Liu Tie-yuan,CHANG Liang,Gu Tian-long., Analyzing the Impact of Entity Mobility Models on the Performance of Routing Protocols in the MANET. 2009 Third International Conference on Genetic and Evolutionary Computing
[8] Pan Y., Design Routing Protocol Performance Comparison in NS2: AODV comparing to DSR as Example.
[9] Chen B. and Hwa Chang C., Impact on Energy Conservation of Ad Hoc Routing Protocols
[10] Shrestha A., Tekiner F., On MANET Routing Protocols for Mobility and Scalability
[11] Aschenbruck N., Ernst R., Gerhards-Padilla E., Schwamborn M., BonnMotion -Mobility Scenario Generation and Analysis Tool [12]
http://www-public.it-sudparis.eu/~gauthier/MobilityModel/mobilitymodel.html [13]
http://net.cs.uni-bonn.de/fileadmin/ag/martini/projekte/BonnMotion/src/BonnMotion _Docu.pdf
[image:7.612.51.290.382.564.2]