Characterization of Material Properties for Tunable
Reflectarray Antenna Design
M. Y.
Ismail,
M.
Hashim
Dahri and W.
N.
Zaihasra
Wireless a n d Radio Science Centre (WARAS),
Universiry Tun Hussein Onn Malaysia (UTHM), 86400 Parit Raja, Johor, Malaysia
Abstract. The emerging field of communications has increased the demand of electronically tunable reflectarray antennas. Substrate material properties play at1 important role in the design of reflectamy antennas. Variable permittivity
materials such as liquid crystals and fenoelectrics have received great deal of attention due to their non-linear material properties. A comparative analysis behveen the properties of liquid crystals and ferroelectrics for tunable reflectarray antenna design has been carried out by using Finite Integral Method (FIM). A thorough investigation based on reflectarray design analysis and tunable bias voltages of different non-linear materials is provided. It has been shown that due to higher dielectric permittivity values of non-linear materials, fenoelectrics require higher bias voltages for electronic tunability, as compared to liquid crystal materials. Barium skontium titanate (BST) with a dielectric permittivity ranging from 300 to 360 has been used as a fenoelectric substrate material to design a rectangular patch reflectarray which offers a frequency tunability of 3 GHz. The results show that ferroelectrics are only applicable for high
frequency reflectarray operation due to materials' higher permittivity values. Furthermore a rectangular patch reflectarmy antenna printed on 1 mm thick different liquid crystal materials has also been designed based on FIM. It has been shown that as the dielectric anisotropy of substrate material increases from 0.17 to 0.45, the frequency tunablity and dynamic phase range of reflectarray antenna also increase from 372 MHz to 795 MHz and 90' to 1 609, respectively.
Keywords: Reflectamys, Non-linear Materials, Dielectric Anisotropy, Dynamic Phase Range, Frequency Tunabiliw.
PACS: 84.40:~
INTRODUCTION
Mechanical movement of parabolic antenna especially in radar systems has increased the demand of an electronically tunable antenna [I]. Therefore a flat surface reflectamy antenna is gaining significant primary importance because of its lower cost and miniaturized size. Reflectmay antenna consists of printed reflecting elements on a grounded flat dielectric surface, illuminated by a primary feed horn
[Z].
The properties of dielectric substrate play an important role in the designing of reflectmay antenna [3]. Non-linear dielectric properties of substrate materials are mostly exploited in phase shifter designs for electronic tunability [4, 51. The same technique can be employed to design an electronically tunable reflectarray antenna. In this work, different types of non-linear dielectric materials namely ferroelectrics and Liquid Crystals (LC) are used to design X-band rectangular patch reflectarray antenna. Table 1 summarizes some of the non-linear dielectric materials which have been used in reflectarray antenna design. Moreover, measurements of a passive reflectarray rectangular element printed on a linear material (Rogers 5880) were carried out by waveguide simulator approach. Measured reflection loss and static phase range values are compared with simulated results in order to ensure the validity of simulations. Furthermore a comparative analysis based on required tunable bias voltage between ferroelectric and LC materials has been performed. The reflection loss performance is comparatively analyzed with frequency tunablilty and dynamic phase range of different non-linear dielectric materials based on FIM.TABLE 1. Different types of non-linear dielectric materials which have been used as reflectarray substrate
Non-Linear Type u E U Dielectric tans, tnnSli
Dielectric Anisotropy
Materials (AE=EJ
-EA
K15 Nematic LC 2.1 2.27 0.17 0.072 0.06
LC-BI LC 2.6 3.05 0.45 0.022 0.007
Barium
Strontium ferroelectric 300 360 60 0.05 0.06Titanate (BST)
2012 NmUo"a1 Physics Conf~rerce
AIP Conf Pmc. 1528,237-242 (2013); doi: 10.106311.4803601 02013 AIP PublislungLLC97&0J354-1153-IiS3OW
237
NON-LINEAR DIELECTRIC MATERIAL PROPERTIES
The materials that are being directionally dependent are non-linearlanisotropic materials in which the variation in values of a property may occur in any direction [ 6 ] . A non-linear dielectric material is such that, dielectric
permittivity E, vaties in one direction of medium [6] whereas a dielectric linearlisotropic material has a fixed
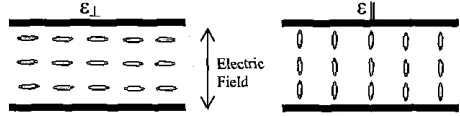
dielectric permittivity value. It is possible to tune the dielectric permittivity of anisotropic materials simply by applying a bias voltage across the substrate, which allows the molecules of anisotropic material to be oriented parallel to the incident field which results in an increase in the dielectric permittivity [7] as shown in Figure I. The tunability capability in dielectric permittivity is required in order to realize dynamic phase distribution of reflectarrays. The difference behveen maximum and minimum value of dielectric permittivity is called dielectric anisotropy of material as given in Equation 1.
A&
= E,,-
cl
(1)where, AE = Dielectric anisotropy, EN = Dielectric constant with applied DC voltage, EL = Dielectric constant without DC voltage
EL E
11
- - - - a
- - - a
-I
O
O
b
O
O
E'ect"c
0 0
0
0
0
-
,
,
,
,
Field0
0
0
0
0
FIGURE 1. Al~gnmeut of molecules of dlelectrlc anlsotroplc matenal w~thout and w~th external b ~ a s voltage
According to the dielectric and physical properties which have been used in reflectarray antenna design, the non. linear dielecttic materials can be categorized into two types.
Perroeleetrics
Ferroelectric materials posses a molecular property called ferroelectricity. Ferroelechicity is an electrical phenomenon whereby certain materials may exhibit a spontaneous dipole moment, the direction of which can be switched between equivalent states by the application of an external electric field. The internal electric dipoles of a Fenoelectric material are physically tied to the material lattice. Consequently, a change in the physical lattice results in change in the strength of the dipoles causing currents to flow into or out as a capacitor 181. In the presence of an
[image:2.611.203.433.267.325.2]external bias voltage across the material, ferroelectrics attain variable dielectric permittivity values [4]. As shown in Table 1, ferroelectrics usually have very high dielectric constant values as compared to LC which is usually the main reason behind the limited use in reflectarrays.
( 4 S°C) (15°C to 35°C) (>35"C)
Crystalline
d
Nematic Isotropic(Liquid Crystalline)
Temperature Increases
>
FIGURE 2. Effect of temperatme on three physical states of K-15 Nematic liquid crystal
Liquid Crystals
The LC materials have two melting points in which after the first melting point they convert from solid crystal state to liquid crystal state and after second melting point they convert to pure liquid state. This shows that the Liquid crystal state is the intermediate state between liquids and solids [6, 91. It has been shown in Table 1 that the perpendicular components of dielectric constant have higher dissipation factor values as compared to the parallel components for all LC materials. The three states of liquid ctystal materials are temperature dependent [7] as shown in Figure 2. For K-15 Nematic, it can be observed from Figure 2 that below 15'C, it posses a solid crystalline state,
[image:2.611.207.413.512.572.2]between lS°C and 3S°C it is a pure liquid crystal having anisotropic properties whereas above 35°C it converts into liquid state which have Linear/isotropic dielechic properties.
Comparison of Tunable Bias Voltage between Ferroelectrics and Liquid Crystals
The performance of both types of non-linear dielectric materials can easily be compared by the variation in the tunable bias voltage, required for electronic tunability in reflectarrays. Table 2 depicts some of the ferroelectric and LC materials with bias voltages. The anisohopic LC materials require a bias voltage from OV to 20V as compared to ferroelectrics which require a higher voltage variation from OV to 350V (Table 2). This is because the LC materials have very low dielectric constant values as compared to ferroelectric materials resulting in requirement of lower voltages [lo].
TABLE 2. Comparison of bias voltage behveen Liquid Crystals and ferroelectric materials
Non-Linear Type Maximum Dielectric Bias Voltage Range (V)
Dielectric Materials Permittivity
K15 Nematic LC 2.27 0-20
LC-B 1 LC 3.05 0-20
Barium Shontium ferroelectric 360 0-40
Titanate (BST)
Strontium Titanate ferroelechic 320 0-350
RESULTS BASED ON LINEAR DIELECTRIC MATERIAL
In order to investigate the scattering properties of passive reflectarray unit cells, reflectarray rectangular element operating at 10 GHz has been fabricated using 0.787 mm thick Rogers 5880 as a linear subshate material. Rogers 5880 has a dielectric permittivity of 2.2 with a dissipation factor of 0.0009. The waveguide simulator approach [ l l ] has been used to perform the scattering parameter measurements of fabricated two patchunit cell element by Vector Network Analyzer (VNA) at X-band frequency range. This work has been used as a baseline stage for active reflectarray elements design.
Reflection Loss and Static Phase Range
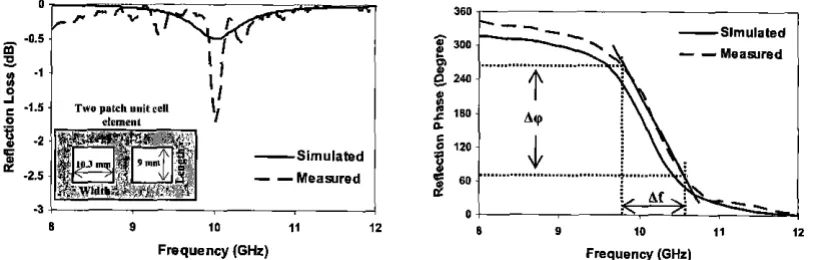
The linear materials have fixed dielectric properties therefore they offer a single reflection loss and reflection phase curve at a particular resonant frequency. Figure 3(a) shows the measured and simulated reflection loss curves of a two patch reflectarray rectangular element printed above Rogers 5880 substrate.
8 9 10 I 1 12
Frequency (GHz)
9 10 11 12
[image:3.606.102.509.499.629.2]Frequency (GHz)
FIGURE 3. (a) Reflection loss performance of linear material with design configuration of two patch unit cell element
(b) Reflection phase performance of a linear material
in the measured and simulated results. Furthermore the surface roughness in fabrication process and substrate material tolerance also causes variation in the measured results. In order to analyze static phase range performance of passive reflectmay element, a Figure of Merit (FoM) has been defined as the ratio of the change in reflection phase to the change in the frequency and can be expressed as;
A 9
FoM
= - ( " / M H z )
Af
TABLE 3. Measured and simulated reflection loss and reflection phase performance of linear material
Rogers 5880 Simulated Measured
Reflection Loss (dB) 0.5 1.6
Static Phase ~ a n g e
t)
190 200FoM ('/MHz) 0.27 0.3 1
The measured and simulated reflection phase curves of passive reflectarray element based on Rogers 5880 substrate are shown in Figure 3(b). As shown in Figure 3(b), it has been observed that rectangular element is observed to offer a measured and simulated static phase ranges of 190' and 200' respectively. The comparison between simulated and measured results for linear material is shown in Table 3 where static phase range and FoM values are summarized. A good agreement has been found between simulated and measured results. Table 3 shows that the measured reflection phase has a FoM value of 0.31°1MHz as compared to simulated phase which has 0.27°/MHz. This minor discrepancy is due to the high loss performance of measured results which increases the slope of reflection phase and overall phase range.
RESULTS BASED ON NON-LINEAR FERROELECTRIC MATERIAL
The properties of a ferroelectric material named barium strontium titanate @ST) have been used to design a rectangular patch reflectmay in CST computer model. According to Balanis [12], substrates with dielectric constant in between 2.2 and 12 are suitable for reflectmay antenna design. As described in Table 1, BST has dielectric constant values ranging from 300 to 360 therefore rectangular patch reflectarray unit cell bas very small dimensions of 0.41 mm by 0.17 mm with a substrate thickness of 0.1 mm. A higher value of dielectric constant leads to the smaller dimensions of patch element which are comparable with the lower wavelengths of incident signal. As a result smaller patch element reflects higher frequency signals therefore this antenna has a resonant frequency of 33.5 GHz.
Reflection Loss and Frequency Tunability
Figure 4(a) shows the reflection loss curves and frequency tunability of reflectmay antenna printed on BST substrate material. It has been shown from Figure 4(a) that reflectarray antenna offers a reflection loss of 1.45 dB and 1.21 dB for petpeudicular and parallel component of dielectric permittivity respectively.
0
c = 3 6 0
- - -
-
I - -
140
\
-1.1
Af
-1.6 I 3 0
31 32 33 34 35 36 31 32 33 34 35 36
[image:4.606.111.506.158.221.2]Frequency (GHz) Frequency (GHz)
FIGURE 4. (a) Reflection loss and frequency tunablity (b) Distorted reflection phase curves of rectangular patch reflectmy
unit cell based on BST substrate
Another important parameter to analyze the performance of non-linear dielectric materials is frequency tunability. With a dielectric anisotropy of 60, BST is shown to give a wider frequency tunability of 3 GHz. A bias
[image:4.606.79.528.523.654.2]voltage across a ferroelectric substrate can provide a very good frequency tunability performance for reflectarray antenna hut higher values of dielectric permittivity is the main performance Limitation for ferroelectric materials.
Reflection Phase Performance
As depicted in Figure 4(h) it has been observed that BST has a distorted phase response. Smaller dimensions of patch element affect the surface current distributions on the surface of the patch. Indistinct surface currents lead to have miss-behaved reflections fiom reflectmay antenna which causes a distorted phase curve in response [13].
Furthermore, due to thinner substrate used in this work the ground plane and patch element is comparatively severe. Thin suhstrate affects the electric field distrihution and hence weaker electrostatic fields are generated within the suhstrate region, which causes higher dielectric absorption and consequently a distorted phase of reflectmay antenna.
RESULTS BASED ON NON-LINEAR LC MATERIALS
Reflection Loss Performance
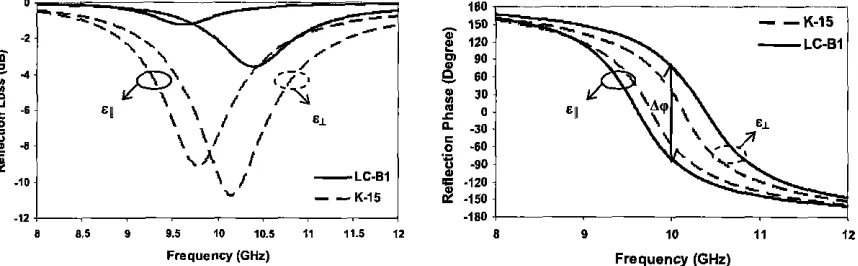
The reflectivity performance of reflectarray rectangular patch element based on selected LC materials named LC-BI and K-15 Nematic is shown in Figure 5(a). As depicted in Figure 5(a), it has been observed that perpendicular component of dielectric permittivity offers higher reflection loss performance as compared to parallel component. It is because of the reason that, the perpendicular component has a higher dissipation factor as compared to the parallel, as described earlier in Table 1. Tahle 4 contains the maximum and minimum reflection loss values of both anisotropic LC materials that are used to design reflectarray antenna. It has been observed from Tahle 4 that, K- 15 Nematic offers the highest reflection loss performance of 10.74 dB as compared to LC-Bl which attains 3.54 dB. The reason behind that is, K-15 Nematic has a maximum dissipation factor or tangent loss value of 0.072 whereas LC-Bl has 0.022 which leads to have lower reflection losses.
\ / I
.-
oC -so\ A
5
-90 -LC-61-
-K-15.I2 -180
8 8 5 P 9.5 10 105 11 '115 12 8 9 10 11 12
[image:5.605.97.526.396.529.2]Frequency (GHz) Frequency (GHz)
FIGURE 5. (a) Reflection loss performance of non-linear LC materials @)Reflection phase performance of non-linear LC
materials
Dynamic Phase Range and Frequency Tunability
Non-linear LC materials attain a range of dielectric permittivity values from minimum
(€3
to maximum (61).Therefore when a non-linear LC material is used as a reflectarray suhstrate a phase agile characteristic occurs which is known as dynamic phase distribution. The maximum phase variations of the reflected signal occur at resonant frequency. Dynamic phase range can be defined as.
AU,
=P(&//)
-
U,(&I) (3)The dynamic phase range of LC materials is a measure of dielectric anisotropy. Figure 5(h) shows the dynamic phase ranges for reflectarray antenna printed on LC-B1 and K-15 Nematic LC material. As shown in Figure 5(b), it
TABLE 4. Reflection loss, dynamic phase range and frequency tunability performance of anisotropic LC materials
Non-Linear Dielectric Reflection Loss (dB) Dynamic Phase Frequency Tunability
LC Materials Anisotropy at Range Ag (')
at Ell Af (MHz)
K15 Nematic 2.27 10.74 9.10 90 372
LC-BI 3.05 3.54 1.22 160 795
Table 4 also contains the values of dynamic phase ranges for reflectmay antenna printed on 1 mm thick dielecttic anisotropic materials. It has been observed from Table 4 that, as the dielectric anisotropy increases from 0.17 to 0.45 the dynamic phase range also increases from 90" to 160'. This shows a relationship between dielectric anisotropy and dynamic phase range of non-linear LC materials.
A change in the dielectric permittivity of dielecttic anisotropic materials can also cause a significant change in resonant frequency that is known as frequency tunability. Table 4 summarizes the frequency tunability values for rectangular reflectmay element printed above different anisotropic LC materials. It has been shown from Table 4 that, as the dielectric anisotropy increases from 0.17 to 0.45, the frequency tunability also increases from 372-795 MHz. Frequency tunability response of reflectanay antenna corresponds to the flexibility in the value of dielectric anisotropy of anisotropic materials.
CONCLUSION
A detailed analysis based on rectangular patch reflectarray antenna printed on different linear and non-linear materials is presented in this work. The results obtained 6om this work demonstrate that different types of nou-linear materials such as ferroelectrics and LC can enhance the performance of reflectmay antenna in terms of wider phase ranges and higher frequency tunability. It has been observed that due to higher dielectric permittivity ferroelectrics require higher bias voltages as compared to LC materials. Furthermore it is observed that BST has a distorted phase response because of thinner substrate and reduced dimensions of the patch element. A non-linear LC material iffem rapid dynamic phase change behavior for designing an electronicallv tunable reflectarrav antenna.
-
-
A raoid dwamic phase range wiih a high frequency tunability perfonnance of differedt non-linear dielecgc materials dis&sedinthis
work is required particularly for beam steering applications in radar and satellite communication system.ACKNOWLEDGMENTS
This project is funded by the Best Fundamental Research Grant Scheme (FRGS VOT 0983), awarded by
Minishy of Higher Education of Malaysia. We would like to thank the staff of Wireless and Radio Science Center (WARAS) of University Tun Hussein Onn Malaysia (UTHM) for the technical support.
REFERENCES
1. M. I. Skolnik, Radar Handbook, 3" edition, New York: Mc Craw Hill publications, 2008, pp. 1.1-1.23. 2. J. Huang and 1. Encinar, Reflect Array Antenna, Hoboken New Jersey: John Wiley & Sons, Inc., 2007, pp. 1-6. 3. M. Y. Ismail, M. Inam and A. M. A. Zaidi, American .IofEngineeringandappliedSciences 3 (I), 180-185 (2010).
4. G. Vdlu, K. Blary and L. Burgnies, IEEE Transactions on Microwave Theory and Techniques 55
(Z),
438-444 (2007). 5. A. Moessinger, C. Fritzsch, S. Bildik and R. Jakoby, IEEE International Microwove Symposium Digest (MTT-S), 1020.1023(2010).
6. S. M. Kelly and M. O'Neill, "Liquid Crystals for Electro-Optic Applications" in Handbook of Advanced Electronic and Phatonic Materials and Devices, edited by H.S. Nalwa, California: Academic Press, 2000, pp. 1-66.
7. M. Y. Ismail and R. Cahill, "Beam Steering Reflectarrays Using Liquid Crystal Substrate" in Tenth IEEE High Frequency Postgraduate Srudent Colloquium, Conference Proceedings, University of Leeds, England, 2005, pp. 62-65.
8. T. R. Shout and S. L. Swartz, "Processing of Fenoelectric and Related Materials; a review" in Eighth IEEE Inlernalionol Symposium on Applications ofFerroelechics, ISAF Conference Proceedings 92, Greenville, USA, 1992, pp.80 - 88. 9. 0 . Tmshkevych, F. Golden, M. Pivnenko and H. Xu, Electronic Lelters 46 (10). 693-695 (2010).
10. H. L. W Chan, "Smart Ferroelectric Materials for Sensors and Mechatronic Device Aoolications" in
.
.
IEEE ConferencePublrrrrrir.ns. Prosccdingr of II CE Clc:tron Dc81cej Mcetlng, Hong Kong. 1999. pp.68 - 71
I I . .M. lnatn and .\I. Y. I,ms:l. Aficrotvgr,r ondOprr,:ul T c ~ r ~ k ~ o l o ~ ~ ~ L ~ r ~ r . r s rAfOTI.,
.
53 11)....
77-80 1201 I I\ ,
12. C. A. Balanis, Antenna Theory Analysis and besign, 2nd ~ d z o n , New ~ o r k : John Wiley & Sons, Inc., 2005, pp. 722-784. 13. H. Rajagopalan and Y. Rahmat-Samii, IEEE Antennas ondPropagalion Magazine 52 (4), 73-79 (2010).
242