© 2016, IRJET | Impact Factor value: 4.45 | ISO 9001:2008 Certified Journal
| Page 1991
EFFECT OF SHEAR WALL POSITION IN MULTI-STORIED BUILDING
D Vivek varam
1, CH vinodh Kumar
2, K V Vijaya kumarraju
3D Vivek Varma,Dept. of civil Engineering, GOKUL College of Engineering,Piridi-535005,Andhra Pradesh, India
CH Vinod Kumar,Dept. of civil Engineering, GOKUL College of Engineering,Piridi-535005, Andhra Pradesh, India
K V Vijaya kumarraju,Dept. of civil Engineering, MVGR College of Engineering (A), Vizianagaram-535005,
Andhra Pradesh, India
---***---
Abstract -
Earthquake is the natural calamity, it produce strong ground motions which affect the structure. Small or weak motions, that can or cannot be felt by the humans. Shear walls are installed to enhance the lateral stiffness, ductility, minimum lateral displacements and safety of the structure. Storey drift and lateral displacements are the critical issues in seismic design of buildings. Different types of frame models are developed and evaluated by Time history analysis and response spectrum analysis by STAAD-Pro. Shear walls are RC walls that are projected along the structure from base. Shear walls reduce the Storey displacement when seismic forces counter the building. Since, the structure may not have aesthetic appearance if the structure is closed with shear wall along the building so shear wall is proved in side of the building. For low rise buildings, bracings may not be suitable.In the present work G + 10 multi Storey building is analyzed by using shear wall at different positions. The structure is analyzed and results for different models of structure are evaluated.
Keywords:Shear wall, Time history, Response spectrum, Displacement, Reactions and moment
1. INTRODUCTION
Now-a-days Earthquakes are the most unpredictable and common natural disasters which occurs frequently in some parts of the world (zones). An abrupt released of energy in Earth’s crust which forms seismic waves and results in EARTHQUAKE also known as tremor. Which are very difficult to save life, Engineering and other properties. The seismic waves travel outward from the source of the earthquake at varying speeds and are measured by two important parameters those are magnitude and intensity. Intensity is the apparent effect experienced at that location and amount of energy released is measure of magnitude.
Structures on earth, Experiences this effect and causes damage, to resist the lateral forces (seismic waves) structure should adopt stiffness and lateral strength to the buildings. Hence in order to overcome these issues we
need to identify the seismic act of the built environment through the development of various methodical procedures, which ensure the structures to withstand during frequent minor earthquakes and produce enough risk avoidance whenever subjected to major earthquake events. So that can save as many lives as possible by adopting Shear walls and bracings to the structure can resist the lateral forces. All over the world, there are several guidelines which has been over and over again updating on this topic.
In case of earthquake prone areas RC shear walls have been used to resist the lateral forces because they have high lateral stiffness. RC shear walls resist earthquake forces with minor damage. When compare to irregular structures, the buildings with uniform load distribution, stiffness and regular geometry in plan and elevation suffer less damage.
2
.
STRUCTURAL AND GEOMETRICALPROPERTIES
2.1 Preliminary data for G + 10 plane frame
1. Type of structure : Multistorey rigid jointed planeframe 2. Zone : II
3. Number of stories: G + 10
4. Imposed load : 2 kN/m2 at roof and 4 kN/m2 at floors
5. Terrace water proofing (TWF) : 1.5 kN/m2
6. Floor finish : 0.5 kN/m2
7. Depth of slab : 120 mm
8. Materials : M 30 concrete and Fe 415 steel 9. Unit weight of RRC : 25 kN/m3
10. Unit weight of masonry : 20 kN/m3
11. Modulus of elasticity of concrete : 2 x 10⁷ kN/m2
12. Bay width of plane frame (in both x and z): 3 m 13. Total height of building frame : 33 m 14. Height of storey : 3m 15. Depth of foundation : 2 m
16. Beams : 300 x 300 mm
© 2016, IRJET | Impact Factor value: 4.45 | ISO 9001:2008 Certified Journal
| Page 1992
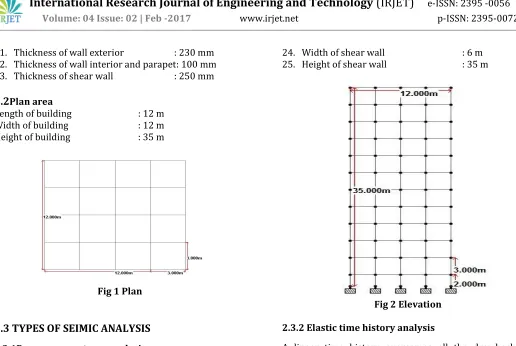
21. Thickness of wall exterior : 230 mm 22. Thickness of wall interior and parapet: 100 mm 23. Thickness of shear wall : 250 mm
24. Width of shear wall : 6 m 25. Height of shear wall : 35 m
2.2
Plan area [image:2.612.42.558.53.399.2]Length of building : 12 m Width of building : 12 m Height of building : 35 m
[image:2.612.70.243.157.347.2]Fig 1 Plan
Fig 2 Elevation
2.3 TYPES OF SEIMIC ANALYSIS
2.3.1Response spectrum analysis
This method is applicable for those structures where other than the fundamental one affect significantly the response of the structure. The response of the structure can be defined as the combination of modes. The modes of structure can be analyzed by any software. A response of mode can be analyzed from design spectrum, based on modal mass and modal frequency. Magnitude of forces in all directions is calculated based upon the different combinations as follows:
Absolute – peak values
Square root of sum of the squares (SRSS)
Complete quadratic combination (CQC) – for closely spaced modes,
a method improved on Square root of sum of the squares In this case structures are too tall, too irregular or of significance to a community in disaster management, and more complex analysis are required, such as non-linear static or dynamic analysis.
2.3.2 Elastic time history analysis
A linear time history overcomes all the drawbacks of modal response spectrum analysis, provided non-linear behavior is not involved. It requires greater computational efforts for calculating the response at discrete intervals. One interesting advantage of such procedure is that the relative signs of response quantities are preserved in the response histories. This is important when interaction effects are considered in design among stress resultants.
2.4 SHEAR WALL
© 2016, IRJET | Impact Factor value: 4.45 | ISO 9001:2008 Certified Journal
| Page 1993
reduced by these shear wall. These are designed to resist both self-weight of the structure (gravity loads) and lateral forces.
Natural calamities (Earthquakes, wind forces) force causes several kinds of stresses such as shear, tension, and torsion etc., the structure may experience Storey displacement or may collapse suddenly. Shear wall reduces the severity of lateral displacement of the structure and indicate the failure of the structure.
2.5 BUILDING MODALS
Different locations or positions of shear wall was placed for the structure as follows
Sl.
No Frame Description
1 Normal RC frame structure without shear wall
2 SW at 12 m T RC frame structure with shear wall at 12 m Top in YZ plane
3 SW at 9 m T RC frame structure with shear wall at 9 m Top in YZ plane
4 SW at 6 m T RC frame structure with shear wall at 6 m Top in YZ plane
5 SW at 12 m C RC frame structure with shear wall at 12 m Centre in YZ plane
6 SW at 9 m C RC frame structure with shear wall at 9 m Centre in YZ plane
7 SW at 6 m C RC frame structure with shear wall at 6 m Centre in YZ plane
8 SW at 12 m B RC frame structure with shear wall at 12 m bottom in YZ plane
9 SW at 9 m B RC frame structure with shear wall at 9 m bottom in YZ plane
10 SW at 6 m B RC frame structure with shear wall at 6 m bottom in YZ plane
1) Normal 2) Sw at 12 m T
3) SW at 9 m T 4) SW at 6 m T
5) SW at 12 m C 6) SW at 9 m C
7) SW at 6m C 8) SW at 12 m B
9) SW at 9 m 10) SW at 6 m B
© 2016, IRJET | Impact Factor value: 4.45 | ISO 9001:2008 Certified Journal
| Page 1994
3 RESULTS AND DISCUSSION
3.1 TIME HISTROY ANALYSIS
3.1.1 Nodal displacements
Fig 4Horizontal nodal Displacement along (+) X
Fig 5Horizontal nodal Displacement along (-) X
Fig 6Horizontal nodal Displacement along (+) Z
Fig 7Horizontal nodal Displacement along (-) Z
In the nodal displacement, out of these modals shear wall at 6 m Centre gave lower displacement when compared to other models in both positive and negative X and Z directions.
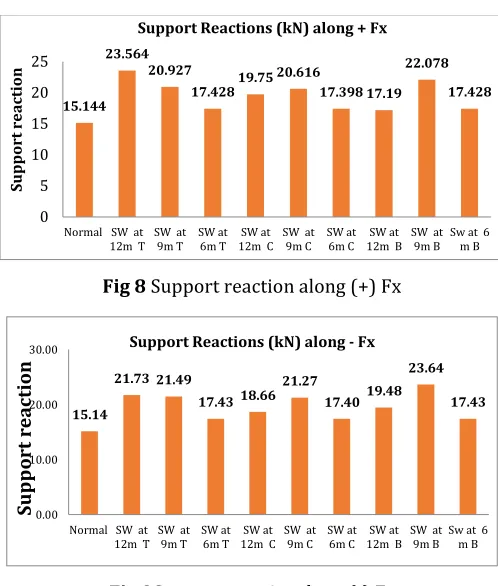
3.1.2 Support reaction
Fig 8 Support reaction along (+) Fx
Fig 9Support reactionalong (-) Fx
In the Support reaction, out of these modals shear wall at 6 m Centre gave lower Support reaction when compared to other models in both positive and negative X and Z directions.
3.1.3 Bending moments
Fig 10 Bending moment along (+) Mx
23.367 29.33
27.113
20.483 24.159
27.779
19.745 22.976
25.33 20.483 0 10 20 30 40
Normal SW at
12m T SW at9m T SW at6m T 12m CSW at SW at9m C SW at6m C 12m BSW at SW at9m B Sw at 6m B
Di
sp
la
cem
ent
Horizontal Node Displacement (mm) along (+) X
23.367 36.826 29.235 20.483 33.233 29.392 19.745 32.176 26.271 20.483 0 10 20 30 40
Normal SW at
12m T SW at9m T SW at6m T 12m CSW at SW at9m C SW at6m C 12m BSW at SW at9m B Sw at 6m B
Di
sp
la
cem
ent
Horizontal Node Displacement (mm) along (-) X
19.091 30.25
27.033
21.102 24.902 17.643
13.018 19.21
14.048 17.291
0 10 20 30 40
Normal SW at
12m T SW at9m T SW at6m T 12m CSW at SW at9m C SW at6m C 12m BSW at SW at9m B Sw at 6m B
Di
sp
la
cem
ent
Horizontal Node Displacement (mm) along (+) Z
19.091 26.261 24.259 17.291 24.899 17.641 13.018 23.196
18.437 21.102
0 10 20 30
Normal SW at
12m T SW at9m T SW at6m T 12m CSW at SW at9m C SW at6m C 12m BSW at SW at9m B Sw at 6m B
Di
sp
la
cem
ent
Horizontal Node Displacement (mm) along (-) Z
15.144 23.564
20.927
17.428 19.75 20.616 17.398 17.19
22.078 17.428 0 5 10 15 20 25
Normal SW at
12m T SW at9m T SW at6m T 12m CSW at SW at9m C SW at6m C 12m BSW at SW at9m B Sw at 6m B
Support
re
ac
tion
Support Reactions (kN) along + Fx
15.14
21.73 21.49
17.43 18.66 21.27
17.40 19.48
23.64 17.43 0.00 10.00 20.00 30.00
Normal SW at
12m TSW at9m T SW at6m T 12m CSW at SW at9m C SW at6m C 12m BSW at SW at9m B Sw at 6m B
Su p p or t rea cti on
Support Reactions (kN) along - Fx
14.058 21.403 18.744 10.716 19.283 13.882 6.906 16.108 14.25 14.475 0 5 10 15 20 25
Normal SW at
12m T SW at9m T SW at6m T 12m CSW at SW at9m C SW at6m C 12m BSW at SW at9m B Sw at 6m B
M
om
ent
[image:4.612.36.566.140.731.2] [image:4.612.324.573.171.464.2]© 2016, IRJET | Impact Factor value: 4.45 | ISO 9001:2008 Certified Journal
| Page 1995
Fig2Bending moment along (-) Mx
In the Moment, out of these modals shear wall at 6 m Centre gave lower moment when compared to other models in both positive and negative X and Z directions.
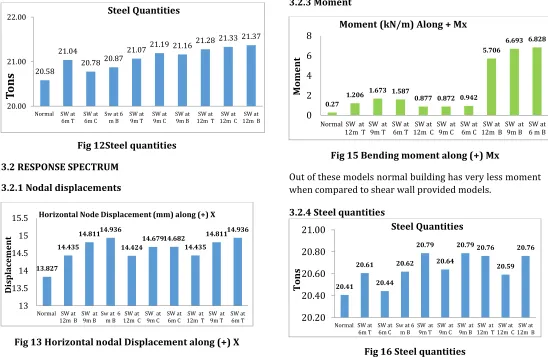
3.1.4 Steel quantities
[image:5.612.40.303.83.237.2]The quantities of steel are in tons. Here we can see the quantities of steel for different models in Figure 12.
Fig 12Steel quantities
3.2 RESPONSE SPECTRUM
3.2.1 Nodal displacements
Fig 13 Horizontal nodal Displacement along (+) X
Out of these models normal building has very less nodal displacements when compared to shear wall provided models.
3.2.2 Support reaction
Fig 143 Support reaction along (+) Fx
Out of these models normal building has very less support reaction when compared to shear wall provided models.
[image:5.612.322.588.162.297.2]3.2.3 Moment
Fig 15 Bending moment along (+) Mx
Out of these models normal building has very less moment when compared to shear wall provided models.
3.2.4 Steel quantities
Fig 16 Steel quantities
14.058 22.624 19.605 14.475 19.281 13.88 6.906 14.885
9.343 10.716
0 5 10 15 20 25
Normal SW at
12m TSW at9m T SW at6m T 12m CSW at SW at9m C SW at6m C 12m BSW at SW at9m B Sw at6 m B
Mo
ment
Moment (kN/m) along - Mx
20.58 21.04
20.78 20.87
21.07 21.19 21.16 21.28
21.33 21.37
20.00 21.00 22.00
Normal SW at
6m T SW at6m C Sw at 6m B SW at9m T SW at9m C SW at9m B 12m TSW at 12m CSW at 12m BSW at
Ton
s
Steel Quantities
13.827 14.435
14.811 14.936
14.424
14.679 14.682 14.435
14.811 14.936
13 13.5 14 14.5 15 15.5
Normal SW at
12m B SW at9m B Sw at 6m B 12m CSW at SW at9m C SW at6m C 12m TSW at SW at9m T SW at6m T
Di sp la cem ent
Horizontal Node Displacement (mm) along (+) X
9.126 9.621
12.41 12.482
9.629
12.393 12.411
9.621
12.41 12.482
0 2 4 6 8 10 12 14
Normal SW at 12m T
SW at 9m T
SW at 6m T
SW at 12m C
SW at 9m C
SW at 6m C
SW at 12m B
SW at 9m B
SW at 6 m B
Sup po rt r ea ct io n
Support Reactions (kN) along + Fx
0.27
1.206 1.673 1.587 0.877 0.872 0.942
5.706
6.693 6.828
0 2 4 6 8
Normal SW at
12m TSW at9m T SW at6m T 12m CSW at SW at9m C SW at6m C 12m BSW at SW at9m B SW at6 m B
Mo
ment
Moment (kN/m) Along + Mx
20.41 20.61 20.44 20.62 20.79 20.64 20.79 20.76 20.59 20.76 20.20 20.40 20.60 20.80 21.00
Normal SW at
6m T SW at6m C Sw at 6m B SW at9m T SW at9m C SW at9m B 12m TSW at12m CSW at 12m BSW at
To
ns
[image:5.612.35.583.364.722.2] [image:5.612.319.587.368.500.2]© 2016, IRJET | Impact Factor value: 4.45 | ISO 9001:2008 Certified Journal
| Page 1996
4 CONCLUSIONS
4.1 TIME HISTROY ANALYSIS
1. We can see the nodal displacement (+X) in RC frame structure with shear wall at 12 m and 9 m Top, Centre and Bottom in YZ plane has increased some percentages but the shear wall at 6 m Top, Centre and Bottom in YZ plane has decreased by 12.3%, 15.5% and 12.3% respectively when compared to normal building.
2. By placing the shear wall at 6 m Centre in YZ plane has decreased by 15.5% of nodal displacement when compared to normal building.
3. The shear wall at 6 m Top, Centre and Bottom in YZ plane has increased by around 15% of support reaction but 12 m and 9 m Top, Centre and Bottom in YZ plane has increased by more percentages when compared to normal building.
4. The provision of shear wall at 6 m Centre gave lower bending moment when compared to other models. So provision of shear wall at 6 m Centre gives rigidity to structure.
5. The steel quantities (tons) in RC frame structure with shear wall in YZ plane at 6 m Top has increased by 2.21%, 6 m Centre has increased by 0.94 %, 6 m Bottom has increased by 1.41%, 9 m Top has increased by 2.35%, 9 m Centre has increased by 2.96%, 9 m Bottom has increased by 2.81%, 12 m Top has increased by 3.86%, 12 m Centre has increased by 3.64% and 12 m Bottom has increased by 3.82% when compared to normal building.
6. From the above cases the shear wall at 6 m Centre has required lower quantity of steel when compared to other models.
4.2 RESPONSE SPECTRUM
1. When compared to normal building, provision of shear wall at any location (modals developed in the thesis) has increased the nodal displacement. But out of these shear wall at 12 m Centre gave lower displacement.
2. The shear wall at 12 m Top, Centre and Bottom in YZ plane has increased lower percentages of support reaction when are compared to The shear wall at 6 m and 9 m Top, Centre and Bottom.
3. Provision of shear wall at 12 m, 9 m and 6 m Centre in YZ plane has increased lower percentages of support
reaction when are compared to the shear wall at 12 m, 9 m and 6 m Top and Bottom.
4. The steel quantities (tons) in RC frame structure with shear wall in YZ plane at 6 m Top has increased by 0.98%, 6 m Centre has increased by 0.17%, 6 m Bottom has increased by 1.04%, 9 m Top has increased by 1.87%, 9 m Centre has increased by 1.14%, 9 m Bottom has increased by 1.87%, 12 m Top has increased by 1.75%, 12 m Centre has increased by 0.91% and 12 m Bottom has increased by 1.75% when compared to normal building.
5. From the above cases the shear wall at 6 m Centre has required lower quantity of steel when compared to other models.
However, it is evident that Response spectrum method has been wrong method in seismic analysis and it is also proven in this thesis.
REFERENCES
1. O.Esmaili and S.R.Mirghaderi, “Study of structural shear wall system in 56-storey tall building”, 14 World conference on earthquake engineering, 2008. 2. Ashiks.parasiya and Anant desai, “Seismic analysis of
steel braced reinforced concrete frames”, international journal of civil and structural engineering, vol.1, 2010.
3. K.G.Viswanath, K.B. Prakash and Anent Desai, “Seismic Analysis of Steel Braced Reinforced Concrete Frames”, International Journal of Civil and Structural Engineering, Volume 1, 2010 ISSN 0976 – 4399. 4. Varsha R. Harne “Comparative Study Of Strength Of
RC Shear Wall At Different Locations”, (International Journal of Civil Engineering Research), 2010.
5. Moein and M.majid, “Anlysis of steel building with x-bracing by nonlinear time history analysis”, 15 World conference on earthquake engineering (WCEE), 2012. 6. K.k sangle, K.M Bajoria, “seismic analysis of high rise steel building with and without brsacing”, 15 World conference on earthquake engineering (WCEE), 2012. 7. Miss.S.A. Ghadge, S.S. Patil,C.G. Konapure, “ Equivalent Static Analysis of High-Rise Building with Different Lateral Load Resisting Systems”, International Journal of Engineering Research & Technology (IJERT) , Vol. 2 Issue 1, January- 2013.
© 2016, IRJET | Impact Factor value: 4.45 | ISO 9001:2008 Certified Journal
| Page 1997
on seismic response of a moment-resisting Frame”, European Scientific Journal May 2014.
9. P.sairaj and K.Paidmanabham,”Performance based seismic design of braced multi-storied building”, International journal of Innovative Reasearch in Science Engineering and Technology, vol.3 issue2, february 2014.
10. S.Karthick , Udaya kumar.s , Geetha.g, “Study on lateral resistance behaviour of buildings with and without shearwalls”,The international jouranl of science & technology (ISSN 2321-919X) , febraary 2016.
11. C.V.alukunte, M.V.Dhimate, “Seismic analysis of multi-storey building having infill wall, shearwall and bracing”, imperial journal of interdisciplinary research , February 2016.
12. IS:1893 (Part 1)-2002, Criteria for earthquake resistant design of structure, general provision and building, Bureau of Indian standards, New Delhi. 2002.
13. IS 456-2000 “Code of practice for plane and reinforced concrete” Bureau of Indian standards, New Delhi. 2002.
14. 14. IS 875 Part 1 “Unit weights of Building material sand Stored materials”, Bureau of Indian standards, New Delhi. 2002.
15. IS 13920-193, “Earthquake resistant design and construction of buildings – code of practice (second revision)” Bureau of Indian standards, New Delhi. 2002.
16. http://www.vibrationdata.com/data.htm”, Time vs. Act values are considered.
17. http://www.isr.gujarat.gov.in/seismic zoning india. php, Institute of Seismogical Research, (government of India)