© 2017, IRJET | Impact Factor value: 5.181 | ISO 9001:2008 Certified Journal | Page 257
Developing the Tool for Vendor Selection in Power Sector Using Cost of
Quality
Sahil Bhardwaj
*1, R M Belokar
11
Department of Production & Industrial Engineering PEC University of Technology Chandigarh
---***---Abstract - Today the cost of quality has become most important tool as per strategic and economic importance is concerned. The cost of quality analysis trigger changes and provides the need to be made to improve and maintain the financial position of an organization which is being directly correlated to the quality improvements. This paper presents the cumulative impact of cost of quality on the product duly taking the case of power distribution sector. There are number of factors which are effective in improving the quality such as leadership, customer focus, supply chain management, product and process management etc. The cost of poor quality places a basic role to make the product cost efficient and competitive. Keeping in view of the various factors causing poor quality are highlighted in order to take preventive steps as well as control. Moreover the process of supplier selection in any organisation plays a significant and important role in procuring the equipments. Tata Power Delhi Distribution Ltd Delhi has a vision to analyse suppliers’ historical quality performances and integrate this data into future supplier selections. a constructive research approach has been adopted further empirics and theories have been studied in an iterative process to identify their cost drivers in order to fulfil the purpose of developing a tool.
1. Introduction
Power Quality (PQ) related issues are of most concern nowadays. The widespread use of electronic equipment, such as information technology equipment, power electronics such as adjustable speed drives (ASD), programmable logic controllers (PLC), energy-efficient lighting, led to a complete change of electric loads nature. Along with technology advance, the organization of the worldwide economy has evolved towards globalisation and the profit margins of many activities tend to decrease. The increased sensitivity of the vast majority of processes (industrial, services and even residential) to PQ problems turns the availability of electric power with quality a crucial factor for competitiveness in every activity sector. The most critical areas are the continuous process industry and the information technology services. When a disturbance occurs, huge financial losses may happen, with the consequent loss of productivity and competitiveness.
The cost of poor quality is accounted as the annual monitory loss of an industry on its balance sheet. Apparently the cost of poor quality is not concerned with
quality only but cost of waste associated because of poor performance and process along with serious impact on companies market reputation and good will. Cost of poor quality is widely not measured in companies, even if there are many hidden failure costs affecting profitability of companies. As per PAF model the quality costs are commonly categorized in prevention-, appraisal- and failure costs . There are different interpretations of the general PAF-model, which facilitate the quality awareness within an organization (Juran and De Feo, 2010; Gryna, 1999; Harrington, 1999; Giakatis et al., 2001). However, since each organization is unique with individual requirements it is difficult to know how to measure Cost of poor quality. Further, Krishnan (2006) uses the traditional metaphor “Cost of Quality Iceberg” to illustrate visible and hidden quality costs within an organization. It illustrates that the visible costs are more often taken into considerations while the hidden costs are not prioritized (Krishnan, 2006). The majority of the identified Cost of poor quality are visual costs since those are easier to measure than the hidden costs. According to Bergman and Klefsjö (2010) it is important to work towards high quality already in development and service, since it is less costly to change a product’s characteristics in early stage of a product value than it is in the production stage or, even worse, on the market. Even though early research concludes that there is a need to spread the knowledge for Cost of poor quality throughout the organization.
© 2017, IRJET | Impact Factor value: 5.181 | ISO 9001:2008 Certified Journal | Page 258 As expected, poor quality cost measured with new Cost
of poor quality model were much higher than before, when also hidden costs became visible. It is pertinent to mention here that Cost of poor quality model itself can be used for evaluating quality and spotting targets for improvement, when cost structure model for delivery chain helps develop knowledge of delivery operations. Overall poor quality and its costs seems to be like domino blocks which are falling more blocks further this chain reaction proceed with bigger mess and consequences. Thus prevention of quality faults before they even exist should be the primary importance.
The criteria regarding quality is important, but can be hard to estimate. The difficulties lie in the complexity of knowing the real outcome caused by poor quality. In some cases it might be more beneficial and profitable to choose a supplier with somewhat lower quality in front of one with a higher purchase price as well as it can be more profitable in the long run to pay extra for higher quality. Despite the complexity in quantifying quality, it is important to have a comprehension of the possible effects from high and low quality. Poor quality can lead to major costs later on in the production process and the later in the production process the faults are discovered the more expensive it will be (Sörqvist, 2012). An even worse scenario is if the faulted products actually reach the customers.
The objective was to provide more comprehensive view of quality costs in deliveries for support managerial work. This research design was a single case study and it is limited to cover performance of distribution transformers a in one year observation period. Data for the study was collected through interviews as well as the record available. Poor quality activities and costs caused were categorized in internal and external failure costs, and allocated to each responsible cost object.
2. The case study at TATA Power Delhi Distribution Ltd.
Tata Power-DDL has been the frontrunner in implementing power distribution reforms in the capital city New Delhi and is acknowledged for its consumer friendly practices. It is a joint venture between Tata Power and the Government of NCT of Delhi with the majority stake being held by Tata Power Company. Tata Power-DDL distributes electricity in North & North West parts of Delhi and serves its registered consumer base of 1.51 million and a peak load of around 1764 MW (May 2016), the company's operations span across an area of 510 sq kms. Since privatization, the Aggregate Technical & Commercial (AT&C) losses in Tata Power-DDL areas have shown a record decline. AT&C loss is a measure of overall efficiency of the distribution business which is the difference between units input into the system and the units for which the payment is collected. Today, AT
& C losses still stand at 8.88% which is an unprecedented reduction of around 82% from an opening loss level of 53% in July 2002. On the power supply front too, Tata Power-DDL areas have shown remarkable improvement. When choosing supplier at TATA Power Delhi Distribution Ltd. costs of, lead--‐time, legal aspects and commercial aspects especially purchase price are analyzed. In some supplier selections the Supplier Quality Engineering department gives indications of poor quality delivered from a supplier. The Strategic Buyer listens but don’t know how much the poor quality will cost the company in the long run and can consequently not motivate a selection of a more expensive supplier. The quality aspect is thereby today mostly based on intuitions, which make it difficult to include in supplier selections.
TATA Power Delhi Distribution Ltd. has paid more and more attention to this problem and has a wish to integrate the Costs of Quality into the selection process. This piece of research work will make an attempt to contribute by introducing a perspective of how to integrate historical supplier quality performance into future supplier selection.
3. Methodology
© 2017, IRJET | Impact Factor value: 5.181 | ISO 9001:2008 Certified Journal | Page 259 can be quantified. Furthermore, the tool that has been
developed on basis of conclusions drawn from both the case study and the interviews with quality experts and specialists.
The empirical study of this work has been divided into several parts. First, interviews were done with quality expert and specialists in their field. These interviews increased the knowledge about CoPQ. The workshops were organised by the organisation focused on cost parameters within procurement department. Next step in the research process was a single case study within a company. In the case study, interviews as well as observations and reviews of documentation were included. The different parts will be explained more in detail below. Interviews with quality expert- and specialists as interviews are often considered as the best method for collecting data. It is a process of communication. Several interviews were held with quality specialists working within TPDDL . Each of the interviews was conducted face-to-face during one to two hours. One example is the question: Which CoPQ parameters are most critical? The question is open and the interviewee had the possibility to decide upon which cost parameter he/she found most critical.
4. Result and Discussion
The process within TPDDL is presented for pre dispatch processes so as to ensure proper quality materials are procured from vendors as per the specification , subsequently the process starts with the selection process of venders so as to purchase materials required and after that inspection is done which is divided into two parts one is pre-dispatch inspection and issue of MDCC and second one is for pre dispatch inspection and external agencies
4.1 Development of Supplier Quality Performance Tool
Our research work has been concerned with collection of field observations in the form of data its analysis and interpretation in the light of tool of Total Quality Management. The objective of work has remained to interpret the data for characterization of cost of poor quality. A new tool has been designed which describes the cost drivers which is gathered from the data
In order to apply the costs to the theoretical framework, the cost related to the specific cost drivers is summarized into the total Cost of Quality(component) by the formula:
While the Total Cost of Quality(supplier) is estimated by the formula :
The Total Cost of Quality is subsequently divided by the total amount of purchased components and finally added to the purchase price.
To achieve the objective of this research paper data was examined and consider for costly equipments purchase by TPDDL during FY”2016-17” . During the survey and consulting the in charge of different divisions as well as the technical experts we identified the equipments that has more importance and relevance in the operation of the power distribution to north and north west Delhi.
Table -1 Costly Equipments Procured by Procurement Department
S.No Class A equipment’s
1 66 kv & 33 kv LA, CT, PT, Bushings, Isolators 2 EHV & HT Underground Cables
3 Distribution Transformers 4 Capacitor banks
5 Switchgear and Relay Panel Banks including Automation Panel
6 All kind of meter (single phase, 3 phase, pre-paid , CT based , HT meters)
We have considered the analysis of rejection of transformer as our case study because the magnitude of rejection and losses were found maximum so in this regard various observations were collected
Table -2 The factor of rejection of distribution transformer during FY 2016-17
D.T REC EIV ED AT STO RE
D.T REJEC TED FOR ANY REAS ON
D.T CORRECTI ON ISSUE
D.T SENT BACK
D.T (TRANS PORTA TION ISSUE)
D.T QUAL ITY CHEC KS TO IMPR OVE
461 319 Minor
issues for lift
68 35 33
© 2017, IRJET | Impact Factor value: 5.181 | ISO 9001:2008 Certified Journal | Page 260
461
[image:4.595.57.261.92.201.2]319 68 35 33
Fig-1 Rejection of distribution transformer during the FY 2016-17
The table and figure that out of 461 distribution transformer received at store out of which 319 were marked as faulty at the initial inspection later on 68 distribution transformer were rejected and finally sent back as 35 got damaged during transportation while remaining 33 were found faulty as they were not meeting the specifications mentioned in the orders
The department Procurement Quality has recommended a checklist for checking the physical parameters for equipments which contains : Less clearance if any , Quality of gasket , Rusting, Leakage, Damage due to transportation , and Missing components
If this procedure for inspecting the physical parameter for distribution transformer would have been adopted than the result would have further changed and failure rate would have be controlled to a large extent
4.2 External Failure of Distribution Transformer
While surveying in the field it was observed that 6 distribution transformer were found not working as they failed during operation though the transformers were under warranty. Due to the non operation of this distribution transformer the power supply could not be continued and as a result there were losses to company and reliability of power supply were affected. It was also observed that these distribution transformer that failed were under warranty period
It is evident that the losses are maximum due to the failure of distribution transformer with capacity 630 KVA so we have considered this Transformer for the vendor selection. Due to the failure of distribution transformer while operation the financial losses were estimated using the formula:
Mu(million unit) losses x time(hours) x 106 x cost per
unit
[image:4.595.319.557.535.669.2]During FY 2016-17 a loss of 1,87,500 has been estimated during to the failure of 630 KVA D.T which is quite significant
Table -3 Existing Process for Evaluation Parameter of TPDDL
S.
No. Evaluation Parameter Maximum Allowable Score
A Timeliness 70
A.1. (70 – 0.5 x No. of days for delay beyond scheduled time period)
70
B Quantity 30
B.1. (30 – 0.30 x % quantity remaining undelivered) 30
4.3 Modified Process for Vendor Selection
The selection of vendor for any equipment has a significant role in day to day working of an organisation. It has been observed that the criteria being used for the selection of vendors in TPDDL does not contain Cost of Quality. It is proposed that the formula for the vend or selection need to be further modified by introducing Cost of Quality as additional factor. The modified formula is as follows
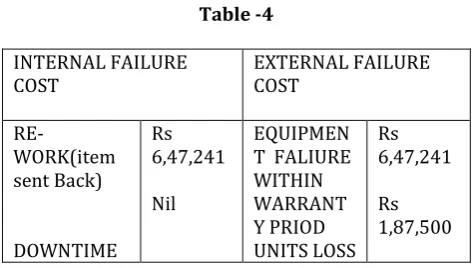
Calculating Cost of Poor Quality for the 630 KVA Distribution Transformers
The under mentioned formula has been used for the estimation of calculation of cost of poor quality for distribution transformer:
Internal failure + External failure
Table -4
INTERNAL FAILURE
COST EXTERNAL FAILURE COST
RE-WORK(item sent Back)
DOWNTIME Rs 6,47,241 Nil
EQUIPMEN T FALIURE WITHIN WARRANT Y PRIOD
UNITS LOSS Rs
6,47,241
Rs 1,87,500
© 2017, IRJET | Impact Factor value: 5.181 | ISO 9001:2008 Certified Journal | Page 261 Calculating the Cost of Good Quality for 630 KVA
Distribution Transformer:
The cost of maintenance of good quality for the distribution transformer can be estimated by using formula:
Prevention Cost + Appraisal Cost
Table -5
PREVENTION
COST = Nil APPRAISAL COST = INSPECTION COST + VENDOR COST = Rs. 58,829
Calculating Cost of Quality for 630 KVA Distribution Transformer
Cost of Poor Quality + Cost of Good Quality = Rs 8,93,570 Rs
4.4 Vendor Selection
Keeping the above facts into consideration the criteria for vendor selection need to be further modified by introducing Total Cost of Quality as additional factor. In terms of purchase cost the vendor selection can be done in a significant way by adding Total Cost of Quality in it . In this manner the total cost of 630 KVA Distribution Transformer work out as follows
Hence in making the selection of the vendors Total Cost of Quality plays a significant role the vendors with the lower prize should be considered for purchase of items
5. Conclusion
The efficient material and supply chain management is a very significant and crucial for the success of any organisation better material management methods and decision models are required to improve the current practices which increase the efficiency and minimises the cost. For organizations with a large supply chain network, the Cost of quality of individual suppliers participating within a supply chain has a cumulative effect on the overall revenue of the organization. As a result, it would do well if work is done proactively with suppliers to reduce Cost of poor quality. Many organizations are also implementing supplier charge-backs (or cost recovery) process, wherein the supplier is charged for any additional costs incurred due to non-conforming components and materials, as well as late deliveries. An effective charge-back system can help keep track of all the metrics related to suppliers’
performance, along with ensuring business discipline and accountability throughout the supply chain.
The research presented in this paper emphasize on designing an integrated system for poor quality cost and integrated approach for material procurement that provides better decision on vendor selection . Future research will be needed to develop a more complete framework integrated with other decision needed in areas such as vendor selection, preliminary material scheduling during the pre-fabrication phase a fully integrated approach will further improve communication and minimise gaps in information flow.
Acknowledgement:
Author Sahil Bhardwaj is thankful to Tata Power Delhi Distribution Ltd. New Delhi for extending the financial and administrative support for this study.
6. References
Axsäter S. (2006). Inventory Control. Springer, Vol. 2. Benyoceuf, B., Hongwei, D., Xiaolan, X. (2003). ”Supplier
selection problem: selection criteria and methods”. Institut National de Recherche en Informatique et enAutomatique (INRIA). Bergman, B. and Klefsjö, B. (2010) Quality - from
Customer Needs to Customer Satisfaction. Lund: Studentlitteratur. 3rd edition.
Bryman, A. and Bell, E. (2011) Business research methods. Oxford University Press, Oxford. 3rd edition.
Burt, D.W. (2003). World Class Supply Management The Key to Supply Chain Management. The McGraw Hill , p. 492, 495.
Campanella, J. (1999). “Principles of quality costs: Principles, Implementation and Use”. ASQ Quality Press, p. 3-‐‐5.
Cooper, R. , Kaplan, R. S. (1992). Activity based systems: Measuring the costs of resource usage. Accounting Horizons.
Degraeve, Z. & Roodhoft, F. (1999a).“Effectively selecting suppliers using Total Cost of Ownership”, published in Arlbjørn J.S, Zachariassen F. (2009). Total Cost of Ownership: A differentiated Approach. Department of Entrepreneurship and Relationship Management, University of Southern Denmark.
Ellram, L. (1993). “A Framework for Total Cost of Ownership”. The International Journal of Logistics Management, Vol. 4 No.2, p. 49--‐59.
© 2017, IRJET | Impact Factor value: 5.181 | ISO 9001:2008 Certified Journal | Page 262 Ellram, L. , Siferd, S.P. (1993). “Purchasing: The
cornerstone of the Total Cost of Ownership concept”. Journal of Business Logistics, Vol. 14 No.1, p. 163-‐‐184.
Ferrin, B.G., Plank, R.E. (2002). “Total Cost of Ownership models: The journal of Supply Chain Management, p. 18-‐‐29.
Ghauri, P., & Gronhaug, K. (2010). Research Methods in Business Studies: A Practical Guide. (Fourth Edition ed.) FT-Pearson
Giakatis, G., Enkawa, T. and Washitani, K. (2001) "Hidden quality costs and the distinction between quality cost and quality loss", Total Quality Management, vol. 12, no. 2, pp. 179190. Gryna, F. M. In Juran, J.M. and Godfrey, A.B. (1999)
Juran’s Quality Handbook.
Hansen, D.R., Mowen, M.M. (1997). Cost accounting; Activity--‐based accounting; Managerial accounting. South Western College Pub. Harrington, H.J. (1987) Poor-quality cost. New York:
Decker.
Humphreys, P., Mak, K.L., Yeung, C.M. (1998). “A just-‐‐in-‐‐time evaluation strategy for international procurement”.
Hoque, Z. (2003). Strategic Management Accounting. Pearson Prentice Hall, p. 179.
Höst, B.R. (2006). Att genomföra examensarbete. Lund: Studentlitteratur, p. 29-‐‐42.
Juran, J.M. and De Feo, J.A. (2010) Juran’s quality handbook: the complete guide to performance excellence. New York: McGraw Hill. 6th edition.
Krishnan, S.K. (2006) "Increasing the visibility of hidden failure costs", Measuring Business Excellence, Vol. 10 Iss 4 pp. 77-101.
Kumar, S.A., Suresh, N. (2009). Operations Management. New Age International (P) Limited, Publishers, p. 180.
Levary, R.R. (2007). “Ranking foreign suppliers based on supply risk”. Supply ChainManagement: An
International Journal, Vol. 12 No. 6, p. 392 --‐ 394
Ljung, L., Glad, T. (1991). Modellbygge och simulering. Studentlitteratur.
Lukka, K. (2003). “The Constructive Approach, in Ojala, L. and Hilmola, O-‐‐P. (2003). Case Study Research in Logistics”. Publications of The Turku School of Economics and Business Administration, Serie B 1, p. 83-‐‐100. Saaty, T.L. (2008). “Decision making with the analytic
hierarchy process”. International Journal Services Sciences, Vol. 1 No. 1, p. 83-‐‐98. Sánchez-‐‐Rodriguez, C., Hemsworth, D.,
Martinez-‐‐Lorente, A.R. (2004), QualityManagement Practices in Purchasing and its Effect on Purchasing’s Operational Performance and
Internal Customer Satisfaction.
International Journal of Logistic: Research and Applications, Vol. 7 No 4, p. 325-‐‐344. Saunders, M. (2009). Research Methods for Business
Students. Pearson.
Svensson, B.S.G. (1994). Kvalitativ metod och vetenskapsteori. Lund: Studentlitteratur. Sörqvist, L. (1998). Kvalitetsbristkostnader, Ett
hjälpmedel för verksamhetsutveckling. Tsai, W.H. (1998).“Quality cost measurement
under activity based costing”. International Journal of Quality & Reliability Management, Vol. 15 No 7 p. 719-‐‐752. van Weele, A.J. (2010). Purchasing and Supply Chain
Management. South-‐‐Western Cengage Learning, p. 238-‐‐239, 241-‐‐242.
Wei-‐‐Ning, P. (2005). “Supplier evaluation and selection using Taguchi loss functions”. International Journal Adv Manuf Technol, p. 155-‐‐160. Xinxing, L., Chong, W., Rosenberg, D., Barnes, D. (2009).