© 2018, IRJET | Impact Factor value: 6.171 | ISO 9001:2008 Certified Journal | Page 4984
Seismic Analysis, Design and Comparative Study of RC Structure Using
Different Codes
Amit B. Anwade
1, Shubham B. Aher
2, Akshay D. Barate
3, Shivam Raghuvanshi
4, Mrs. Smita
Kuralkar
51,2,3,4 B.E. Student, Civil Engineering Department, G.H.R.C.E.M Pune, Maharashtra, India
5Professor, Civil Engineering Department, G.H.R.C.E.M Pune, Maharashtra, India
---***---Abstract -
This study focuses on comparison of International standards. The chosen standards are IS code, IBC and Canada code. The study also helps in understanding the main contributing factors which lead to poor performance of Structure during the earthquake, so as to achieve their adequate safe behavior under future earthquakes. In this project, a residential building of G+10, G+15, G+20 and G+25, Special RC moment-resting frame (SMRF) is taken for study. Modelling of the structure is done as per STAAD.pro V8i software. Time period of the structure in both the direction is taken from the software and as per the three standards 12 models are made i.e. 4 models for each code. The analytical results of the model buildings are then represented graphically and in tabular form, it is compared and analyzed taking note of any significant differences. This study focuses on exploring variations in the results obtained using the three codes i.e. IS code, IBC and Canada code. A comparative analysis is performed in terms of base shear, displacement and storey drift.Key Words: Base Shear, Displacement, Seismic Analysis, Storey Drift
1. INTRODUCTION
1.1 Overview
An earthquake may be defined as release of elastic energy by sudden slip on a fault and resulting ground shaking and radiated caused by slip. Earthquakes are one of the worst among the natural disasters. About 1 lakh earthquakes of magnitude more than three hit the earth every year. According to a conservative estimate more than 15 million human lives have been lost and damage worth hundred billions of dollars has been inflicted in the recorded history due to these.
Natural calamities such as earthquakes, Tsunamis, Landslides, Floods etc. causes severe damage and suffering to human being by collapsing many structures, trapping or killing persons, cutting off transport systems, blocking of navigation systems, animals hazards etc. Such natural disasters are big challenges to the progress of development. However, civil engineers play a major role in minimizing the damages by proper designing the structures or by proper material selections or proper Constructions procedure and taking other useful decisions. This includes understanding the earthquakes, behavior of the materials of construction
and structures and the extent to which structural engineers make use of the knowledge in taking proper decisions in designing the structures made of reinforced concrete.
Earthquakes are defined as a vibration of the earth's surface that occurs after a release of energy in the earth's crust. Because the earth's crust is made up of numerous plates that are constantly moving slowly, vibrations can occur which result in small earthquakes. Most earthquakes are small but are not readily felt. Larger and violent earthquakes are those which occur in a release of energy as the plates slide past or collide into one another. The characteristics such as intensity, duration, etc. of seismic ground vibrations expected at any location depend upon the magnitude of earthquake, its depth of focus, distance from the epicenter, characteristics of the path through which the seismic waves travel, and the soil strata on which the structure stands. The predominant direction of ground vibration is usually horizontal. Reinforced concrete Special moment frames are used as part of seismic force resisting systems in buildings that are designed to resist earthquakes. Beams and columns in moment frames are proportioned and detailed in such a manner that they must resist flexural, axial, and shearing actions that result as a building sways through multiple displacement cycles during strong earthquake ground shaking. Special proportioning and detailing requirements are responsible for frame, capable of resisting strong earthquake shaking without significant loss of stiffness or strength. These moment resisting frames are called “Special Moment Frames” because of these additional requirements, which improve the seismic resistance in comparison with less detailed Intermediate and Ordinary Moment Frames.
© 2018, IRJET | Impact Factor value: 6.171 | ISO 9001:2008 Certified Journal | Page 4985 Seismic building codes are guidelines to design and construct
the buildings and civil engineering works in seismic regions. Reasons behind is to protect human lives from worst conditions which occurs during earthquake, to limit damage, and to sustain operations of important structures for civil protection. Seismic design has progressed significantly over the year due to the contribution of practicing engineers, as well as academic and governmental researchers. The progress depends on the improvement of the representation of ground motion, soil type and
1.2 Objective of the Project:
The main objective of this project is to bring out the main contributing factors which lead to poor performance during the earthquake and make recommendations which should be taken into account in designing the multi-storeyed reinforced concrete buildings so as to achieve their adequate safe behaviour under future earthquakes. Earthquake codes have been revised and updated depending on the improvements in the representation of ground motions, soils and structures. The Indian Standard Code IS: 1893 was suitably updated in 2002 so as to address the various design issues brought out in the earthquake behaviour of the RC Buildings.
The chosen standards are Indian Standard Code IS: 1893, Canada code and International building code (ASCE). A comparative analysis was performed in terms of Base shear, Displacement, for different codes.
1.3 Methodology:
The methodology worked out to achieve the mentioned objectives is as follows:
1. Modeling of the selected building in STAAD.pro V8i Software.
2. Retrieved time period of structure from the software.
3. Three models as per the codes i.e. Indian code, Canada code, IBC (ASCE) specification were made.
4. Applied manually calculated Lateral seismic forces and load combinations as per IS 1893-2002, Canada code and IBC (ASCE).
5. Analyzed the models and graphical and tabular representation of the data is presented.
2. MODELLING
A multi-storey building of G+10, G+15, G+20, and G+25, Special RC moment-resting frame (SMRF) is taken for study. The typical storey height is 3m for all storey.
The three codal provisions as mentioned above. A Linear Static analysis is done using STAAD.pro V8i Software. The
model is studied for all three code for severe parameter with medium soil condition.
2.1 Plan and Specification of the Building
MODEL: Plan of the building
[image:2.595.316.554.152.416.2]Fig (1). Plan of Building
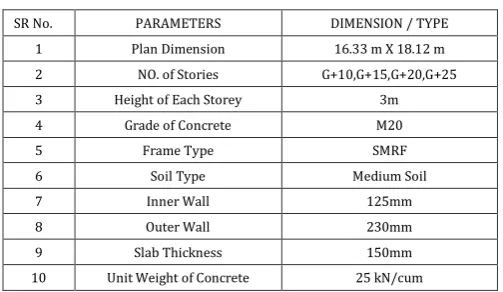
Table -1: Specification of the Building
SR No. PARAMETERS DIMENSION / TYPE
1 Plan Dimension 16.33 m X 18.12 m
2 NO. of Stories G+10,G+15,G+20,G+25
3 Height of Each Storey 3m
4 Grade of Concrete M20
5 Frame Type SMRF
6 Soil Type Medium Soil
7 Inner Wall 125mm
8 Outer Wall 230mm
9 Slab Thickness 150mm
10 Unit Weight of Concrete 25 kN/cum
3. ANALYSIS AND RESULTS
3.1 Result obtained for Base Shear
Case (i). Result for Base Shear in X-Direction Table -2: Base Shear in X-Direction (kN)
Model IS IBC CANADA
G+10 1948.88 2151.73 2357.22
G+15 2845.53 2992.92 3025.28
G+20 3631.84 3883.64 3902.80
[image:2.595.307.559.450.596.2]© 2018, IRJET | Impact Factor value: 6.171 | ISO 9001:2008 Certified Journal | Page 4986 Fig (2). Base shear for earthquake in X-direction
[image:3.595.37.295.71.253.2]Case (ii). Result for Base Shear in Z-Direction
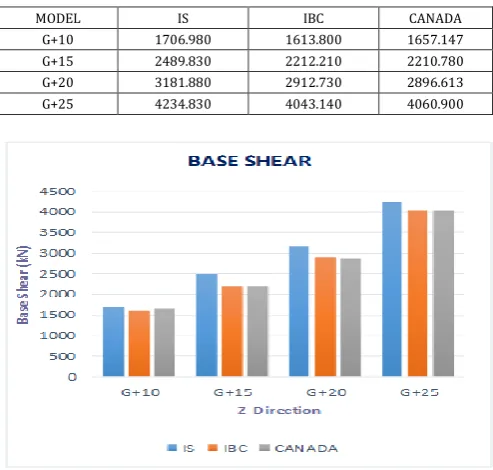
Table -3: Base Shear in Z-Direction (kN)
MODEL IS IBC CANADA
G+10 1706.980 1613.800 1657.147
G+15 2489.830 2212.210 2210.780
G+20 3181.880 2912.730 2896.613
G+25 4234.830 4043.140 4060.900
Fig (3). Base shear for earthquake in Z-direction
3.2 Result obtained for Displacement 3.2.1 Result for G+10
Table -4: Maximum Displacement (mm)
FLOOR IS CANADA IBC
G 4.0560 3.9260 4.0150
1 5.3430 5.3990 5.3430
2 6.7240 6.8340 6.7610
3 7.9400 8.0350 7.5520
4 8.9530 9.0490 8.9360
5 9.7770 9.8640 9.7320
6 10.424 10.497 10.353
7 10.906 10.982 10.816
8 11.243 11.329 11.144
9 11.462 11.570 11.365
10 11.316 11.535 11.231
Fig (4). Comparing result of Displacement
3.2.2 Result for G+15
Table -5: Maximum Displacement (mm)
FLOOR IS Canada IBC
G 3.2210 3.6060 3.3250
1 4.4770 5.2430 4.8310
2 5.7310 6.7030 6.1760
3 6.8350 7.9570 7.3350
4 7.5680 9.1200 8.4170
5 8.9310 10.308 9.5350
6 9.8780 11.543 10.504
7 10.689 12.225 11.324
8 11.355 12.916 11.982
9 12.130 13.670 12.716
10 12.797 14.298 13.265
11 13.338 14.791 13.815
12 13.759 15.161 14.186
13 14.076 15.430 14.461
14 14.290 15.563 14.614
15 14.170 15.102 14.236
[image:3.595.299.560.72.307.2] [image:3.595.37.284.334.569.2] [image:3.595.42.561.383.794.2]© 2018, IRJET | Impact Factor value: 6.171 | ISO 9001:2008 Certified Journal | Page 4987 3.2.3 Result for G+20
Table -6: Maximum Displacement (mm)
FLOOR IS CANADA IBC
G 6.3820 6.3360 6.3720
1 8.4550 8.7580 8.7610
2 11.161 11.317 11.093
3 13.369 13.560 13.482
4 15.240 16.103 15.962
5 17.596 17.837 17.509
6 19.207 19.461 19.094
7 20.590 20.940 20.621
8 21.971 22.252 21.860
9 23.129 23.359 22.962
10 24.157 24.493 23.934
11 25.055 25.424 24.783
12 25.828 26.236 25.505
13 26.413 26.894 26.049
14 26.781 27.378 26.389
15 27.080 27.722 26.668
16 27.261 28.041 26.843
17 27.385 28.403 26.981
18 27.836 28.939 27.432
19 28.133 29.350 27.74
20 27.354 29.200 27.018
Fig (6). Comparing result of Displacement 3.2.4 Result for G+25
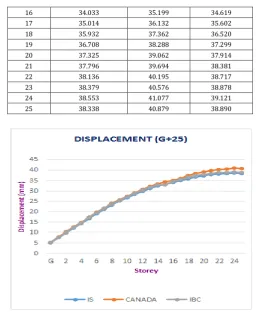
Table -7: Maximum Displacement (mm)
FLOOR IS CANADA IBC
G 5.0090 5.1460 5.1240
1 7.5760 7.7960 7.7500
2 9.9790 10.275 10.203
3 12.173 12.536 12.441
4 14.370 14.795 14.578
5 16.721 17.310 17.172
6 19.105 19.653 19.495
7 21.254 21.856 21.678
8 23.236 23.890 23.691
9 25.075 25.779 25.557
10 26.781 27.536 27.287
11 28.370 29.122 28.898
12 29.831 30.697 30.378
13 31.134 32.129 31.696
14 32.253 33.256 32.827
15 33.226 34.304 32.806
16 34.033 35.199 34.619
17 35.014 36.132 35.602
18 35.932 37.362 36.520
19 36.708 38.288 37.299
20 37.325 39.062 37.914
21 37.796 39.694 38.381
22 38.136 40.195 38.717
23 38.379 40.576 38.878
24 38.553 41.077 39.121
25 38.338 40.879 38.890
Fig (7). Comparing result of Displacement
[image:4.595.301.558.72.390.2]3.3 Result obtained for Storey Drift 3.3.1 Result for G+10
Table -8: Storey Drift (mm)
FLOOR IS CANADA IBC
1 0.0437 0.0520 0.0481
2 0.1604 0.2006 0.1855
3 0.2415 0.2855 0.2658
4 0.2837 0.3302 0.3108
5 0.3017 0.3429 0.3268
6 0.2924 0.3129 0.3086
7 0.2749 0.2857 0.2841
8 0.2379 0.2497 0.2501
9 0.1478 0.1703 0.1409
10 0.0627 0.0955 0.0563
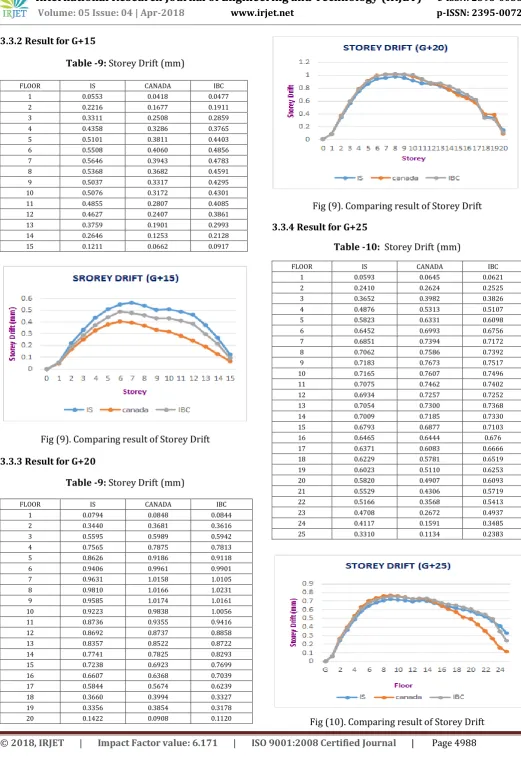
[image:4.595.35.286.119.523.2] [image:4.595.39.558.437.788.2]© 2018, IRJET | Impact Factor value: 6.171 | ISO 9001:2008 Certified Journal | Page 4988 3.3.2 Result for G+15
Table -9: Storey Drift (mm)
FLOOR IS CANADA IBC
1 0.0553 0.0418 0.0477
2 0.2216 0.1677 0.1911
3 0.3311 0.2508 0.2859
4 0.4358 0.3286 0.3765
5 0.5101 0.3811 0.4403
6 0.5508 0.4060 0.4856
7 0.5646 0.3943 0.4783
8 0.5368 0.3682 0.4591
9 0.5037 0.3317 0.4295
10 0.5076 0.3172 0.4301
11 0.4855 0.2807 0.4085
12 0.4627 0.2407 0.3861
13 0.3759 0.1901 0.2993
14 0.2646 0.1253 0.2128
15 0.1211 0.0662 0.0917
Fig (9). Comparing result of Storey Drift
[image:5.595.37.284.117.467.2]3.3.3 Result for G+20
Table -9: Storey Drift (mm)
FLOOR IS CANADA IBC
1 0.0794 0.0848 0.0844
2 0.3440 0.3681 0.3616
3 0.5595 0.5989 0.5942
4 0.7565 0.7875 0.7813
5 0.8626 0.9186 0.9118
6 0.9406 0.9961 0.9901
7 0.9631 1.0158 1.0105
8 0.9810 1.0166 1.0231
9 0.9585 1.0174 1.0161
10 0.9223 0.9838 1.0056
11 0.8736 0.9355 0.9416
12 0.8692 0.8737 0.8858
13 0.8357 0.8522 0.8722
14 0.7741 0.7825 0.8293
15 0.7238 0.6923 0.7699
16 0.6607 0.6368 0.7039
17 0.5844 0.5674 0.6239
18 0.3660 0.3994 0.3327
19 0.3356 0.3854 0.3178
20 0.1422 0.0908 0.1120
Fig (9). Comparing result of Storey Drift
3.3.4 Result for G+25
Table -10: Storey Drift (mm)
FLOOR IS CANADA IBC
1 0.0593 0.0645 0.0621
2 0.2410 0.2624 0.2525
3 0.3652 0.3982 0.3826
4 0.4876 0.5313 0.5107
5 0.5823 0.6331 0.6098
6 0.6452 0.6993 0.6756
7 0.6851 0.7394 0.7172
8 0.7062 0.7586 0.7392
9 0.7183 0.7673 0.7517
10 0.7165 0.7607 0.7496
11 0.7075 0.7462 0.7402
12 0.6934 0.7257 0.7252
13 0.7054 0.7300 0.7368
14 0.7009 0.7185 0.7330
15 0.6793 0.6877 0.7103
16 0.6465 0.6444 0.676
17 0.6371 0.6083 0.6666
18 0.6229 0.5781 0.6519
19 0.6023 0.5110 0.6253
20 0.5820 0.4907 0.6093
21 0.5529 0.4306 0.5719
22 0.5166 0.3568 0.5413
23 0.4708 0.2672 0.4937
24 0.4117 0.1591 0.3485
25 0.3310 0.1134 0.2383
© 2018, IRJET | Impact Factor value: 6.171 | ISO 9001:2008 Certified Journal | Page 4989
4. CONCLUSIONS
1. Conclusions for Base Shear
For G+10
Calculated base shear in X-direction, compared to Indian code, Canada code shows 17.32% more base shear and IBC shows 9.42% more base shear.
Calculated base shear in Z-direction, compared to Indian code, Canada code shows 11.20% less base shear and IBC shows 11.15% less base shear.
For G+15
Calculated base shear in X-direction, compared to Indian code, Canada code shows 5.94% more base shear and IBC shows 4.32% more base shear.
Calculated base shear in Z-direction, compared to Indian code, Canada code shows 2.92% less base shear and IBC shows 5.46% less base shear.
For G+20
Calculated base shear in X-direction, compared to Indian code, Canada code shows 6.94% more base shear and IBC shows 6.48% more base shear.
Calculated base shear in Z-direction, compared to Indian code, Canada code shows 8.97% less base shear and IBC shows 8.45% less base shear.
For G+25
Calculated base shear in X-direction, compared to Indian code, Canada code shows 8.37% more base shear and IBC shows 4.61% more base shear. Calculated base shear in Z-direction, compared to Indian code, Canada code shows 4.10% less base shear and IBC shows 4.53% less base shear. 2. Conclusions for Displacement
For G+10
Displacement as per Canada code is 6.52% less than IS code for 10th floor and difference between them is gradually increases up to 3rd floor and for 3rd floor, displacement as per Canada code is 6.72% less than IS code and from 2nd floor it is decreases gradually toward ground floor.
For G+15
Displacement as per Canada code is 3.57% less than IS code for 15th floor and difference between them is gradually increases up to 6th floor and for 6th floor, displacement as per Canada code 5.85% less than IS code and from 5th floor it is decreases gradually toward ground floor.
For G+20
Displacement as per Canada code is 6.65% less than IS code for 20th floor and difference between them is gradually increases up to 10th floor and for 10th floor, displacement as per Canada code is 17.72% less than IS code and from 9h floor it is decreases gradually toward ground floor.
For G+25
Displacement as per Canada code is 7.75% less than IS code for 25th floor and difference between them is gradually increases up to 11th floor and for 11th floor, displacement as per Canada code is 15.48% less than IS code and from 10h floor it is decreases gradually toward ground floor.
3. Conclusions for Storey Drift
For G+10
For IS code, storey drift increase at an average value of 17.67% up to 5th floor and then it decrease at an
average value of 18.67%.
For Canada code, storey drift increase at an average value of 15.33% up to 5th floor and then it decrease
at an average value of 18.10%.
For IBC, storey drift increase at an average value of 16.33% up to 5th floor and then it decrease at an
average value of 19.23%.
For G+15
For IS code, storey drift increase at an average value of 25.25% up to 7th floor and then it decrease at an
average value of 19.30%.
For Canada code, storey drift increase at an average value of 19.5% up to 6th floor and then it decrease at
an average value of 18.94%.
For IBC, storey drift increase at an average value of 19.83% up to 6th floor and then it decrease at an
average value of 16.52%.
For G+20
For IS code, storey drift increase at an average value of 17.20% up to 8th floor and then it decrease at an
average value of 19.34%.
For Canada code, storey drift increase at an average value of 19.50% up to 9th floor and then it decrease
at an average value of 19.59%.
For IBC, storey drift increase at an average value of 18.24% up to 8th floor and then it decrease at an
© 2018, IRJET | Impact Factor value: 6.171 | ISO 9001:2008 Certified Journal | Page 4990
For G+25
For IS code, storey drift increase at an average value of 18.15% up to 9th floor and then it decrease at an
average value of 17.17%.
For Canada code, storey drift increase at an average value of 17.46% up to 9th floor and then it decrease
at an average value of 17.75%.
For IBC, storey drift increase at an average value of 17.87% up to 9th floor and then it decrease at an
average value of 17.08%.
REFERENCES
[1] Pamela Jennifer, Jegidha. K., Sureshbabu, “Seismic Design of Multi-storeyed RC Building Using Various Codes” International Journal of Research in Engineering and Technology, Volume: 05 Issue: 02 / Feb-2016.
[2] Vinit Dhanvijay, Prof. Deepa Telang, Vikrant Nair, “Comparative Study of Different Codes in Seismic Assessment” International Research Journal of Ensgineering and Technology, Volume: 02 Issue: 04 | July-2015.
[3] Jaya Prakash Kadali,M.K.M.V.Rathnam, “Static Analysis of Multistoreyed RC Buildings By Using Pushover Methodology” International Journal for Innovative Research in Science & Technology Volume1,Issue 8, January 2015 pp113-124.1989.
[4] Mr.K.Lova Raju, Dr.K.V.G.D.Balaji. “Effective location of shear wall on performance of building frame subjected to earthquake load,” International Advanced Research Journal in Science, Engineering and Technology Vol. 2, Issue 1, January 2015, pp 3336.
[5] Md. Rashedul Kabir, Debasish Sen, Md. Mashfiqul Islam, “Response of multi-storey regular and irregular buildings of identical weight under static and dynamic loading in context of Bangladesh,” International journal of Civil and Structural Engineering, Volume 5, No 3, February 2015, pp 252-260.
[6] Akshay V. Raut, Prof. RVRK Prasad, “Pushover Analysis of G+3 Reinforced Concrete Building with soft storey,” IOSR Journal of Mechanical and Civil Engineering , Volume 11, Issue 4 Ver. I (Jul- Aug. 2014), PP 25-29.
[7] Lakshmi K.O, Prof. Jayasree Ramanujan, Mrs. Bindu Sunil, Dr. Laju Kottallil, Prof. Mercy Joseph Poweth,“Effect of shear wall location in buildings subjected to seismic loads,” ISOI Journal of Engineering and Computer science, Volume 1 Issue 1;2014, Page No. 07-17.
[8] Nitin Chaudhary, Prof. Mahendra Wadia, “Pushover Analysis of R.C. Frame Building with Shear Wall,” IOSR Journal of Mechanical and Civil Engineering, volume 11, Issue 2 Ver. V (Mar- Apr. 2014), PP 09-13.
[9] Riza Ainul Hakim, Mohammed Sohaib Alama, Samir A. Ashour, “Seismic Assessment of an RC Building Using Pushover Analysis,” Engineering, Technology & Applied Science Research Vol. 4, No. 3, 2014, pp: 631635.
[10] Praveen Rathod ,Dr.S.S.Dyavanal, “Non-Linear Static Analysis of G+6 Storeyed RC Buildings with Openings in Infill Walls,” Int. Journal of Engineering Research and Applications, Vol. 4, Issue 9( Version 5), September 2014, pp.51-58.
[11] A.Cinitha, P.K. Umesha, Nagesh R. Iyer, “Nonlinear Static Analysis to Assess Seismic Performance and Vulnerability of Code - Conforming RC Buildings,” WSEAS TRANSACTIONS on APPLIED and THEORETICAL MECHANICS, Issue 1, Volume 7, January 2012,pp39-48.